
Investor Strategy
August 6, 2024
No summer doldrums
Sign up here to receive the Market Ethos by email.
Executive summary
- Canada closing the gap in July
- What did we just hit?
- Duration dance
- Elections and markets
- Market cycle
- Final thoughts
Sometimes, you are driving along nicely, and suddenly, your car is jolted as you hit a pothole… well the market just did that… or maybe it’s a sinkhole. It was not that long ago that markets were making new highs as inflation cooled, the global economy was improving, and it seemed like a Goldilocks environment. So, what just happened?
EXTRA! EXTRA!
Special edition on the carry trade
Canada closing the gap in July
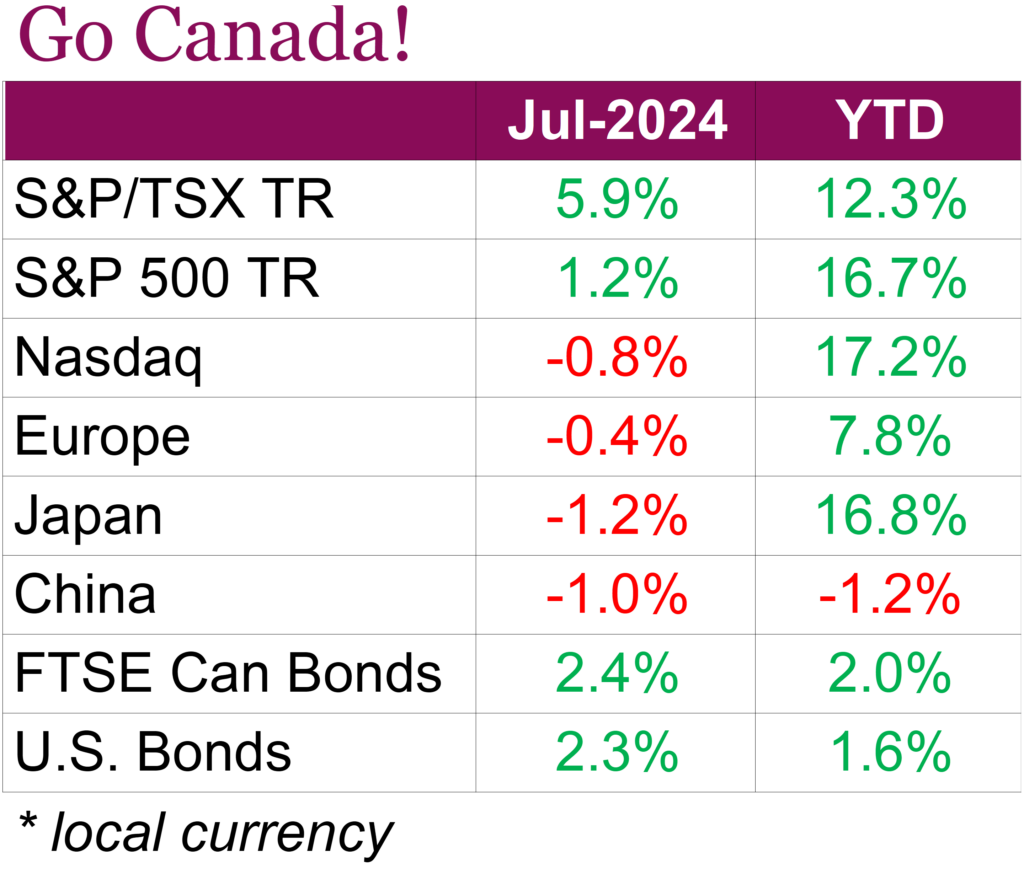
These days, it is hard to believe that the TSX would (or could) outperform the Nasdaq, but anything is possible. U.S. stock indexes appeared to run out of steam in July, with the S&P 500 TR up just 1.2% and the Nasdaq down -0.8% over the month. The disappointing returns came after lackluster earnings reports from mega-cap tech companies, declining AI sentiment, and concerns over continued weakening in the consumer sector weighed on investors. The TSX on the other hand got a boost, helped by improving economic signals and the BoC lowering interest rates for the second time since June to 4.5%. The index waited until the last day of the month to move above 23,000 points for the first time and closed at a record high, driven by gains in info tech and energy, finishing the month up 5.9%. Unlike the U.S., where a handful of mega-cap tech companies have driven big gains, the rally in Canada has been relatively broad-based. For now, the shift towards value and low-volatility stocks helped propel the index as well as earlier gains in commodities such as oil, gold, and copper, which are well represented in the Canadian Index. Despite the TSX’s impressive performance in July, the index is still trailing its U.S. peers, now up 12.3% on a total return basis, compared to the S&P 500’s 16.7% YTD total return and the Nasdaq’s 17.2% performance.
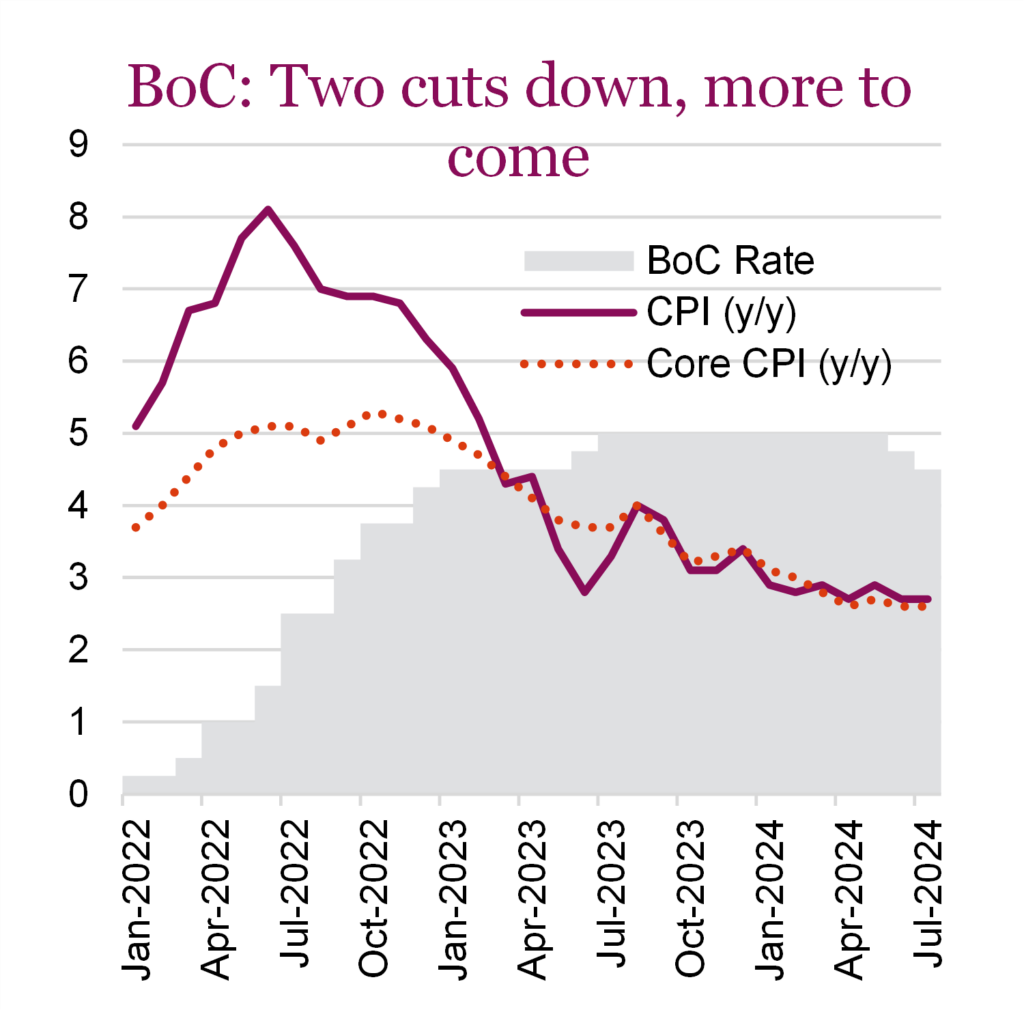
On the bonds side, Canadian and U.S. aggregate bonds were up 2.4% and 2.3% respectively, and now 7.3% and 5.1% for the one-year period (in local terms). The rise in bonds comes as central banks fully pivoted and either cut or signalled loosening of their monetary policies. Here at home, the Bank of Canada reduced its policy rate by 25 bps for a second consecutive time to 4.5%, while the Bank of England cut interest rates by a quarter-point to 5%, marking the first rate cut since early 2020. And although the Fed decided to leave the fed funds target rate unchanged between 5.25% and 5.5% at their July meeting, Fed Chair Powell said an interest rate cut could happen as soon as September if conditions, including confidence on inflation and maintaining a solid job market, were met.
While most central banks were considering the timing of rate cuts in July, the Bank of Japan was on a completely different wavelength, raising its benchmark interest rate to around 0.25%, from a 0%–0.10% range. (Keep in mind that Japan has been on a different monetary path for some time and the BoJ had controlled the yield curve and maintained negative interest rates since 2016 in an effort to stimulate economic growth and combat deflation). The decision to raise rates came as the yen hit a multi decade low at the beginning of the month. Overall, Japanese stocks underperformed last month, due to the weakness in global tech stocks, with returns further under pressure once the yen began to strengthen following the BOJ’s rate policy decisions. Expectations of earlier Fed interest rate cuts, coupled with an interest rate hike from the BOJ led to the yen seeing its strongest monthly move since June 2016.
Investors have also been paying close attention to corporate earnings, with Q2 earnings season well underway. With nearly 70% of the S&P 500 having reported by the end of the month, investors have been getting a clearer picture of how the market is feeling. The strong tech-led rally this year has shown some signs of broadening out to small-cap shares and cyclical names as investors rotated out of winning megacap names. The rotation out of the megacap names (mostly the Magnificent 7) came as stretched profit expectations failed to meet expectations, fueling concerns that the tech-driven rally of the first half of the year may be coming to an end. Investor sentiment has also taken a hit after Consumer Discretionary and Consumer Staples companies reported weak earnings results, with some seeing the weakness as another sign of potential cracks beginning to form in the U.S. economy as higher prices weigh on consumers.
What did we just hit?
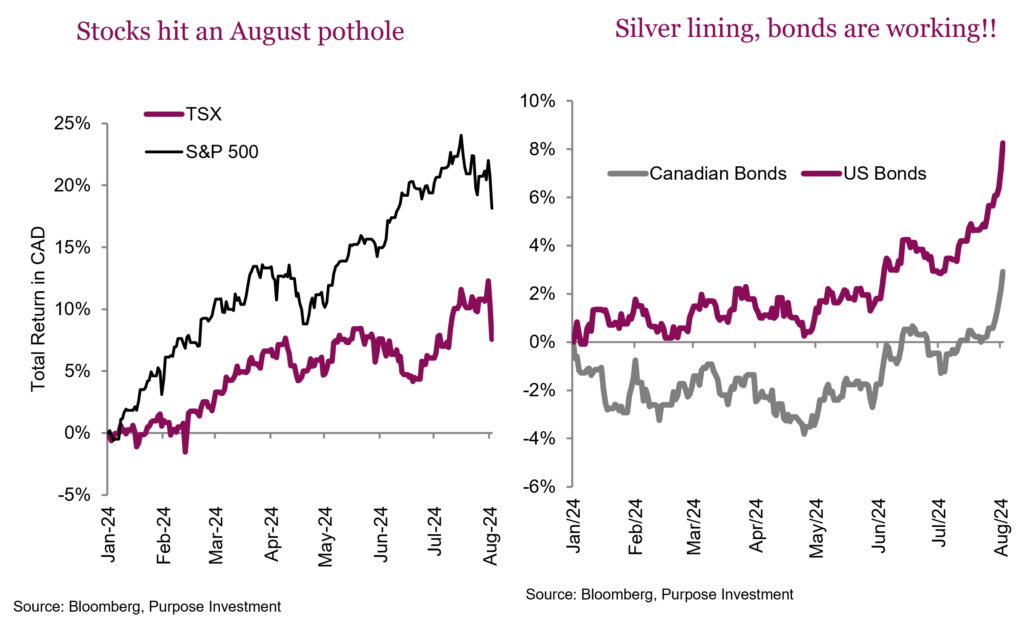
Sometimes, you are driving along nicely, and suddenly, your car is jolted as you hit a pothole… well the market just did that… or maybe it’s a sinkhole. It was not that long ago that markets were making new highs as inflation cooled, the global economy was improving, and it seemed like a Goldilocks environment. When we say not that long ago, the TSX made a new all-time high last Wednesday (July 31), yet it is now down about 4-6% over the past couple of days. So, what just happened?
We could highlight that softening economic data over the past few months was viewed as good news. It was good news because it meant the path of inflation was likely going to continue in the downward direction. This helped bond yields come down, too, which allowed for the market to trade at a higher multiple. But then the economic data crossed an invisible line in the sand, and that softer economic data is now too soft. Nobody is talking about inflation. Instead, the recession talk is rising. There is a silver lining however, with bonds working as a partial portfolio stabilizer.
In our opinion, this does look and feel like a long overdue corrective phase, albeit a very abrupt start. Markets have been going up since last fall, with just a brief dip in the second quarter. True, the economic data has softened, but it’s way too early to get excited about the recession risk. Given that many flows look like risk-off behaviour, that is common during plain vanilla corrections. The duration or depth remains unknown, but likely, a few days is not the end.
The general rule is that corrections are buying opportunities unless there is a recession nearby. Now, a couple of days does not make a correction –they usually do take longer to work themselves out – but this could be the beginning of one. So we could be seeing the development of a buying opportunity unless there is a recession. There is no denying that the economic data has softened and continues to do so.
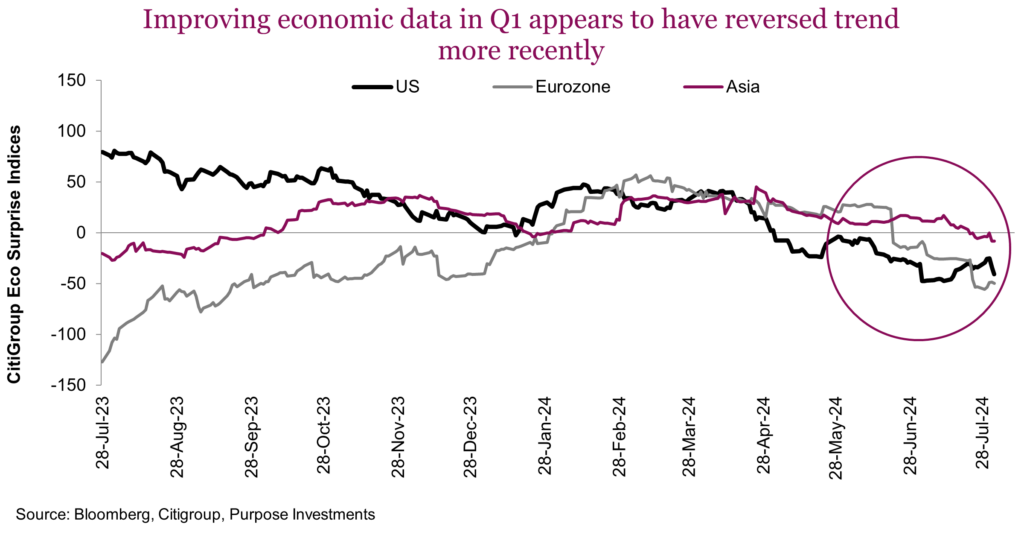
The data has actually been softening for a bit, and it has just become too much for the equity market to ignore. The bond market was listening for a while. The chart above shows the Citigroup Economic Surprise indices, which turned slightly negative more than a month back and have gradually been softening. Some softness does not mean recession. In fact, while our market cycle indicators have weakened a little, the cycle does appear reasonably intact.
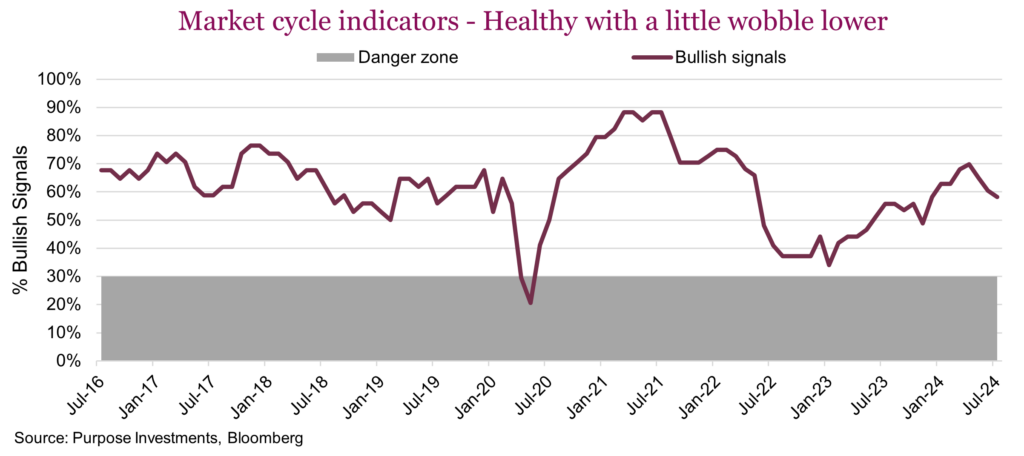
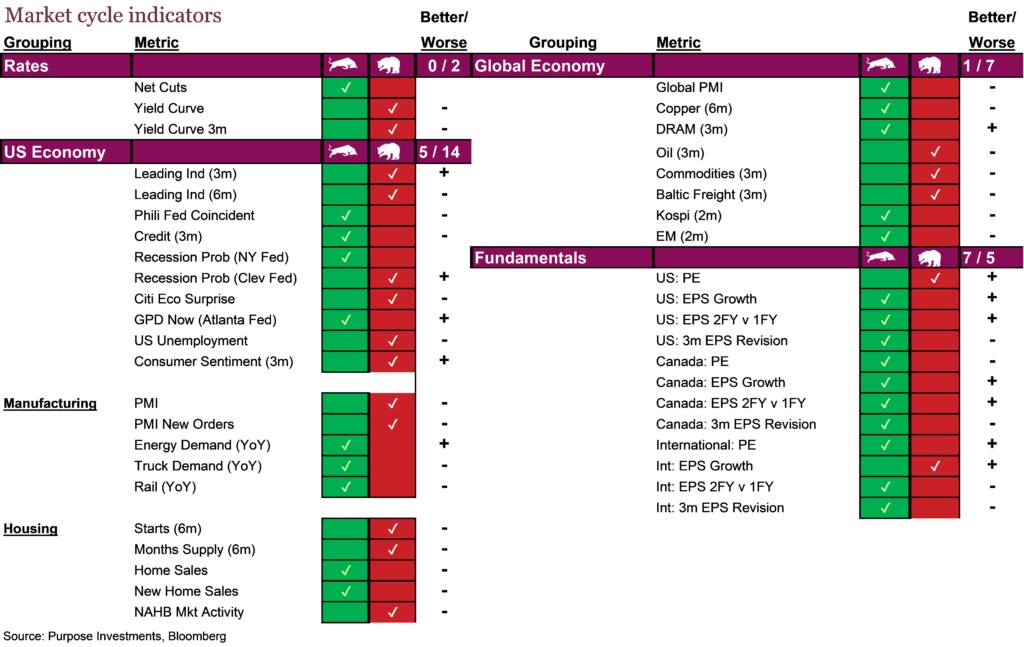
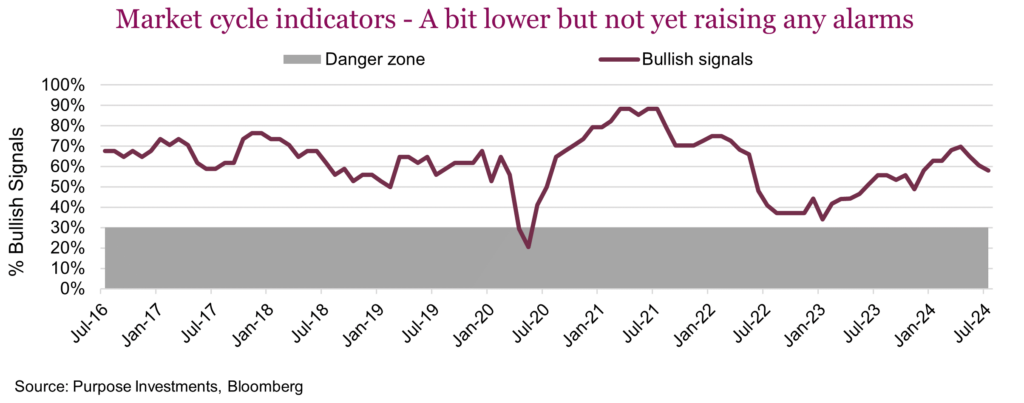
The market cycle indicators, which total over 30, are an equal-weighted basket of forward-looking economic, sentiment, fundamental, and rate signals. This helps provide a more rules-based approach to measuring the health of a market cycle. It does not provide hints on corrections; instead, it provides information as to the health of the overall cycle, trying to avoid those big bear markets. So, if the signals hold up during a correction, we feel more confident that it is a buying opportunity. And today, it remains decently healthy.
September and October are seasonally the months that see a spike in volatility and often a period of market weakness. But in an increasingly impatient world, maybe August is the new September/October.
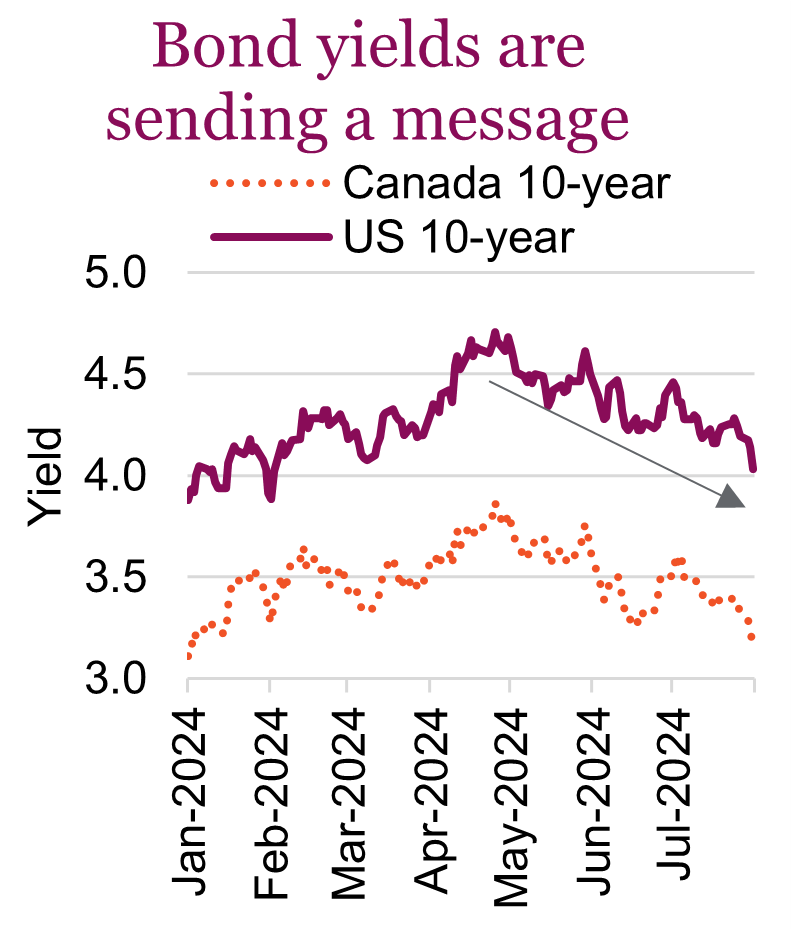
Duration dance
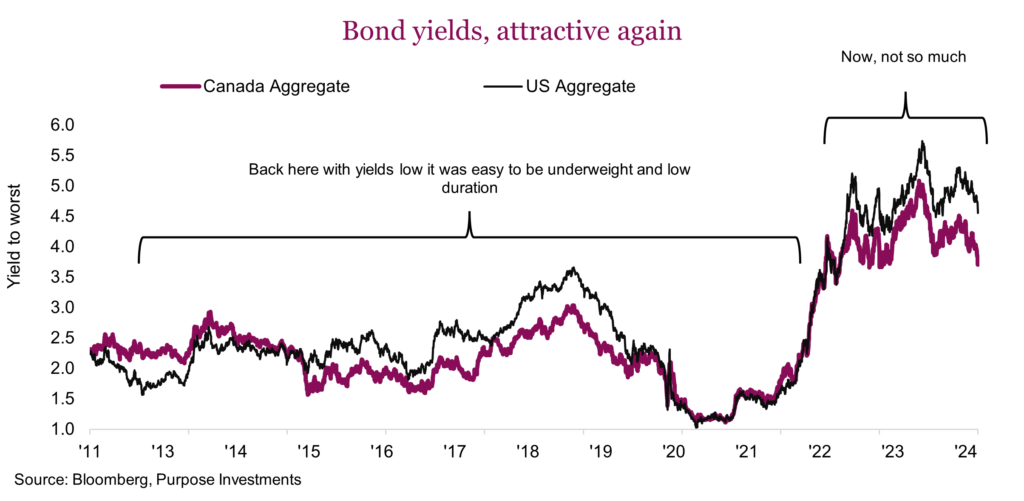
Years ago, when bond yields were 1-3%, it was an easy call to be underweight and carry lower than market duration. As bond yields rose over the past few years, we gradually altered our views, increasing the weighting and increasing duration. Today we are about market weight in bonds and carrying a duration of about 5.2. And now it is anything but easy.
There are some clear reasons to have a good allocation to bonds in a portfolio today. Yields are higher now than many years past, which translates into a higher forward return expectation. It’s best to push down the painful memories of how we got to these higher yields, as they may cloud your judgment about the future. Yields are attractive today.
Other bond-friendly positives include inflation cooling. Sure, it’s not a straight line, but the trend globally is to cooling inflation. And the global economic data, which was stronger earlier in the year, appears to be losing momentum. Perhaps even in the coming months, folks will start talking about recession risk again (we wrote this section on Tuesday, and it would appear recession talk has already started). A good thing for bonds. 2022 reminded (or taught) investors that when inflation is a big risk, stocks and bonds move down together. But when recession is the risk, bonds work really well as a diversifier. So, this recent rise of recession talk is clearly positive for bonds.
BUT don’t get too excited about bonds. Inflation is cooling, yet there are a number of longer-term trends that will keep it higher than in years past. On average, at least. Demographics are becoming less disinflationary. Global trade is slowing, and we are creeping towards a more polarized world. Supply chain diversification trends continue, as near shoring, also adding to inflation. And don’t forget all those labour wage gains during the past few years; this will keep inflation a bit higher than normal. Higher average inflation than the previous couple of decades will put a bit of a floor under bond yields.
And then there is the elasticity of yield demand. That is a mouthful, and we will devote a future publication to this concept, but in the meantime, here is the synopsis. Bond buyers are a very diverse group, comprised of governments, banks, pensions, institutions, funds/ETFs, and, of course, everyday people. During the previous decade, a higher proportion of bond buyers didn’t care what the yield was.
Rising global trade would result in foreign central banks accumulating U.S. dollars, often through Treasuries, not caring about the yield. Now we have global trade slowing and many foreign central banks diversifying their holdings away from Treasuries. Domestic U.S. banks had been parking increasing amounts of excess capital in Treasuries, caring more about their capital ratios than the yield. As yields rose, though, these banks are now sitting on large unrealized losses, which contributed to some bank failures in 2023. Rest assured, this cohort is much less of an enthusiastic buyer of Treasuries today. And, of course, the biggest bank, the Fed, has changed from quantitative easing to quantitative tightening. These are all buyers who would buy bonds and never care if they yielded 0.5%, 2% or 5%. Their demand is inelastic to yield, yet all of these buyers have diminished in size over the past number of years.
But bond auctions have not gone unsold, as different cohorts have filled the void. Investors, like you, me, clients, etc., have been enticed by higher yields in money markets or even along the spectrum of maturities. Money flow into cash vehicles has been very strong, as has flows into bond funds/ETFs. Unlike the previously mentioned groups of bond buyers, this group is very sensitive to changes in yields. This raises the question: will the flows continue if yields fall from 4.5% to 3.5%? Maybe, but probably slower. And at 3.0%?
Because the yield-sensitive group of bond buyers is now likely a larger component of demand compared to the folks who don’t care about the yield, we believe the elasticity of yield demand has risen. This means if yields fall too much, demand should soften, thus arresting how far lower yields can go.
Moving from the demand side to supply, well, there is no shortage of supply. Given how corporations binged at the debt trough during the past decade of low rates and too much liquidity, the maturity walls will continue for years to come. And with governments running deficit levels more applicable to recessions or wars, there is no shortage of supply. That, too, will keep yields higher than the previous decade.
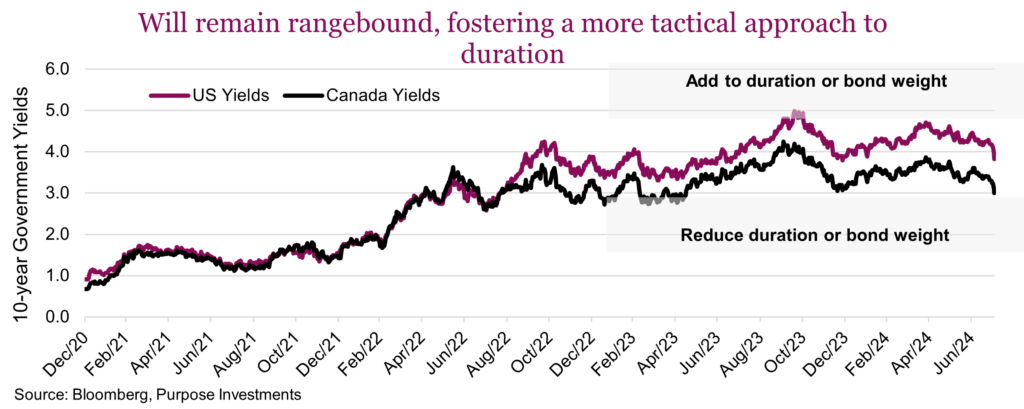
If you add all this into your mental model, yields are unlikely to come back down or go way up. Welcome to the rangebound bond market, in our view. As a result, we believe being a bit more tactical with bonds and duration will add value over time. Add this to healthy yields, and you have a decent combination. So, with yields falling over the past couple of months, we would be more inclined to trim bonds or reduce duration a tad.
Elections and markets
2024 is an election year, just about everywhere. Already behind us are India, the UK, France, and Mexico (to name a few), and the big U.S. showdown is coming up in a few months. Not surprisingly, this creates the most often-asked question: “How should we position a portfolio ahead of the election?” The challenge, of course, is you never really know who is going to win, and even if you had a good idea, how the market reacts or what policy is actually implemented are two other big variables. It is like a bunch of coin flips.
Just look at the Mexican market drop and lack of any recovery after electing the party often viewed as less business friendly. While in India, when Modi lost his clear majority, markets dropped for a day, then recovered and have continued to move higher over subsequent months. France’s CAC 40 has not enjoyed their election process. But the UK market seems to like the labour party winning results. The only constant is some level of volatility, but even that seems pretty random.
We would also be cautious about listening too much. Even if confident about the result, can you take their intended policy statements made during the campaign period as rock solid? How many times have we seen promises for “no new taxes” amount to nothing? Campaign talk has the objective of winning votes and doesn’t always translate into real policy.
And then how the market reacts is a big variable. When President Trump won in 2016, markets dropped hugely in overseas trading. Markets never like surprises. But they had largely recovered by the open in NY and finished up on the day. Global markets went on to rise for the next year. The S&P 500 in 2017 only had 4 days that it dropped more than 1%, and it never fell more than 2%. It was one of the smoothest upward-trending rides in market history.
One could easily let confirmation bias kick in and attribute the great market to the new president. Not so fast. The market started trending higher before the election, likely thanks to synchronized global growth for the first time since before the financial crisis. After 2008, we had this kind of rotation of problems globally. The U.S. and Japan were doing fine, but Europe was suffering. Then, when Europe started to improve economically, Japan stumbled. When Japan was getting back going, the U.S. slowed. But in early 2016, they all started humming along nicely.
It’s the economy, silly. It does matter more than who sits in which seat. In fact, looking at past elections and which side won in the U.S. leads to really no clear winner regarding market performance. A great analysis by the U.S. Bank Asset Management Group found a very weak connection between election outcomes and the market. But a stronger connection between economic growth and inflation trajectory and the market. If you look at market performance with improving or deteriorating economic activity, well that paints a much more clear picture compared to who wins the election.
Or, for some other evidence, under President Joe Biden, the S&P 500 energy sector is up 196% while the Wilderhill clean energy index is down 75%. This is probably not what one would have expected.
We are not saying to ignore the elections; they have the chance of adding a lot of volatility to markets and injecting a good amount of uncertainty or surprises. And remember, markets usually don’t like surprises. Outside perhaps adding a bit toward volatility management, it is probably best not to meddle with your portfolio construction based on elections.
Market cycle
Market cycle indicators have remained decently on the bullish side, albeit with some softening during the past month, mainly in the U.S. economic data. Fundamentals remain encouraging. If we see a dramatic drop in more signals, that would contribute to potentially changing our mindset, but for now, this could simply be the start of a corrective phase.
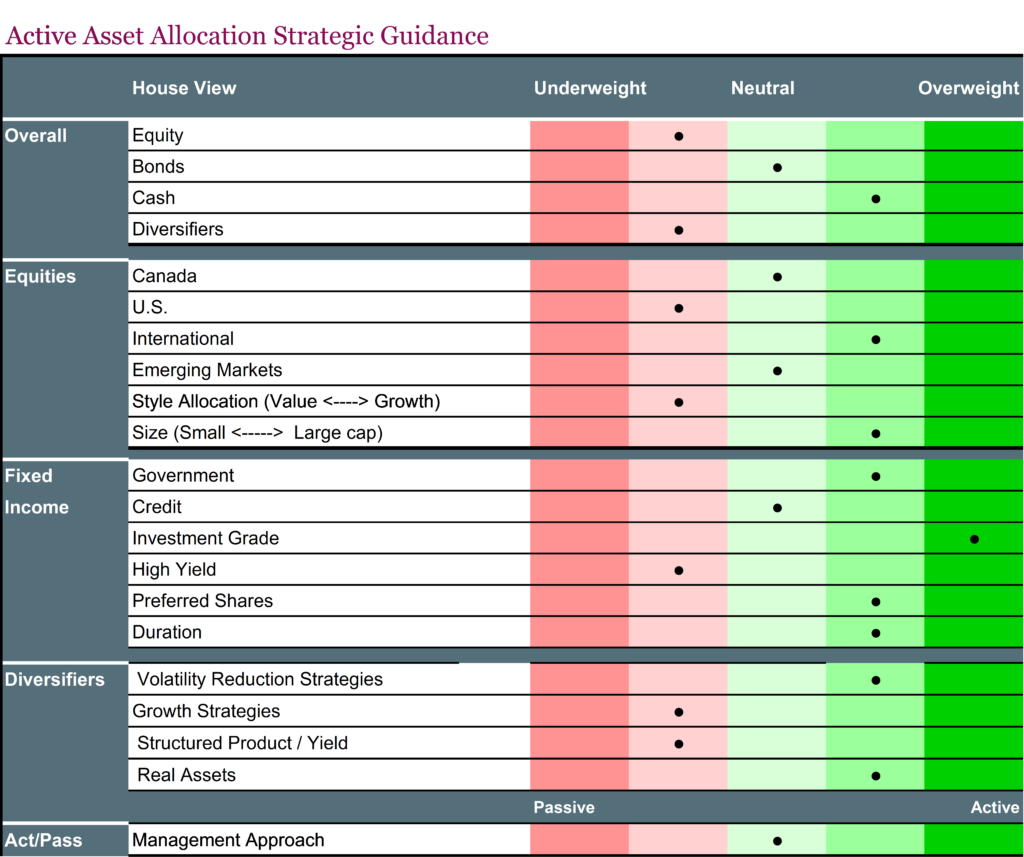
From an asset allocation tilt perspective, we remain mildly or moderately defensive. We hold a bit more cash, a lot more bonds, and less equity. The bond allocation is more conservative with less credit exposure. Diversifiers are also focused on volatility management strategies. Our higher cash balance is considered dry powder, so if this does grow into a more interesting correction, we may be enticed to do some buying.
Final thoughts
If this does develop into a full-on correction, it might actually be a healthy development. The market was extended and overly concentrated. Some recalibrating could help with the longevity of the cycle. While we would expect economic recession talk to grow louder, so far, the data is only moderating. Given all the data, this looks more like we hit a pothole (albeit a big one) than a sinkhole.
Extra! Extra! Special edition on the carry trade
What just happened to markets on our holiday Monday? Most are still scratching their heads as to what happened as the market weakness from last week took an abrupt turn for the worse. The S&P 500 dropped 3% Monday but was down 4.2% in early trading, putting the index at a 10% decline from its high in mid-July. The NASDAQ dropped 3.4%, putting it off 13% from its July high. But this wasn’t the big story.
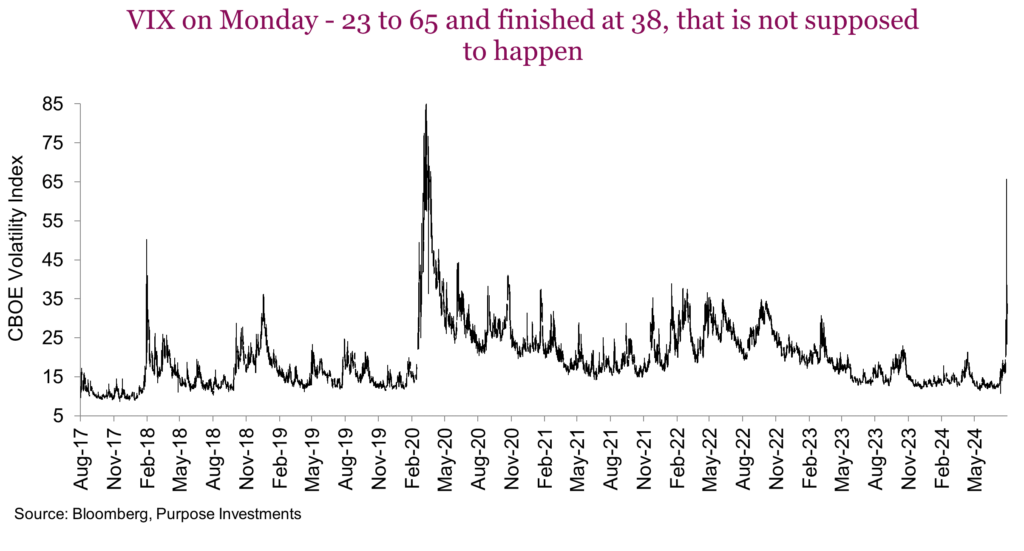
The volatility index (VIX) climbed from around 20 to 65 at the market open before calming down to settle in the high 30s. Looks to be opening around 31 to start Tuesday’s trading. To provide some context, the VIX peaked at 85 during the COVID bear. 65 was pretty close to 85, but this isn’t that. This appears to be a closer resemblance to the ‘Volmageddon‘ of early 2018. As a quick refresher, volatility started to rise for more normal economic reasons but it then triggered the implosion of several short-volatility ETFs in January of 2018. These short volatility strategies had produced great returns thanks to historically low volatility over the previous couple of years and gained increasing assets. It was also a crowded trade among hedge funds/quants.
In 2018, the spike in volatility was too much, and many strategies started to unwind. In so doing, they were net sellers of market exposure, which accelerated the market decline and increased volatility even more. And then they were gone, or at least nearly gone. While these products do exist today, thankfully, product folks have made them somewhat safer, and their size isn’t what it used to be.
Instead, this market volatility looks more like a very rapid unwind of a very popular carry trade. A carry trade involves borrowing at a low interest rate and re-investing the proceeds in a higher-yielding investment. When interest rates moved higher in most jurisdictions starting in 2022, including the U.S., and interest rates stayed low in Japan – the carry trade was on! Investors would borrow money in Japan, paying really low rates, and invest in the U.S., which could have been through treasuries or even the U.S. stock market.
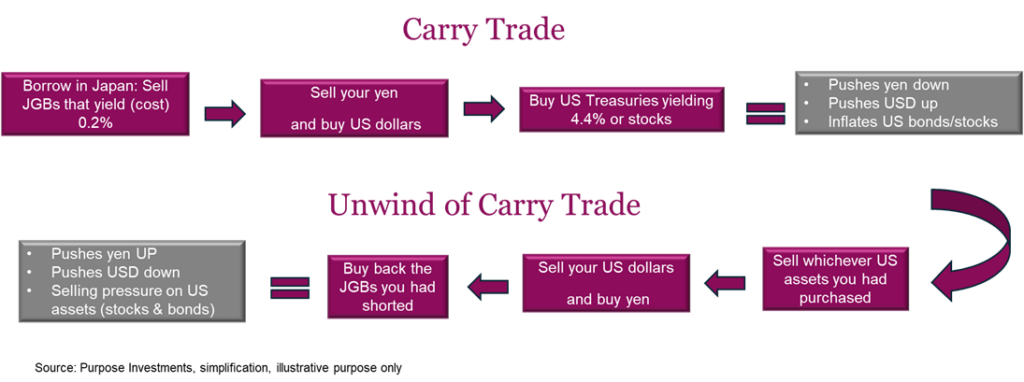
This trade is effectively shorting the yen. The yen had remained relatively stable at 110 to the USD for years until the Fed started raising rates while the Bank of Japan kept theirs around zero. The yen then continued to weaken from 110 in March of 2022 to 160 this past July (that is how much yen it costs to buy a dollar). That is a serious devaluation of a major developed currency over a couple of years. And for the folks with a carry trade on, it increased the profitability since they were borrowing in yen. Yen becoming cheaper made their liability less. Making money on the yield differential and on the currency. Juicy!
Now, it looks like there was a stampede for the exit. The yen climbed from 162 to 144 over the past couple of weeks, with the biggest daily moves being made in the last few sessions. No clue what triggered this apparent unwind. Maybe it was the softer U.S. economic data that elevated Fed Rate cut expectations. That would start to diminish the profitability of the carry trade. As some started to exit in previous weeks, that increased to a near stampede on Monday.
Here is why we think this is a rapid unwind of the carry trade:
- The yen has been appreciated a ton, very quickly, for no real economic reason.
- The U.S. dollar was down on Monday. One would think during such a risk-off day, the U.S. dollar, as often viewed as a safe haven currency, would have risen. It didn’t because folks were selling USD to cover their yen short positions.
- Last week, with softer economic data, U.S. yields kept falling. On a huge risk-off day like Monday, one would think yields would fall… they didn’t. In fact, the shorter yields rose. Unwinding the long side of their carry trade had them selling Treasuries.
This may be a simplification that likely has many other moving parts. It could also be the options market that has become massive. Of course, the important question isn’t really why it happened but what happens next.
What happens next
Of course, this could continue, and it could morph into something different. Big market moves like this often expose those not wearing pants (or those with too much leverage). And it is difficult to ascertain how big the carry trade had become. Some estimate it is half unwound, but it’s really hard to say.
The good news is this appears kind of mechanical, a rapid unwind of the carry trade exacerbating the move in pockets of the market, bleeding into the overall market. A mechanical unwind of big trades creates the mispricing of assets. So unless this carry-mageddon spreads to cause further damage or bleeds into the real economy, this could prove to be a buying opportunity.
Everyone has become more aware the economic growth of early 2024 has slowed. But it does appear early to get worried about recession. Our market cycle indicators have slipped a little but still remain decent. And if the economy remains in growth mode, albeit slower, then a correction is an opportunity.
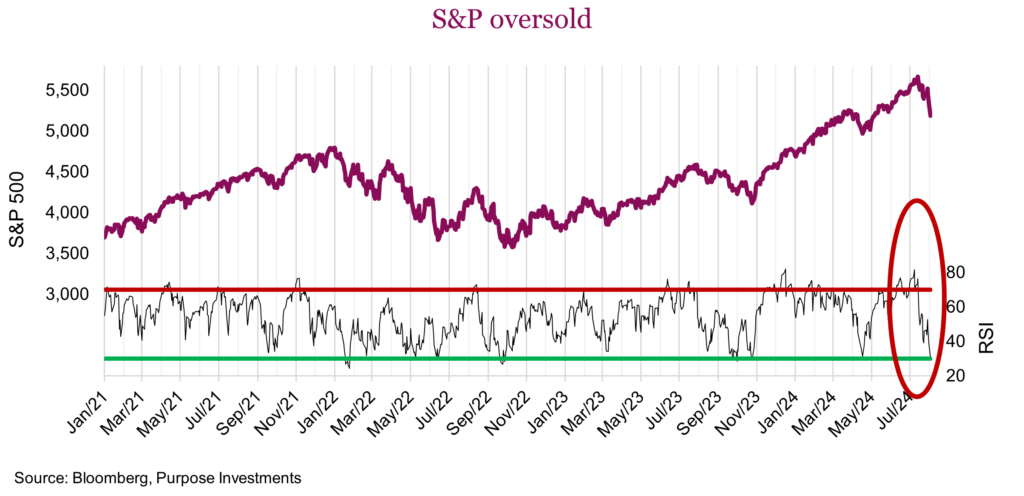
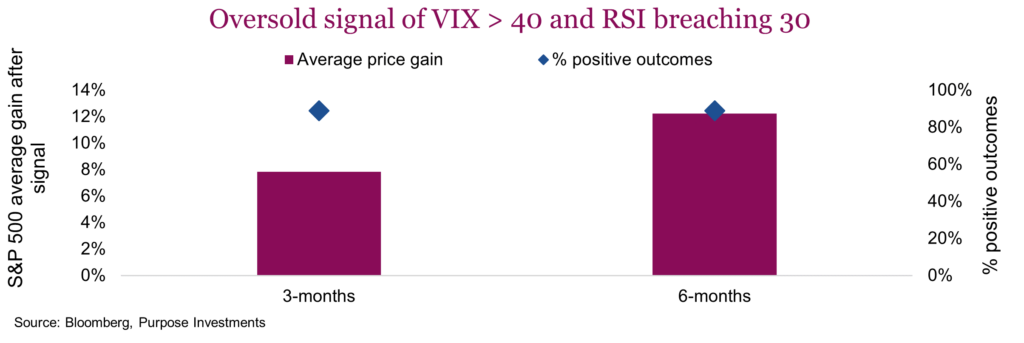
If an opportunity, well timing is everything. On this, the data is rather mixed. Two reliable indicators flashed buy signals on Monday – the spike in the VIX was one, and the S&P 500 relative strength (RSI) breached 30. Over the past 30 years, this combo has been a very reliable signal, with the biggest exception being in 2008. So unless you think the financial system is on the verge of collapse, this Monday signal looks encouraging. We did some buying across our Purpose Active multi-asset portfolios on Monday. When markets move, long weekends get cancelled.
But we did say things are mixed. Ideally, this corrective phase would be longer in the tooth. Its speed certainly leaves the door open for more weakness. It would also be nice if market breadth was weaker. Currently, about 45% of S&P 500 members are trading above their 50-day moving average. This metric is a more reliable buy signal when lower.
Diversification and well-constructed portfolios remain the prudent path. And if courageous enough to do some bottom fishing, certainly maintain a defensive tilt and keep some powder dry. There may be more to come. Clearly, market volatility in the 2nd half of 2024 is going to prove much more challenging than the first half.