Investor Strategy
May 6, 2025
Rollercoaster
Sign up here to receive the Market Ethos by email.
- April showers and flowers
- Hard fast data & earnings
- Gold – Too late to buy
- Why cash still makes sense in a volatile rate environment
- Market cycle & portfolio positioning
- Final note
April showers and flowers
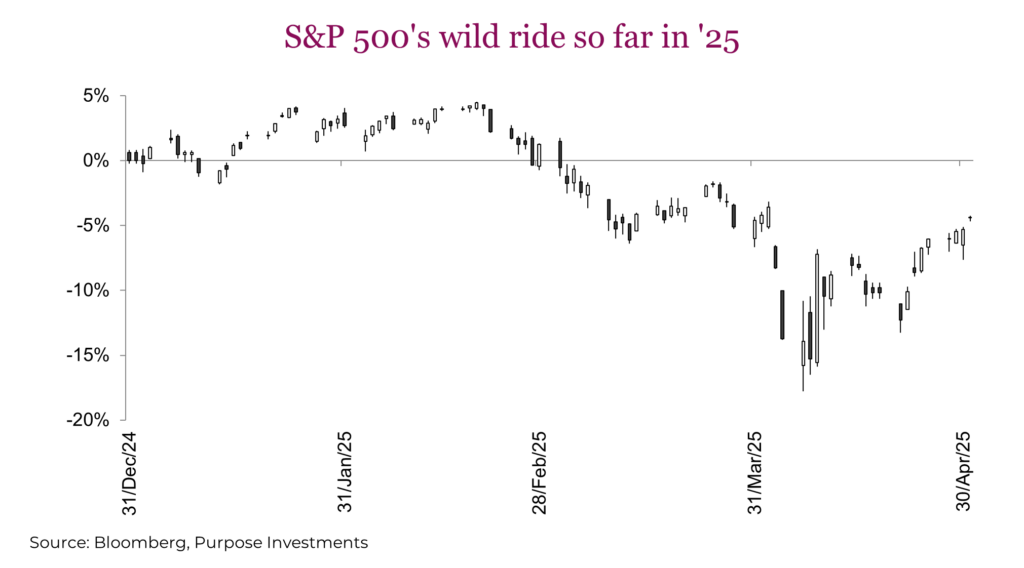
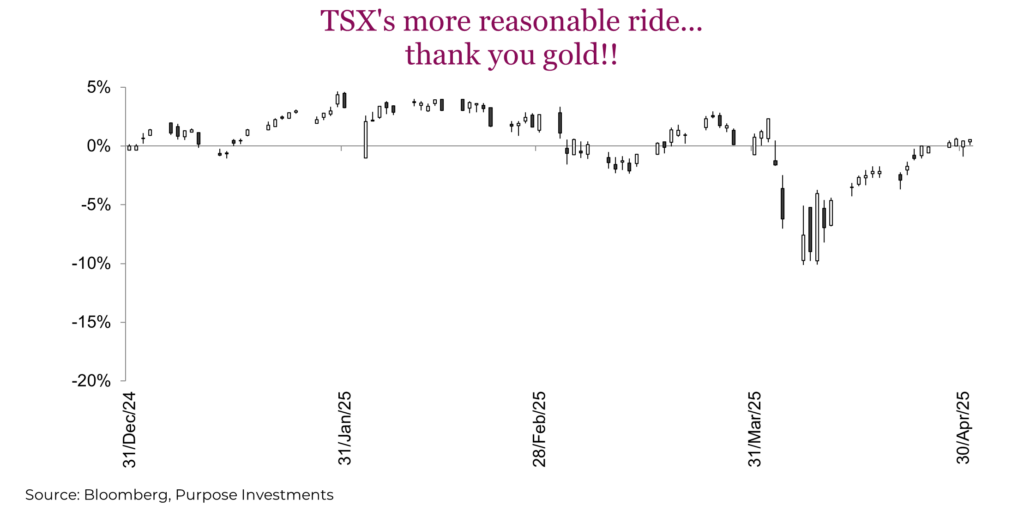
If you weren’t paying attention to the markets (or the news in general) and were to only look at the monthly performance figures, you may have thought that April was a calm month. That couldn’t be further from the truth. April returns for major indexes do not fully capture the drama that unfolded during the month, with global indexes highlighting just how quickly sentiment can shift. Investors faced growing trade uncertainty at the beginning of the month, digesting Trump’s “Liberation Day” trade announcements, with equity markets seeing steep selloffs following the announcements. The S&P 500 fell over -12% in the days following “Liberation Day”, with the index narrowly avoiding a technical bear market, missing the threshold by just over 1%, but officially entering correction territory in April. That was until Trump announced that he would postpone his tariffs, helping the index to rally close to 10% in just one day. While markets saw large swings in the days that followed, the S&P 500 steadily climbed at the end of the month to finish just -0.7% lower on the month on a total return basis. North of the border, Canadian equities as measured by the S&P/TSX Composite index, were somewhat shielded from the worst of the swings thanks to the index’s gold exposure. Still, the index declined nearly -11% following President Trump’s trade actions, then recovering to end the month flat.
Policy uncertainty continued to weigh on investor sentiment over the month, with the outlook for U.S. economic growth and consumer sentiment growing murkier. The latest Conference Board Consumer Confidence survey fell for the fifth consecutive month, while the Expectations Index, which reflects consumers’ short-term outlook, dropped to its lowest level since October 2011. GDP data seemed to back up these concerns, with data showing the U.S. economy contracting by -0.3% in the first quarter of 2025. This marked its first decline since 2022, primarily due to a rise in imports ahead of tariffs and weaker consumer spending, well below the average growth rate of 3% seen in the previous two years. Canada’s economy also appears to be slowing, with preliminary estimates showing that the economy grew at an annualized rate of 1.5% in the first quarter of 2025, falling short of the Bank of Canada’s forecast of 1.8%.
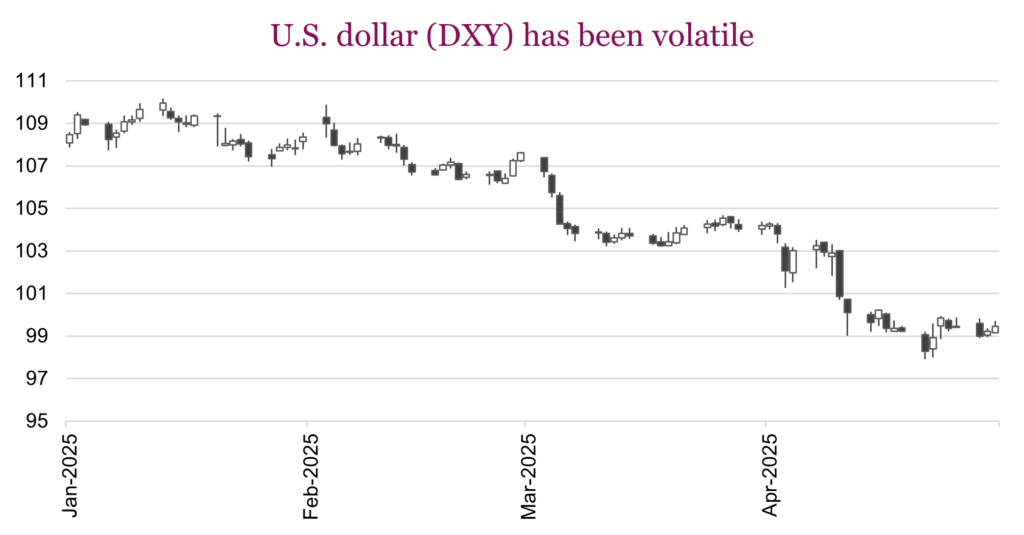
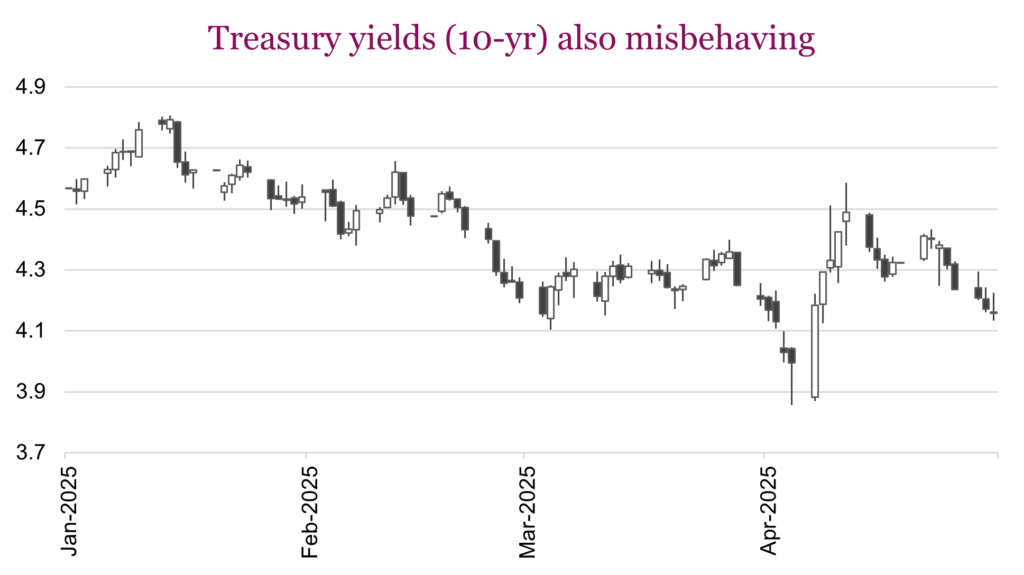
We’d be remiss not to highlight some of the market surprises that emerged during this policy-driven correction. Traditionally, U.S. Treasuries and the U.S. dollar have acted as reliable safe haven assets during times of stress. Not this time. Treasury yields, which move inversely with bond prices, spiked to nearly 4.5% in the weeks after the tariff announcement (though they have since moderated), while the U.S. dollar weakened against a basket of global currencies. In contrast, classic safe-haven assets like gold, and currencies such as the Yen and Swiss franc held their ground, emerging as April’s top performers. In today’s policy-led markets, even the usual safe harbours may not behave as expected.
Add to this an election in Canada, talk about replacing Powell as head of the Fed, OPEC increasing production … some months are quiet, this was one of the noisiest. The market is often driven by confidence, which was dramatically eroded by the policy uncertainty. This has created a market we would characterize as especially sensitive to policy news. If Dr. Jekyll shows up on any given day with policy news the market dislikes, things drop. If the more market-friendly Mr. Hyde policy news appears, markets recover.
We would never say this is what we expected to start 2025, as the scenario has truly been unique. However, it is loosely following our expectations. The first phase would be a period of market weakness on policy uncertainty. We had expected it earlier in the year and thought the market would recover once there was some clarity, even if bad news. Markets handle bad news better than uncertainty. Not sure we have a lot of certainty, but market have partially recovered as uncertainty has diminished … for now.
So with markets partially or in a few cases fully recovered, what happens next? At some point later this year we do believe earnings estimates will come under pressure and/or the economic data will soften enough to elicit recession fears in the market. If this transpires, we believe that may create an opportunity to shift. In the meantime, this market can continue to recover as long as Dr. Jekyll doesn’t show up again.
Hard fast data & earnings
Market valuations change often based on confidence in the future of earnings and the economy, which can oscillate substantially. In January, the S&P was trading over 22x forward earnings, during the despair of the tariff show dropped down to 19x and has since recovered to 20x. This was all a changing “P” in the PE ratio as the “E”, earnings, remained relatively stable at $275. But what is that “E” going to do next?
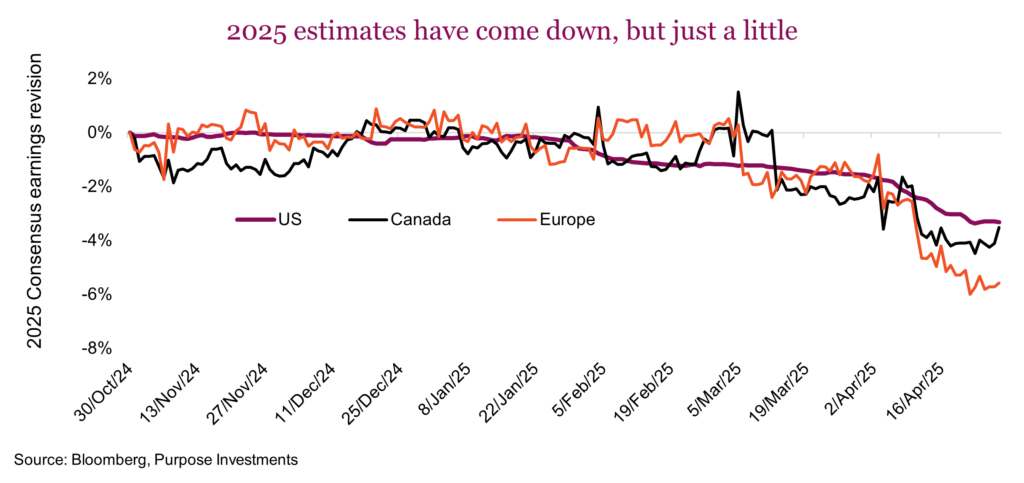
While earnings revisions have been predominantly negative, analysts trimming estimates, the magnitude has been minor. Not surprising as the case to cut earnings would require a firm view that the economy is slowing or tariffs (once/if implemented) would hit earnings. Given the uncertainty on tariffs, it’s not surprising analysts aren’t rushing out to ‘guess’ the outcome and adjust their estimates accordingly. Instead, they are likely waiting for policy to become clear or for the companies to provide guidance indicating so. But companies are in the same boat — they simply don’t know. The solution has been a strong trend of companies removing guidance, they don’t want to guess either way. Add it all up, estimates are largely stable but we would bet many analysts are ready to cut estimates if given an excuse, such as clarity on tariffs, company guidance or if the economy starts to slow down more.
Consensus 2025 earnings estimates have come down over the past few months but the magnitude is minor so far. This does run the risk of accelerating in the coming months but not today!
With Q1 earnings season about 70% complete for the S&P 500, the positive surprise rates are solid. In fact, Q1 consensus earnings had fallen from $62.50 to $60 but as companies report more resilient earnings, this estimate has climbed quickly back to $64. Most corporations are skilled at navigating changing business dynamics and adjusting to maintain profitability. So far anyway.
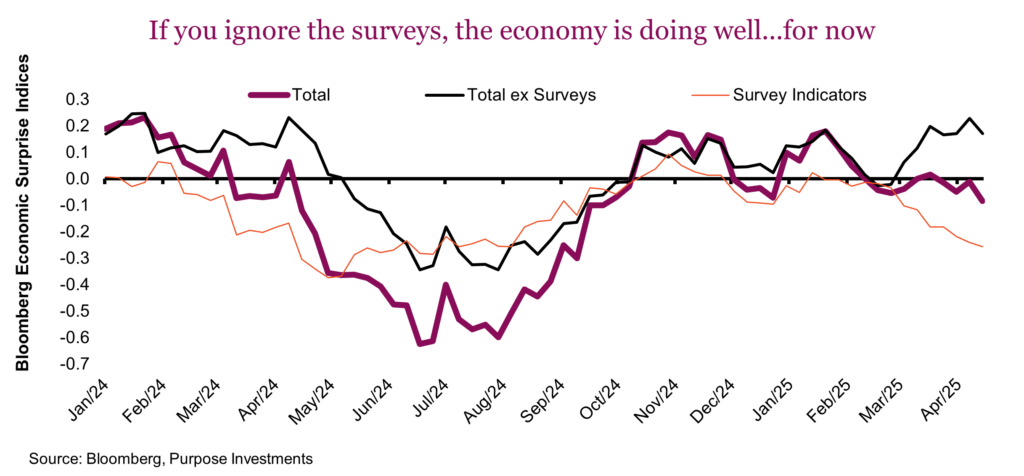
Tariff uncertainty is a challenge for corporations, adding more uncertainty to decision making. A bigger challenge would be if the economy slows. We have previously highlighted the divergence between the soft or survey data and the hard economic data (Investor Strategy: April 2025).
The chart below is the Bloomberg Economic Surprise index that measures how the economic data comes in relative to consensus expectations. It has started to turn negative but this is largely due to the survey data. The soft data is so dire, but these are surveys and not actual behaviour. For a measure of actual changing behaviour in the economy you have to wait for the hard economic data, which is more delayed given time to collect, calculate, and so far is not really showing much economic weakness.
A strategy to get an earlier peak at the economy’s trajectory is the faster hard data or higher frequency data. This is often alternative data series that are measuring actual behaviours (no surveys here). The volume of people flying often turns early when the economy is slowing, but so far people are still flying. OpenTable seated diners in the U.S. is up high single digits over the past few weeks, so people are still eating out. Looking at retail spending data, people are still shopping. And while the labour market has seen a small uptick in weekly jobless claims, it remains at non-alarming levels.
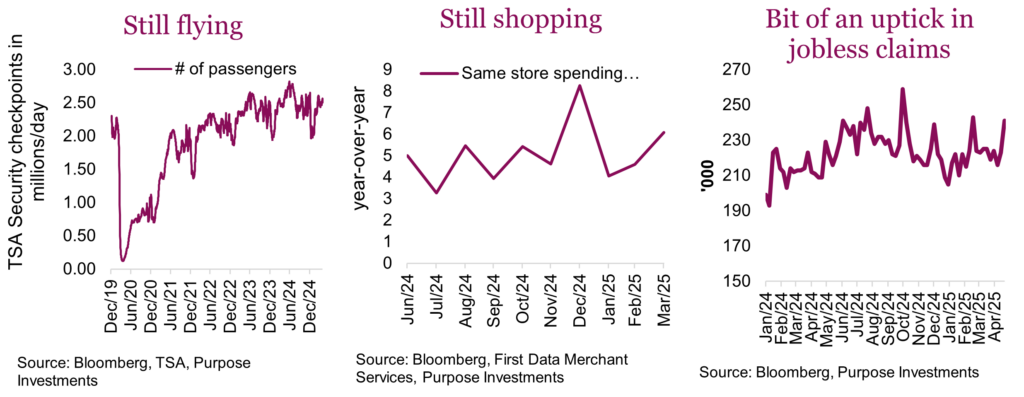
For the most part, the faster hard economic data has not shown much sign of deterioration. So for now we remain in a decent fundamentally sound world from both earnings and the economic data, despite the ongoing uncertainty. Watching these faster moving signals will be crucial in coming weeks and months for signs of slowing that could lead to a recession scare of some sort. For now it is all about policy uncertainty, ebbing and flowing.
Gold – Too late to buy
Amidst all of the uncertainty this year, one asset has shined far more than the rest. Gold prices went on an absolute tear in April, reaching a peak of $3,500 US/OZ. Gold has been trending higher for over a year, but the velocity of the most recent move was most impressive. With gold currently up over 25% YTD as of the end of April, the big question for investors is whether it’s too late to buy, or time to sell?
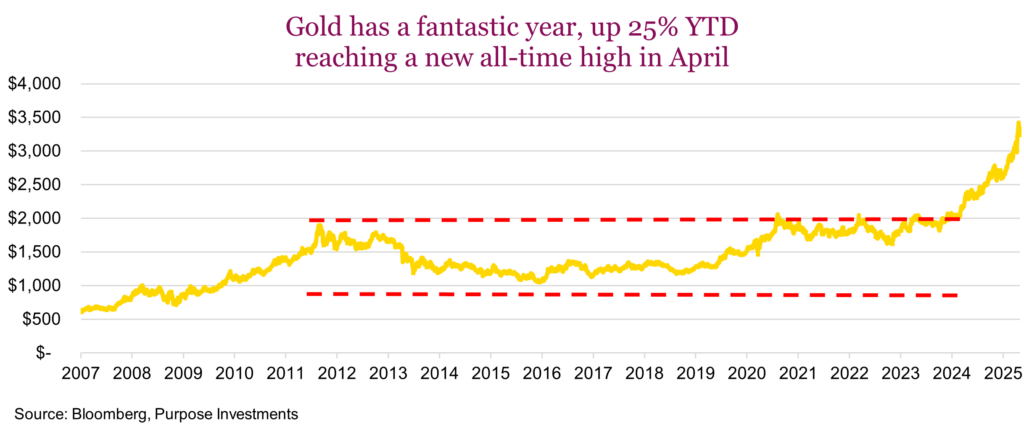
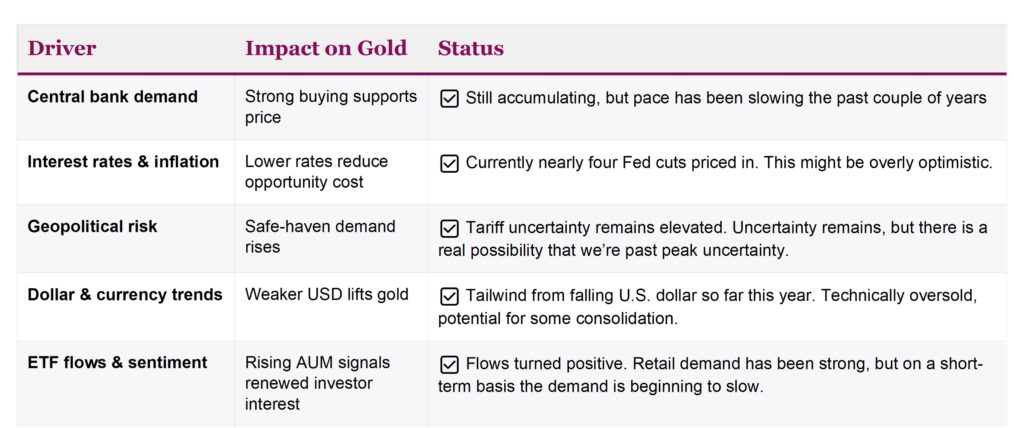
As a portfolio diversifier, gold has done a terrific job this year, but nothing goes up in a straight line forever. Over the past few years there has been a somewhat fluid narrative in terms of what drives gold prices. In aggregate, we see five key drivers of gold demand which are outlined below:
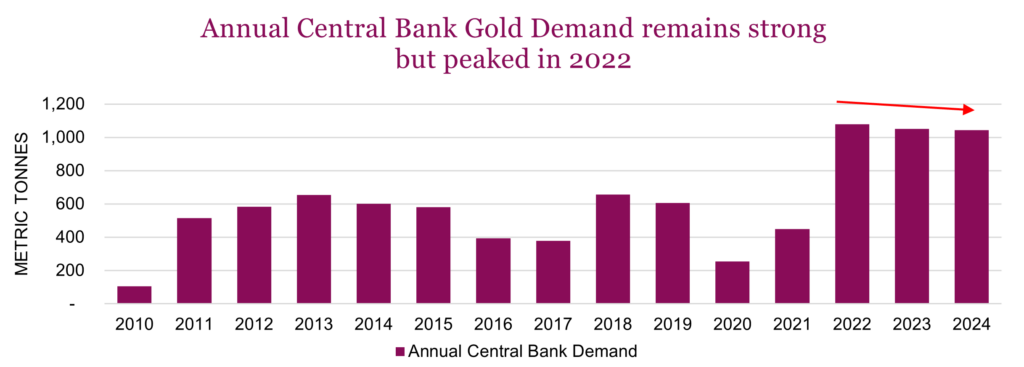
Central bank demand and policy shifts
This bullish argument has been in place for a number of years now. It’s been a primary driver of physical gold demand following the Covid crisis and Russian invasion of Ukraine in early 2022. Central bank demand surged in 2022, reaching a record and has stayed elevated since, as central banks around the world aim to further diversify reserve holdings. This trend is expected to continue, but it’s important to remember that it has been in place for some time and this demand does not appear to be growing. 2022 was the peak year for central bank buying and it has been steady but declining slightly in 2023 and 2024.
Inflation and interest rates
Gold is seen as an inflation hedge. We won’t dig too deep into whether this reputation is earned or not. Most recently, it didn’t do much to protect from inflation in 2022 as gold prices were absolutely flat. It does tend to be more correlated with inflation expectations rather than actual increases in CPI. Its relationship with interest rates is somewhat more quantifiable. Gold historically has a negative correlation to interest rates, it tends to do well when rates are falling and struggles when rates are rising. Currently the market is expecting nearly four cuts by the Fed this year. This has already increased by from just about two a month ago. While the trajectory of longer-term bond yields is difficult to ascertain, we can clearly see what the market is expecting on the short end of the curve. At this point there is real risk that expectations might be overly dovish.
Geopolitical risks
This is crisis alpha in action. During times of complete chaos, gold demand surges as a safe haven. Gold is notoriously hard to value. It’s a non-productive asset with little tangible utility. It makes nice jewelry and has some utility in high tech electronics, but the true value does not derive from these demands. One of the better mental models that helps gauge gold’s true value is that the price of gold is directionally proportional to the inverse of trust in the financial or political system. When trust in the system declines, gold shines.

Trust in the financial and political system was certainly rocked in April. It’s hard to quantify, but it’s certainly possible that trust bottomed along with peak market uncertainty in the days following the Liberation Day announcement.
Currency markets
A weaker U.S. dollar typically lifts gold prices as it’s priced in dollars. In 2025, the U.S. dollar index has weakened considerably after reaching 110 in early January while markets were still enthralled with the prospects of a Trump 2.0 presidency. Since then, the greenback has fallen 10% and is currently trading just below 100. Could the U.S. dollar fall further? For sure, but it really depends on the time frame. A 10% move in such a short amount of time is rather rare, especially for the world’s reserve currency. It takes a big shock to move it to this degree, and given the current technical oversold conditions, we’re more inclined to think that there will be some consolidation or reversal in the near future.
ETF flows and investor sentiment
After outflows from 2020-2024, tons of stored gold through ETFs bottomed in May of 2024. Over the past year, demand has increased by 11%, a decent uptick but still quite far off the levels we saw in 2022. Though the rising trend remains in place, the pace of the increase appears to be topping out. Looking at the 4-week rate of change, ETF demand peaked in late March. While still positive, the pace of incremental flows has cooled. We still believe there is room to run for ETF flows, but retail buyers are price sensitive and the flows are slowing down.
The table below outlines these key drivers in a much more simplified and organized manner. All five of the key drivers have been working out recently. It’s been the perfect storm for gold, but storms only last so long. Given that five out of five drivers are currently bullish, we’ve curbed our enthusiasm on gold. We believe it may be too late to buy, and are continuing to monitor our position as it’s performed exceptionally well as of late.
Why cash still makes sense in a volatile rate environment
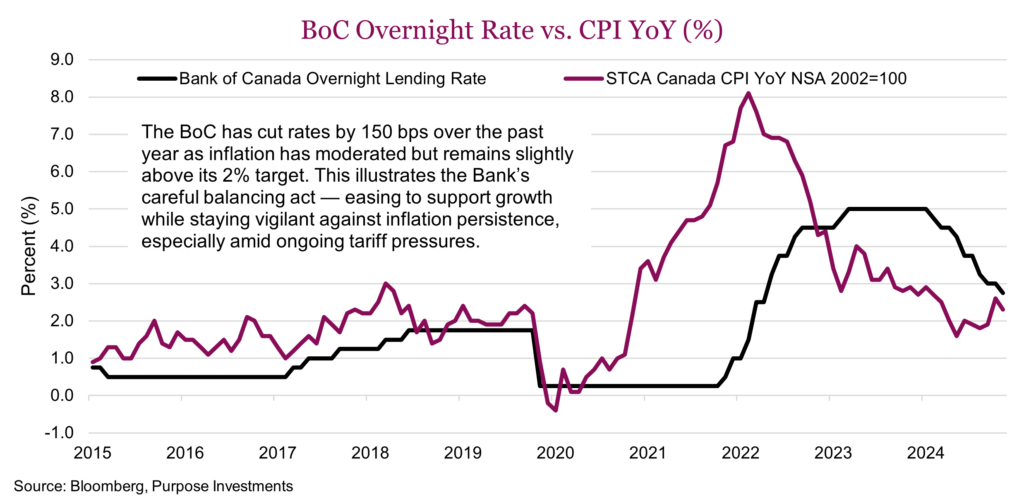
After seven consecutive rate cuts, the Bank of Canada (BoC) held its overnight rate steady at 2.75%, citing global uncertainty and mixed domestic data. With inflation still elevated and policy rates on hold, cash continues to offer a compelling mix of yield, liquidity, and protection against volatility —a prudent choice as investors wait for clearer signals on the policy and economic fronts. In an environment where geopolitics remain unstable, fiscal support is still early-stage, and inflation sits above target, liquidity becomes strategy — not just defense. With cash offering competitive yields and low volatility, maintaining strategic liquidity through cash remains a disciplined and effective approach to portfolio management.
Policy in pause: What the data says
The BoC remains in wait-and-see mode as economic signals send mixed messages. February GDP contracted by -0.25% — the weakest monthly reading in over two years — with widespread weakness across mining, real estate, and retail sectors. March’s preliminary estimate suggests a mild rebound, with Q1 GDP now tracking at 1.5%, annualized, slightly below the BoC’s 1.8% forecast. The bank has reiterated that it will remain reactive rather than proactive, waiting for more decisive shifts in the data before adjusting its stance. With the overnight rate likely within the neutral range and trade-related uncertainties still lingering, the BoC has good reason to proceed with caution.
Soft indicators, particularly the manufacturing PMI, have continued to trend lower since the start of the year, remaining below the 50 threshold in both February and March — a clear sign of ongoing contraction in industrial activity. Business sentiment has yet to recover meaningfully, reinforcing downside risks to the growth outlook.
Hard data presents a mixed picture. Employment fell by 32,000 in March — the largest drop in three years — pushing the unemployment rate to 6.7%. February retail sales declined -0.4%, though core retail (excluding autos) rose by 0.5%, indicating some resilience in discretionary spending.
Inflation remains central to the BoC’s mandate. CPI picked up to 2.3% year-over-year, reflecting some persistence in underlying price pressures. Tariff-related effects remain a key risk going forward. The Bank continues to assess whether current interest rates remain appropriately restrictive to guide inflation back to target. While further hikes appear unlikely, persistent inflation — especially if tariff-related pressures materialize — could delay the timing or extent of future rate cuts.
Fiscal dynamics: A Carney government impact
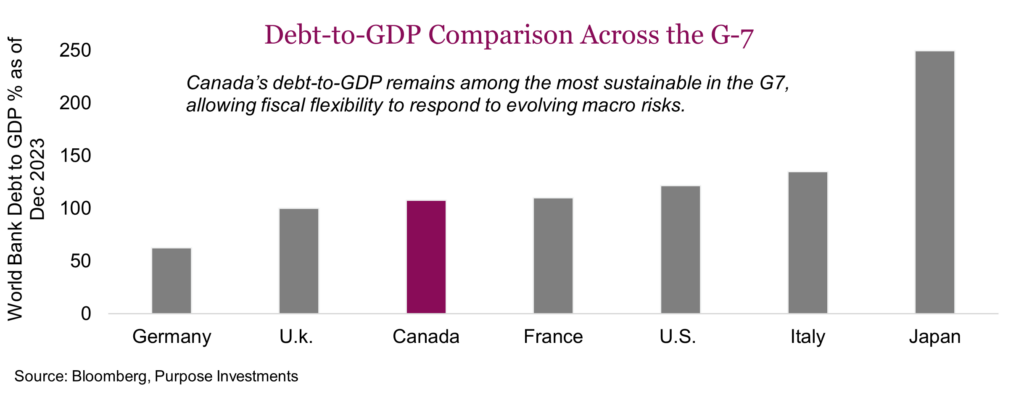
With Mark Carney now confirmed as Prime Minister, fiscal stimulus will become a central policy lever. The platform outlines more than $130 billion in new investments over 2025–2029, while generating an expected $51 billion in new revenues and savings. Carney’s plan focuses on long-term growth and making the economy more resilient. With debt-to-GDP at 107.5% — the third lowest in the G7 — Canada has room to use fiscal policy without putting public finances at risk.
Conclusion: Stay liquid, stay flexible
With growth signals softening in Canada and across the globe, the economic outlook remains murky. Given that markets have seen a robust rebound off the recent lows, we remain cautious and believe a healthy cash balance makes sense. Markets currently anticipate two additional BoC rate cuts this year, potentially bringing the overnight rate to around 2.25%, though the timing remains uncertain. The BoC has signaled a shift toward data dependence — choosing to respond to incoming evidence rather than front-run policy moves. If cuts resume, it may reflect persistent economic weakness, further reinforcing the defensive value of cash.
Market cycle & portfolio positioning
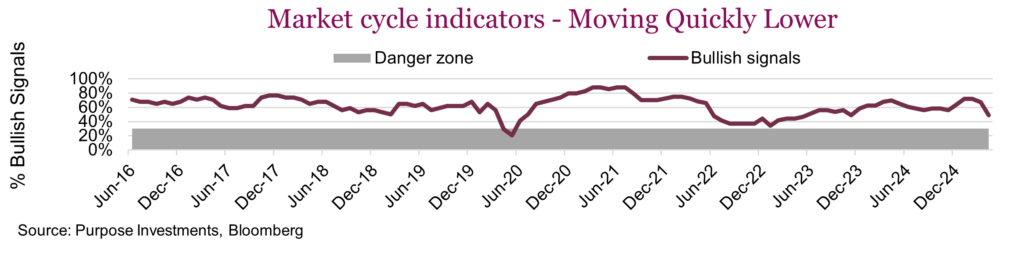
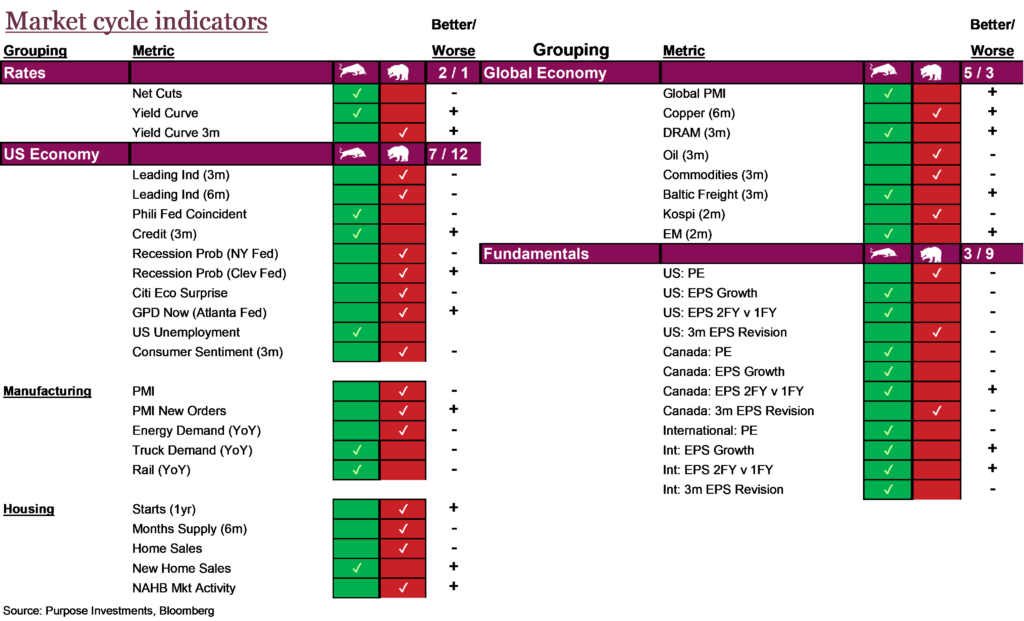
The market cycle indicators include a number of faster-moving signals and lately they have been softening pretty quickly. While not in the danger zone at this point, the loss of momentum is very noticeable. The number of signals that have turned bearish is pretty widespread. Over the past month the tally is Rates (-1), broader U.S. Economy (no change), U.S. Manufacturing (-1), U.S. housing (-2), Global Economy (-3) and Fundamentals (-2). Not screaming recession, but the rumblings are getting louder. Given this is with a backdrop of rising equity prices, something has to give. Either this data changes course or the market will… at some point.
Final note
Policy uncertainty rocked markets in April, and more recently easing policy pressures has enabled markets to materially recover. This highlights the danger of reacting to policy news, as it can change very quickly. Could it ratchet up again, for sure. Could it keep improving, yep. This is more a coin flip as a tweet or Truth Social post can change the environment quickly. Given the market recovery, it may be getting close to levels that are ignoring the risk of future uncertainty.
More importantly, the risk is deteriorating earnings, and economic data may become a larger driver of markets in coming months. These factors can’t be soothed by a tweet. A recession scare in the coming months is a rising probability event. Stay defensive as this may also create opportunities.
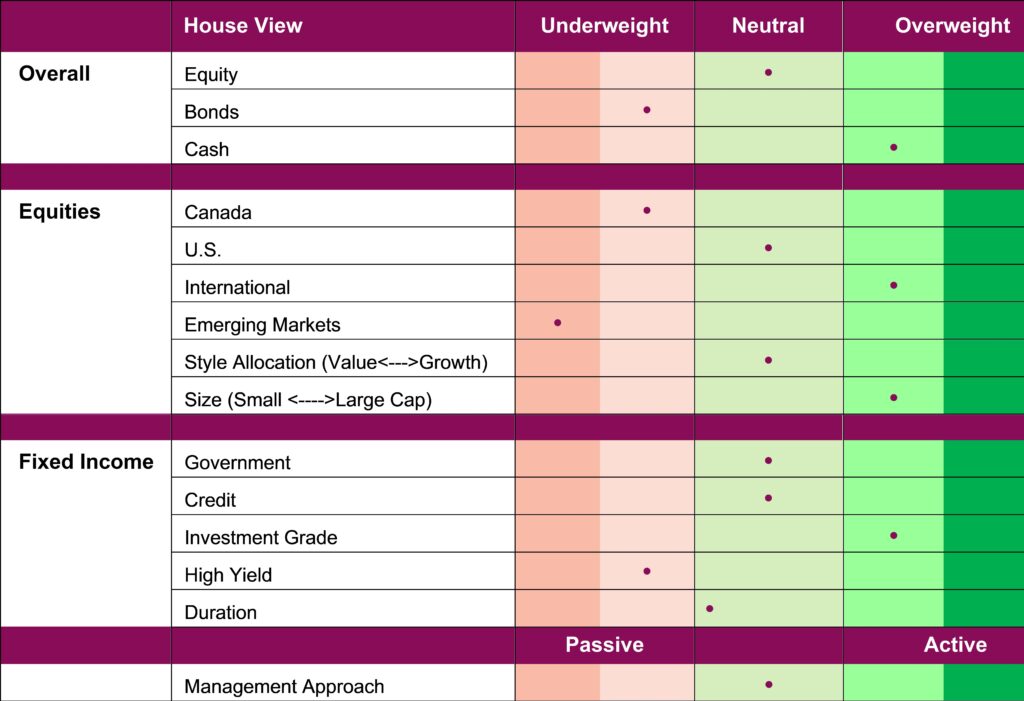
Portfolio Positioning