
Investor Strategy
7 April 2026
Navigate the noise
Sign up here to receive the Investor Strategy by email.
Crude March
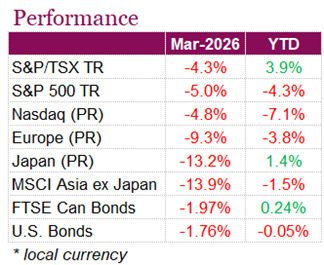
March was defined by uncertainty, something markets rarely tolerate well, leaving investors with few places to hide. The risk-off sentiment weighed on equities, bonds, and even traditional hedges. The TSX fell -4.3% over the month on a total return basis, while the S&P 500 declined -5.0% and the Nasdaq dropped -4.8%, the latter even hitting correction territory after falling more than -10% from its late-January peak at one point. Equity weakness has been broad, though most pronounced in areas like materials in Canada and technology in the U.S., both of which enjoyed outsized returns last year. In Canada, the TSX held up relatively better than the S&P 500 due to its energy exposure, though still found itself negative on the month. Fixed income also struggled, with the U.S. Aggregate Bond Index down -1.76% and the FTSE Canada Universe Bond Index falling -1.97%, as yields climbed higher on inflation concerns. If that wasn’t enough, gold declined -11.4%, underscoring how difficult this environment has been for investors. Year to date, The S&P/TSX Composite Index remains positive, up 3.9%, supported by earlier strength in commodities. In contrast, U.S. equities have moved firmly lower, with the S&P 500 down -4.3% and the Nasdaq Composite off -7.1%. Fixed income has been relatively more stable but still slightly negative, while gold remains up 7.1% despite its March pullback.
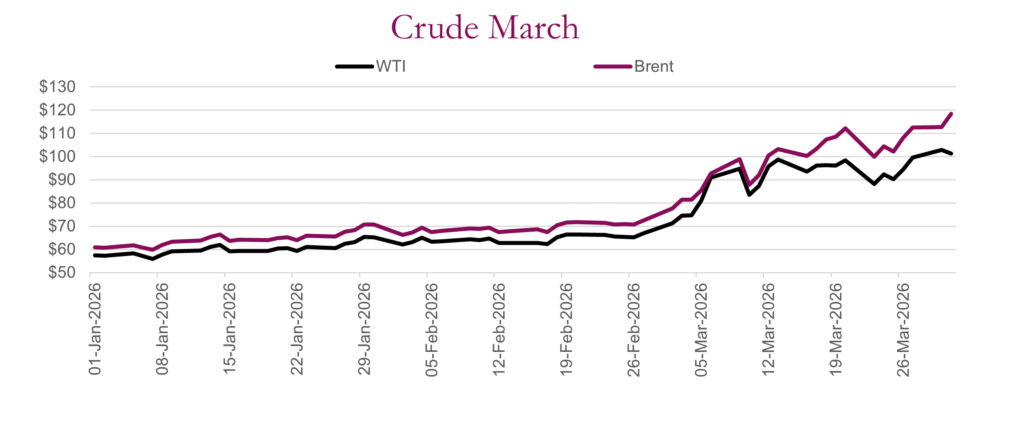
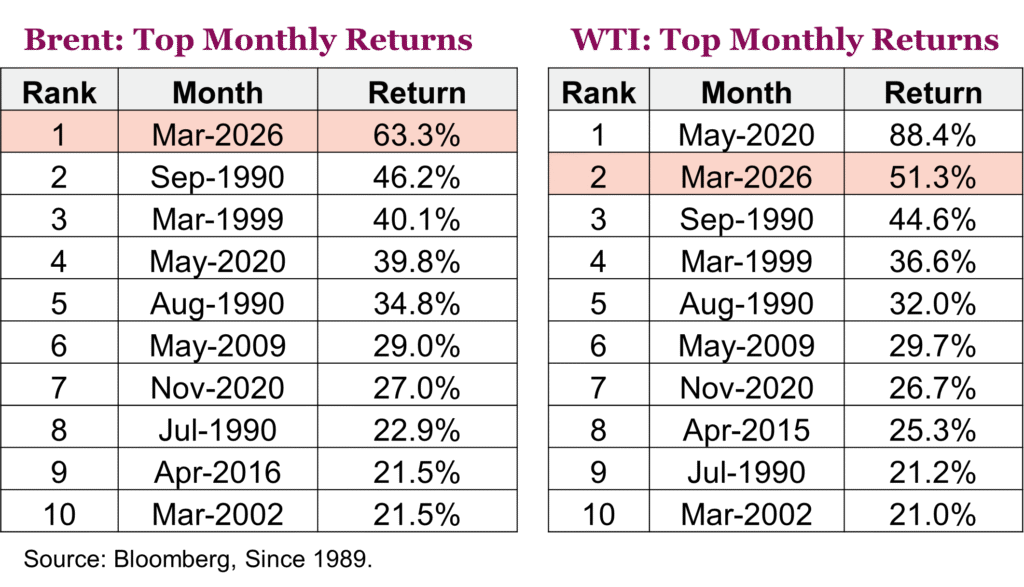
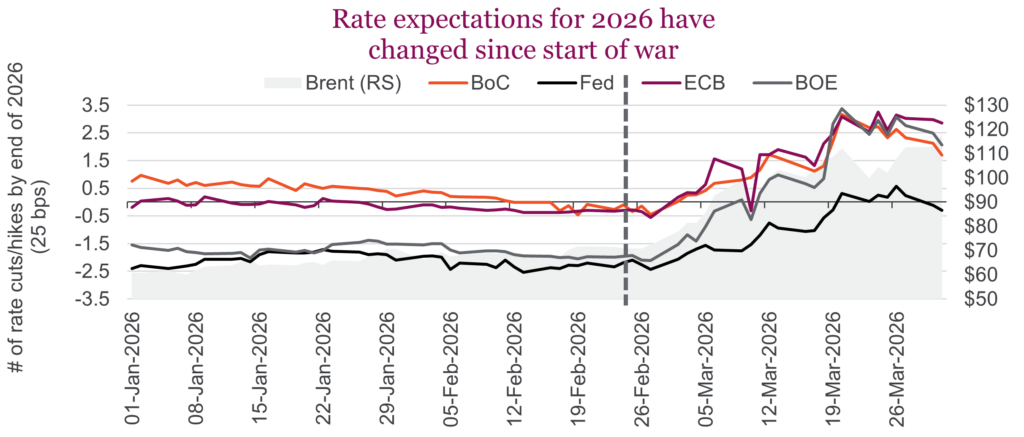
So, what did go up in March? Well, oil for one. Oil markets experienced an unprecedented rise in March, with Brent crude jumping over 60% (its largest monthly gain on record) as the Iran conflict triggered a historic supply shock and severely disrupted flows through the Strait of Hormuz. This shock has reintroduced stagflation concerns, where rising inflation coincides with slowing growth. This backdrop has been difficult for central banks to navigate, with increased attention now on how central banks will react. Despite both the Bank of Canada and the Fed holding rates at their current levels in March, markets have quickly adjusted expectations on the path of monetary policy. Bond yields have risen significantly, with U.S. 10-year Treasury yields climbing above 4.4% and short-end rates moving even more aggressively. This has pushed expectations away from rate cuts this year towards tightening. Inflation pressures have already begun to reaccelerate, with early readings in Europe showing headline CPI moving higher, and expectations in the U.S. and Canada that prices will also move higher. Credit spreads have begun to widen, and consumer sentiment has weakened, pointing to growing caution among both investors and households. At the same time, growth data has remained relatively resilient, leaving central banks in a wait and see position at the moment.
While markets did find some relief on the final trading day of the month on hopes of a potential de-escalation in the Middle East conflict, we aren’t out of the woods yet. Donald Trump signalled the war could end soon, suggesting the U.S. may exit Iran within two to three weeks, although markets have seen similar timelines come and go, with the lack of follow-through becoming a common occurrence. Iran also retains meaningful leverage through its control over the Strait of Hormuz, leaving oil to continue to hover around its recent highs.
War, easier to start than stop
Markets continue to oscillate daily based on the headline news flow. Now with the U.S. clearly outlining the desire to de-escalate in the coming weeks, if we believe the headlines, this is obviously good news. But the path remains uncertain.
So how to be a prudent investor in times like this? Not overreacting is one of the keys. Along with thoughtful diversification but also a well-diversified defense. This creates flexibility or optionality to be opportunistic should markets overreact. In this Investor Strategy we are going to I) recap one news-filled quarter, II) talk about what’s on sale and what isn’t, III) offer our thoughts on geographic diversification, and IV) take a deeper dive into layered diversified defense.
I. An eventful Q1
After the U.S. extracted the Venezuelan president, folks got a little worried there might be too much oil as long-past production capacity would gradually come back online. No need to worry about that anymore. AI euphoria on its unbridled capacity buildout transitioned to concern over the return on the spend and how AI productivity gains would disrupt many industries. This is the AI paradox. If it is going to disrupt so many businesses, the capex buildout should have a good return: if not, it shouldn’t happen.
Gold was up almost $1k in January before giving it all back on the last day of the month. It then steadily recovered in February, almost back to previous highs before dropping $1k as the Iran conflict flared up. Rising geopolitical risk, gold down a lot, that seems odd. If you own gold, you must accept it will often do things that really don’t make sense, and at times it will be frustrating. Maybe that is why it is such a good diversifier.
The ongoing conflict in the Middle East is by far the biggest event. At the time of writing, it sounds like things might be de-escalating. Obviously, that can change, or perhaps it’s not even true. It does fit our base case that this will remain a bombing campaign and as munition levels get lower / running out of targets, a pivot will come. Add to this if there is enough weakness in equities and/or treasuries, we could see a TACO similar to the tariff fiasco. Let’s hope this logic doesn’t hold too well as a strong market recovery could then elicit re-escalation.
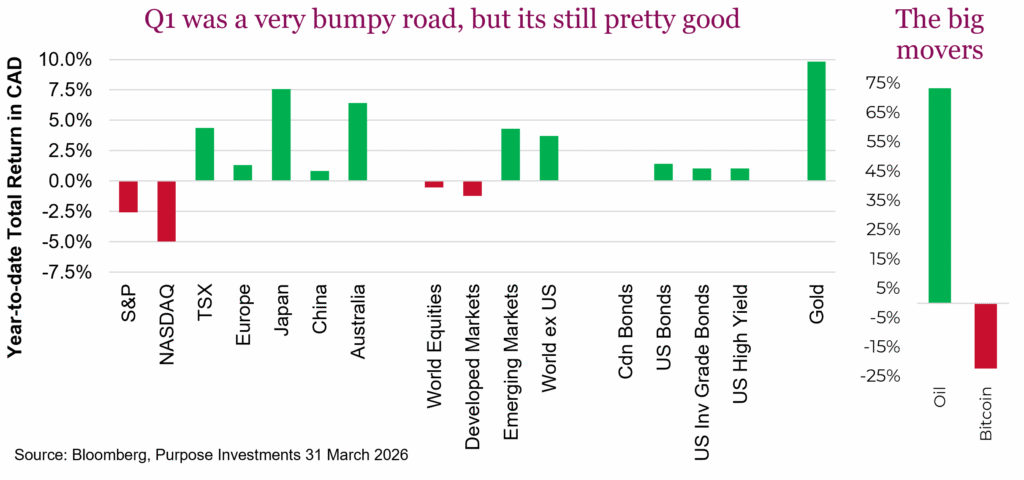
Despite all the crazy headlines and macro events so far in 2026, markets did well. U.S. equities were down a bit, led by technology. But most other markets were in the green. Even bonds posted small but respectable gains. Of course, these bar charts hide a lot of ups and downs along the way, but given all the headlines, still pretty good.
II. What’s on sale, what isn’t
Despite what academic research says, markets are not always rational. At present, we find ourselves in an unusual spot. Valuations are coming down while earnings expectations are going up. That’s not supposed to happen. Usually one follows the other, not the opposite direction. So how does this resolve? Prices going up is one way, and probably the way we’d expect this to work out over the medium term.
Earnings season will be important for markets to get fresh updates from the corner office. We have our eyes on software names in particular. The space has seen the most severe multiple correction over the past couple of quarters as AI disruption fears have taken hold. The “sell first, ask questions later” mindset has created some genuine opportunities.
On the macro front, it’s too soon to say with certainty how the Iran war oil shock will impact the economic growth trajectory and inflation. A month of elevated oil is a nuisance. A few months and it will start to bite. Margin compression remains the big risk as financial conditions have tightened and inflation expectations have risen, but let’s not get ahead of ourselves. For now, the base case remains intact, just with a slimmer margin for error than we had in January.
Follow the money – The 3-month earnings revision picture tells a clear positive story, even if it’s a narrow one.
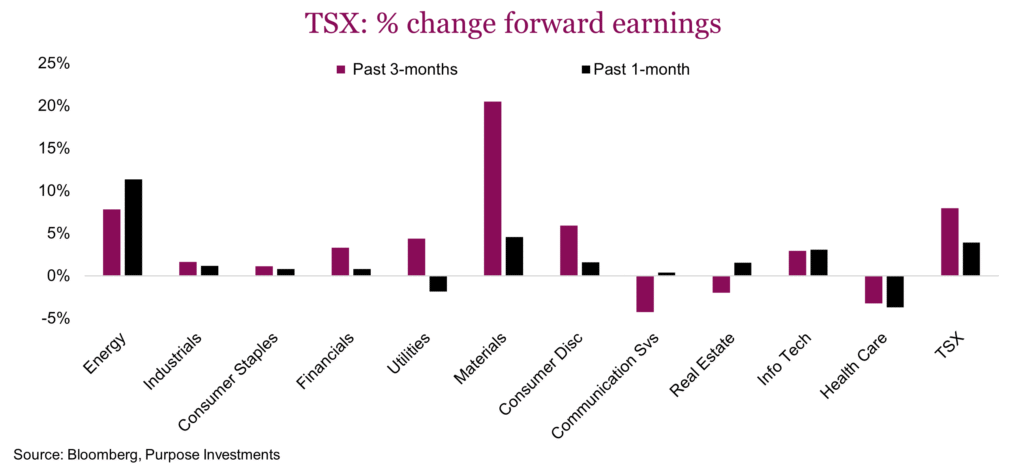
Not surprising energy is showing peak momentum, but we’re already seeing the big risk to this trade materialize with a high likelihood of a ceasefire rotation. The sector is very dependent on oil prices, and that cuts both ways. It has the hottest momentum in the market, but also the highest risk of reversal. We’ve been tactically trimming exposure throughout March.
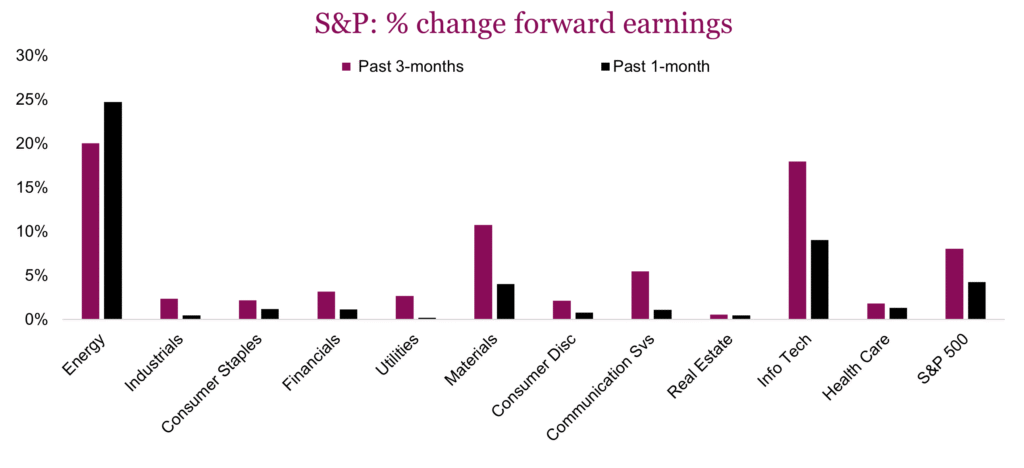
The other bright spot is technology. Earnings revisions remain strong in the U.S. and represents the strongest fundamental support for the S&P 500 right now. The AI capex cycle is intact, though showing signs of maturing with the bulk of revision gains coming earlier in the year. The big risk is concentration. Most of the earnings growth expectations are coming from just a couple of names, with Nvidia and Micron doing a lot of the heavy lifting. That’s not necessarily a problem, but it does mean the index as a whole remains very dependent on a handful of companies to drive earnings growth.
Materials continues to benefit from a commodity price tailwind, which is good news for Canada. The TSX is dominating here thanks to higher mining exposure, posting +20% revisions over the past three months. That’s the highest earnings momentum of any sector across both Canada and the U.S. Gold prices have retreated a bit, but the broader picture remains supportive. Industrials, meanwhile, are steady with recent momentum intact. Nothing flashy, but nothing to worry about either. Sometimes boring is good.
Elsewhere, the picture is more mixed. Consumer earnings trends are decelerating but not yet reversing, with early signs of stress likely tied to higher gas prices and shrinking disposable income. Worth watching, but not yet worth panicking over. Communication services is weakening and is one of the few sectors in Canada seeing deteriorating trends. Real estate remains the weakest sector, facing the twin headwinds of rate sensitivity and soft demand. Financials, on the other hand, are not as weak as feared — we’re still seeing positive earnings revisions in both Canada and the U.S.
Step back and the fundamental breadth picture is actually healthy. Only 2 of 11 sectors show negative revisions the past month in Canada and none in the U.S. Earnings expectations for the S&P 500 and the TSX are up 8% and 7% respectively over the past three months. That’s not a market rolling over, in fact through this lens it remains positive. Company guidance this earnings season will give analysts fresh insights into updating models, so we’d expect the market to be hypersensitive.
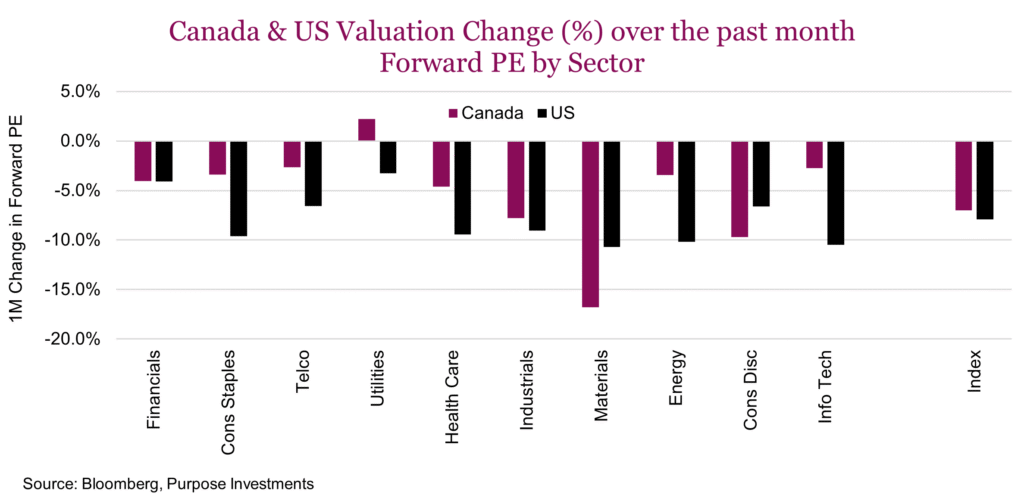
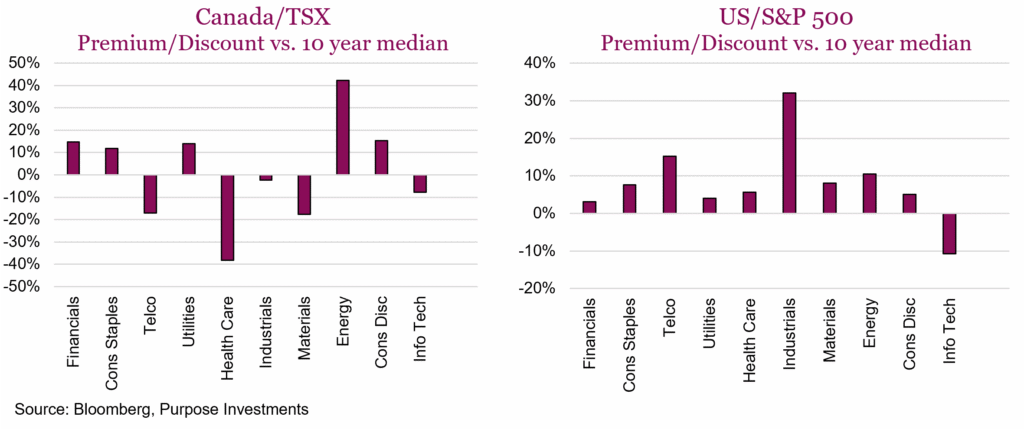
Valuations are an interesting paradox – Valuations have been cheapening up quite a bit over the past month as seen in the chart below. Every sector besides Canadian utilities have seen some degree of valuation compression. The puzzling aspect is the differential across sectors. Like technology which has seen substantial multiple compression despite the positive earnings growth.
Below is an ensemble of sector valuation charts detailing current levels, as well as deviations from long-term averages. The big standout is U.S. technology which is trading 10% below its 10-year median P/E. An enticing entry perhaps, especially as it tends to see historical outperformance when oil prices retreat. Admittedly it’s a compelling setup with strong fundamentals, compressed multiples, and a potential catalyst on the horizon.
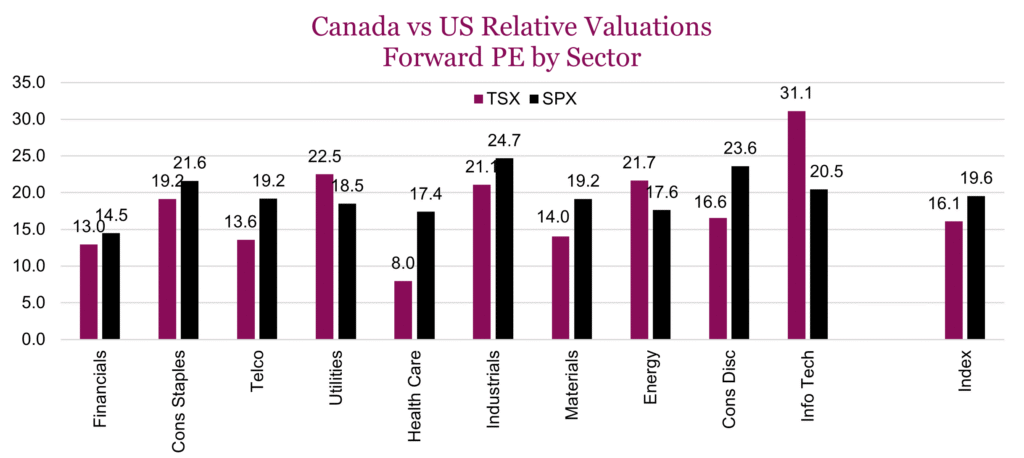
The picture for U.S. industrials is more concerning. The sector is trading at the highest premium to its long-term trend of any sector (+30%), but earnings momentum is quite modest (+2%). High expectations baked into current prices tend to increase execution risk and limit potential upside. Digging deeper, we still see decent valuations in transportation stocks, especially on an oil price retreat. But the sector broadly is largely priced for perfection. U.S. energy at a +17% premium is more reasonably priced than TSX energy at +46%, although this speaks more to how depressed Canadian energy valuations have been the last decade. Regardless, energy as a whole is expensive and certainly a risk on any oil price reversal.
Canadian materials offers one of the more compelling risk/reward setups we see in either market. Canadian miners are delivering solid earnings growth and multiples have fallen 17% over the past month. Canadian industrials are also attractive on a relative valuation standpoint, trading at a 3.3point discount to their U.S. counterparts with similar fundamentals.
Final thoughts – The big risk is that positive earnings revision trends are positive but narrowly focused on just a couple of sectors. Valuation premiums and discounts vary considerably across sectors, which means being nimble and tactically minded is essential to exploit market mispricing.
Valuations alone are not timing signals, but they do play a strong role in forward returns. Fundamentally, the bull case for 2026 remains intact. The margin for error has narrowed, yet the multiple retreat has also created compelling entry points. As always, the market orchestrates curious conundrums.
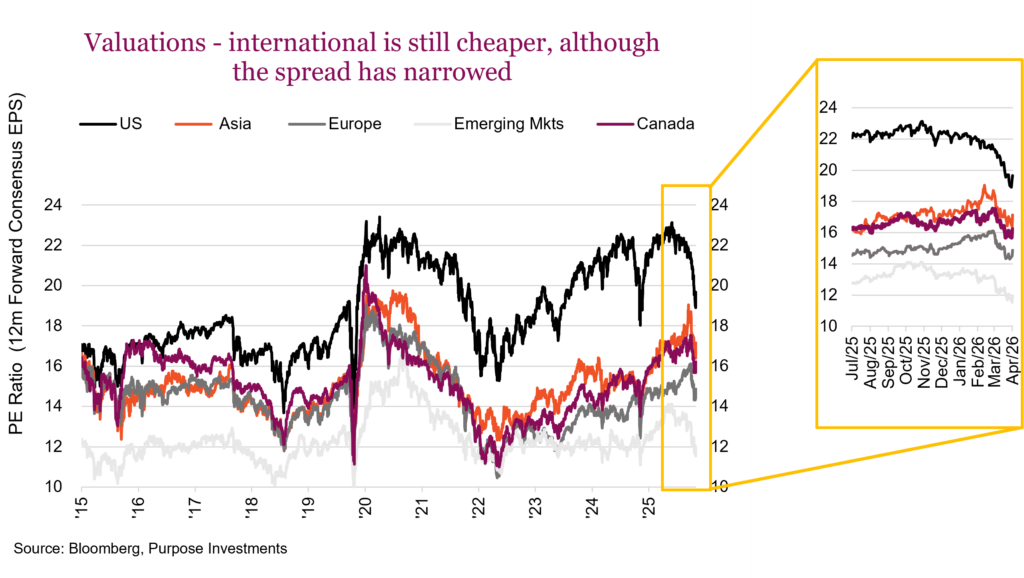
III. Geographic diversity
For the 2010s, a portfolio’s geographic mix was pretty simple: the more America the better. In 2025 it was the opposite: the more non-America the better. Europe, Japan, Canada and emerging markets all did much better than the S&P. We believe this change in leadership, or at least less American exceptionalism, is the norm going forward. International markets still enjoy a good valuation discount to the U.S. Plus earnings growth is more global-based on current estimates — add that to lower price-to-earnings and international is well positioned. There is also the fiscal spending and regulatory change that is improving internationally while the world’s appetite for tolerating U.S. policy flip flops appears to be fading somewhat. And of course, the world is still overweight America.
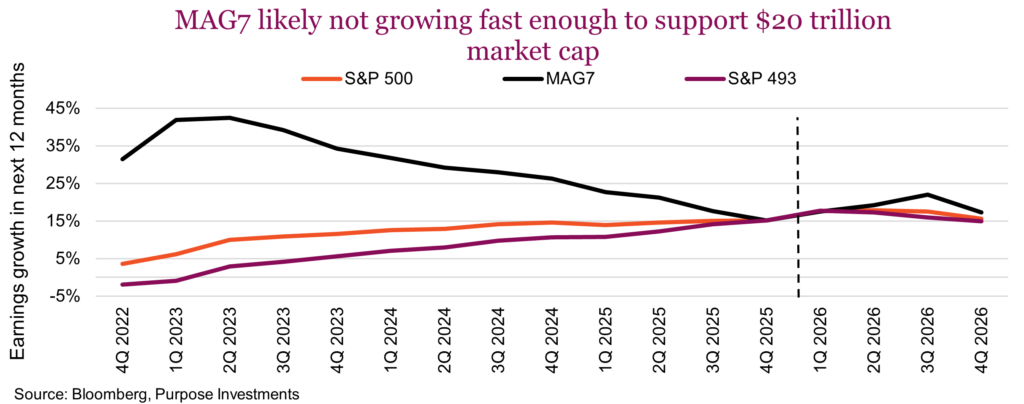
So far in 2026, international has once again outperformed America. But this isn’t about earnings growth, it is more about composition. This is where the real diversification benefits of international equities can shine. The TSX is doing well thanks to its relative overweight in energy and materials. The S&P is lagging mainly because of its relative higher weight in technology, more specifically software. Technology is up a lot within emerging markets, as technology is dominated by semiconductors and hardware, with much less software.
The crux is, as we see increasing divergence in sector performance, different markets are winning or losing largely based on their sectoral differences. With megacap tech earnings slowing to roughly match the broader market’s earnings growth, megacap dominance may be waning. Growth in Canadian equity and emerging markets is poised to be faster than the U.S., with Europe and Asia only slightly behind.
We continue to believe the return prospects of international equities has an edge on the U.S., certainly on a market cap weighted basis. And with different sector exposures such as more value and more resources, the diversification benefit is an added bonus.
IV. Layered diversified defense
We don’t know if this bout of market weakness is over or not, but everyone was reminded how unique corrections require diversified defensive solutions. As bond yields have been rising on concerns over higher oil stoking inflation and the cost of the conflict, bonds have fallen along with equities. Obviously not to the same magnitude, but we all agree both down is unpleasant. And then there is gold — it goes down on escalation days and up on de-escalation days. Oil exposure has been the best diversifier, certainly not the norm during periods of market weakness.
Every correction is different. The primary causes vary, the trajectory of different asset classes heading into the correction matters. And once in a correction, it may change its type if say, a geopolitical shock morphs to a growth scare or all the way to an actual recession. Only with hindsight do you know which type it was. In the table below we broke down every market correction all the way back to the mid-1970s. These were then bucketed by primary cause – Recession, Growth Scare (with no recession) or other shock from policy, geopolitics, inflation or other. For each type of correction, we then used various proxies to measure the average performance of popular diversifiers.
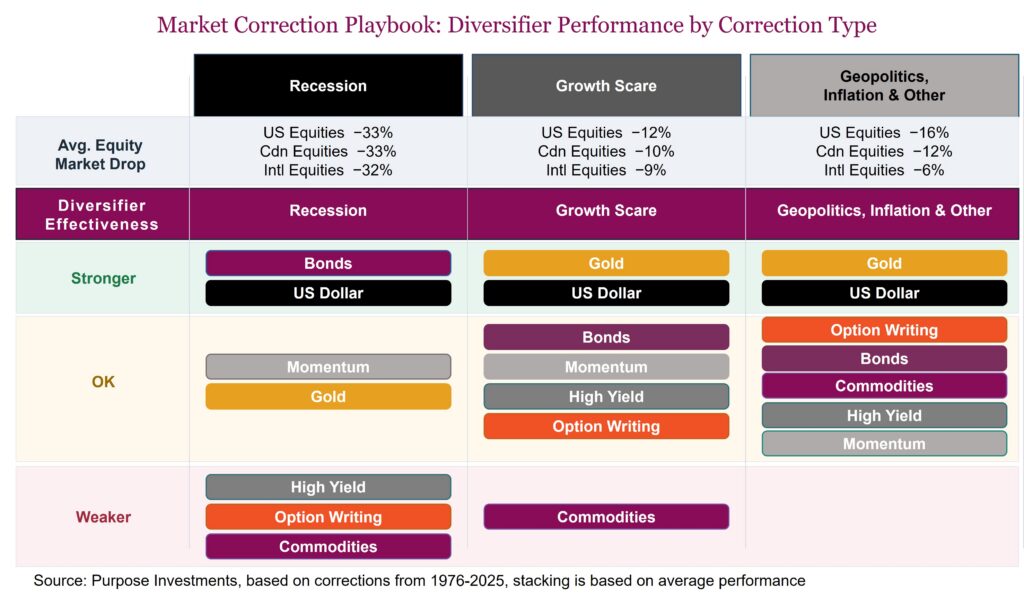
We will evolve this analytical work further, incorporating other strategies including real assets, equity factors, other volatility management strategies to highlight a few. The challenge is often finding a long enough history with a high enough pricing frequency to isolate performance during corrections, which can sometimes be short-term events.
The crux is for defense — a layered strategy using various available tools is required, especially given the uniqueness of market corrections of late. Obviously, a recession correction is the worse outcome for portfolios. But since not every correction turns into a recession, having other levers in a portfolio remains paramount. Hopefully, you find this framework useful in the portfolio construction process and how to think about defense.
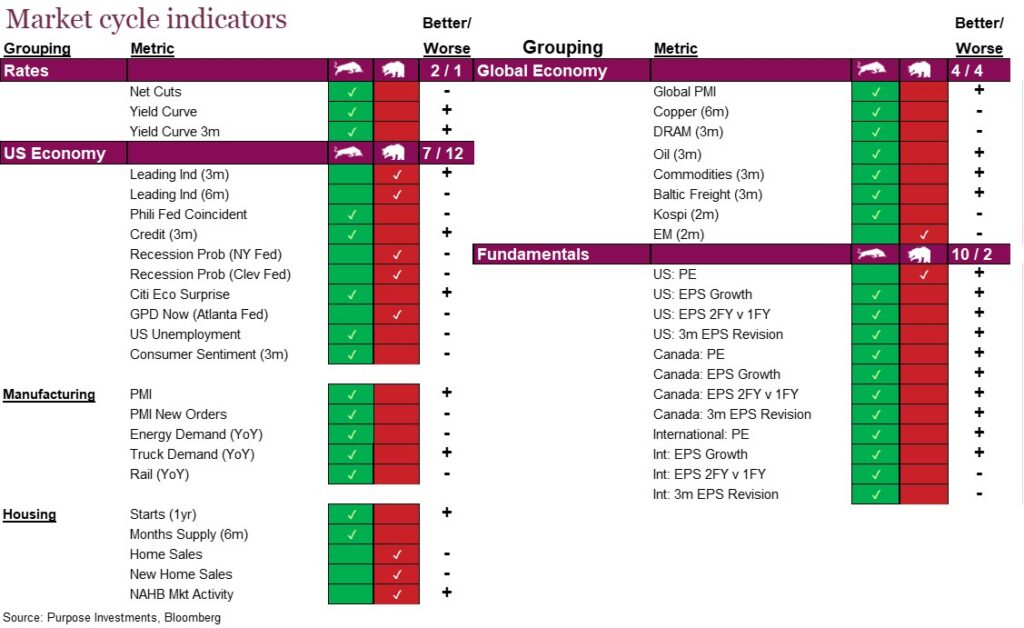
Market cycle and portfolio positioning
Market cycle indicators remain strong, evidence that the underlying economic and fundamental data is healthy. Manufacturing continues to show signs of increased activity and fundamentals are encouraging. This may change if the geopolitical conflict persists but for now it’s a decent foundation.
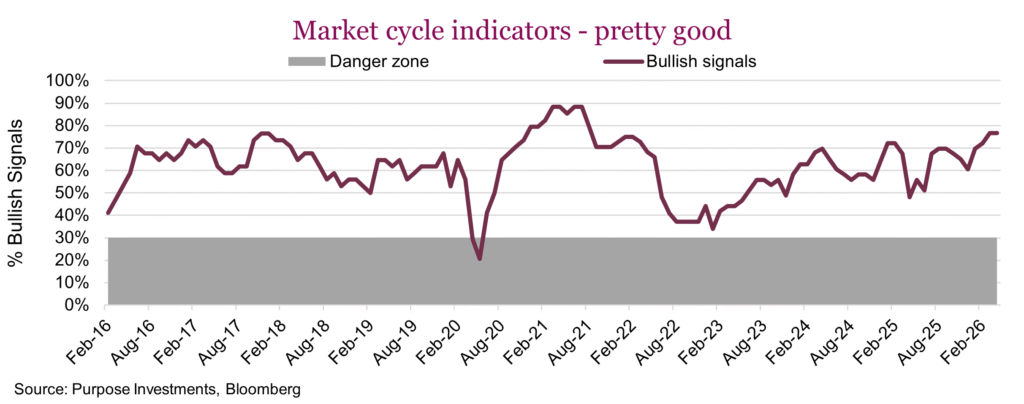
While we don’t know how long this conflict will persist, the underlying economy is good and recession risk remains low, albeit ticking a little higher the longer this conflict goes on.
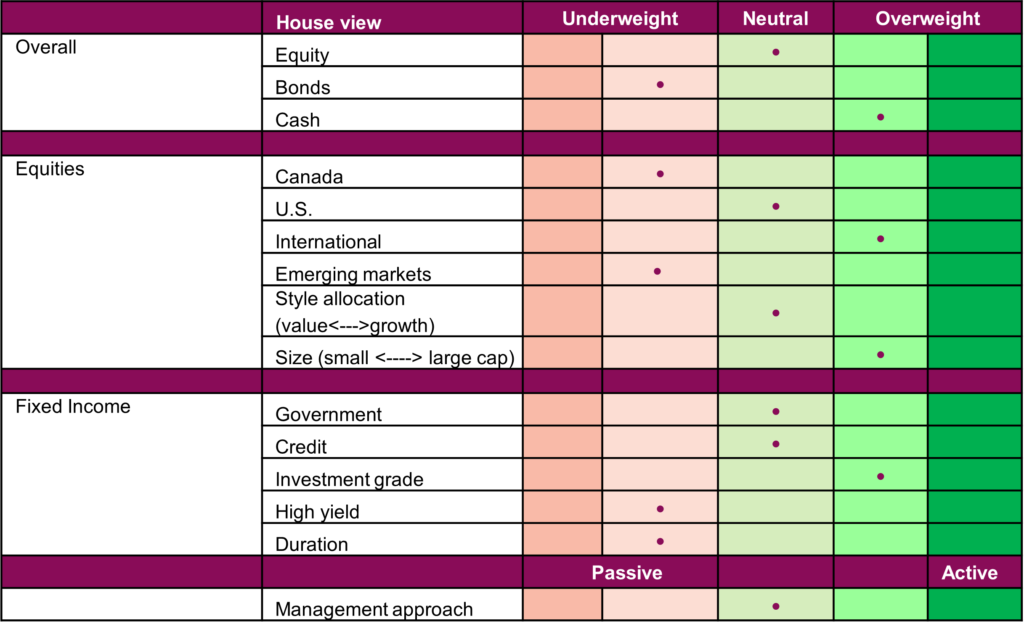
Portfolio positioning
Final note
While we would never suggest not reading the headline news, it might actually help. On any given day things can escalate or cool, with markets reacting. How much is true or conjecture, that is anyone’s guess. All sides are certainly saying things motivated by other factors, rather than speaking the objective truth. For investors, you have to navigate the noise. Reacting to it would likely cause more portfolio damage than enhancement. Stay calm and look for opportunities where the market might be overreacting.