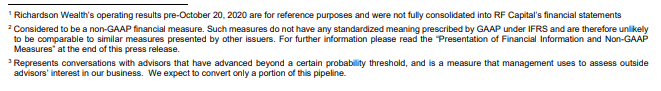
Toronto, November 5, 2021 – RF Capital Group Inc. (RF Capital or the Company) (TSX: RCG) today reported quarterly revenue of $79.7 million, record quarterly assets under administration (AUA) of $34.4 billion and adjusted consolidated EBITDA2 of $13.0 million for the third quarter ended September 30, 2021. Adjusted EBITDA2 in our Wealth Management Segment was $14.8 million in Q3 2021 (including $14.0 million at Richardson Wealth).
“In less than six months since we announced our strategy at our AGM, we have delivered on many of our promises and posted record results while doing so. This quarter was no different. We announced a transaction with Fidelity that will enhance our advisor and client experience by providing them access to a world class digital and custodial platform and it will also result in just under $10 million in operating synergies in the first year following adoption of their platform. We also secured a $200 million credit facility to accelerate our growth and invest in our platform, and we reported highest ever AUA of $34.4 billion and recruiting pipeline of $15 billion. All of this has started to show up in our operating results and the number of high quality advisory teams joining our firm,” said Kish Kapoor, President and CEO.
Commenting further, Mr. Kapoor said, “Our Q3 results demonstrate the effectiveness of both our strategy and our execution. We ended the third quarter with record fee-based revenue (which is now 90% of all commissionable revenue), our highest-ever quarterly AUA and adjusted EBITDA in our Wealth Management segment was $14.8 million. Doubling down on the support we provide advisors, and their clients is clearly resonating with people inside and outside our firm, with a record five new advisors joining our firm this quarter alone (our highest quarterly recruiting total in nearly a decade).”
Q3 2021 – Operating Highlights
- Record AUA per advisory team at $218 million, an increase of 21% from Q3 2020
- Added $2.5 billion in net new and recruited assets since Q3 2020
- Average household AUA grew to a record $1.1 million and the number of households with assets in excess of $1 million grew by 11% compared with the same period a year ago
- New issue deal flow was up 113% in Q3 2021 compared with the same period last year, partly due to strategic partnerships with Cormark and Bloom Burton & Co
- Recognized by a Great Place to Work™, as a Best Workplace in Financial Services and Insurance in 2021
- Attracted first-ever Head of Corporate Development to spearhead recruitment, acquisitions, and other strategic partnerships
- Improved operating leverage at Richardson Wealth, with adjusted operating expense ratio declining from 68.4% to 67.2%
- Hosted Game-Changers virtual conference that allowed top advisors to share their growth strategies and learn from industry experts
- Hosted exclusive client events featuring Hartley Richardson and Sandy Riley at the iconic Winnipeg Art Gallery – Qaumajuq. Over 1,000 participants attended the events at which our special guests shared fascinating stories about friendship, their partnership, their families, the inception and evolution of our Company, and the 164-year history of the Richardson brand.
Q3 2021 – Items of Note
Pre-Tax Adjustments
We have been reporting a high number of items of note over the course of the past two years, which reflects the significant transformation that we have undertaken. In Q3 2021, we were still in the midst of that journey, so we recorded material expenses related to our transformation program. We expect that these expenses will lead to significant EBITDA benefits in future periods. For example, we expect that outsourcing our carrying broker operations will result in an EBITDA benefit of just under $10 million1 in the first year after the transition. We also anticipate that the number of items of note will decline in Q4 and going forward. The adjusted financial results presented in this press release back out the impact of this transformation program to provide readers with a more representative view of our run-rate expenses and profitability.
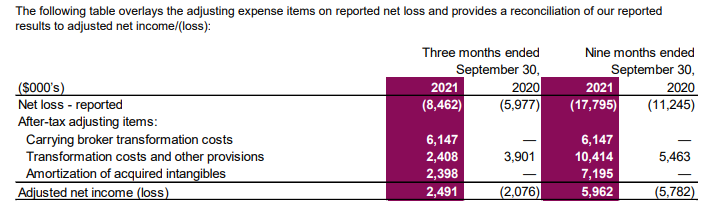
Q3 2021 included the following $12.8 million of pre-tax adjusting items:
- $6.3 million of pre-tax transformation charges ($6.1 million after-tax) connected with the outsourcing of our carrying broker operations. These charges, which relate to a workforce realignment and exiting certain technology provider relationships early, are recorded in our Wealth Management segment.
- $3.2 million of pre-tax of charges ($2.4 million after-tax) related to our ongoing transformation, which are also reported in our Wealth Management segment. The charges encompass a range of transformation initiatives, including refining our ongoing operating model, realigning parts of our real estate footprint, and rolling out our new strategy across the Company. We expect that these charges will begin to decline in Q4.
- $3.3 million of pre-tax amortization ($2.4 million after-tax) of intangible assets, reported in our Corporate segment. The amortization arises from intangible assets created on the acquisition of Richardson Wealth in Q4 2020 and will recur quarterly at a similar rate through to 2035.
Q3 2020 included $3.9 million of transformation costs, reported in our Corporate segment.
Another Item of Note – Consolidation of Richardson Wealth
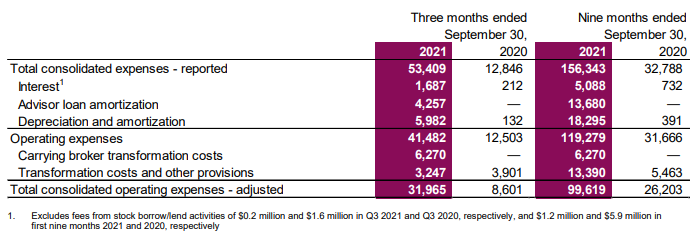
In late 2020, we began to include Richardson Wealth’s financial results on a consolidated basis, reflecting the fact that we acquired 100% ownership of Richardson Wealth on October 20, 2020. Q1 2021 represented the first full quarter that we consolidated the results. Prior to the acquisition, we accounted for Richardson Wealth’s results using the equity method. The results were included in our income statement under the line item “Share of net income of associate”. Further, prior to the transaction, RF Capital owned just 34% of Richardson Wealth, thus reported only that proportion of its earnings. After the transaction, we began to consolidate a full 100% of its financial results. As a result, the comparability of results across periods is limited.
To assist readers in understanding the performance of our underlying business over time, we have included supplemental financial information for Richardson Wealth in this press release.
Release of Escrowed Shares and Other Matters
On October 20, 2021, we celebrated the first anniversary of our transformative acquisition of Richardson Wealth (the First Anniversary). In accordance with the terms of the Richardson Wealth share purchase agreement and related escrow agreement, 30% of the RF Capital common shares subject to escrow will be released and delivered to the vendor shareholders not later than November 9, 2021. Of the released escrowed shares, 15.5 million will be delivered to Richardson Financial Group Limited and its wholly-owned affiliate, and 14.7 million will be released to Richardson Wealth investment advisors and employees and other shareholders. The remaining 60% will be released from escrow equally in connection with the second and third anniversaries in October 2022 and October 2023, respectively.
We also confirm that as of the First Anniversary, investment advisors representing 92.6% of the June 30, 2020 AUA continue to be with Richardson Wealth and, as a result, no downward purchase price adjustment will be required pursuant to the share purchase agreement. The AUA of these investment advisors is up $7.7 billion since June 30, 2020. Schedule 2.1(ii) to the share purchase agreement, a copy of which is filed under the Company’s profile on SEDAR at www.sedar.com.
Preferred Share Dividend
On November 4, 2021, the board of directors approved a quarterly cash dividend of $0.233313 per Cumulative 5-Year Rate Reset Preferred Share, Series B, payable on December 31, 2021, to preferred shareholders of record on December 15, 2021.
Q3 2021 Conference Call
A conference call and live audio webcast to discuss RF Capital’s third quarter 2021 results will be held this morning at 10:00 a.m. (EST). Interested parties are invited to access the quarterly conference call on a listen-only basis by dialing 416-406-0743 or 1-800-898-3989 (toll free) and entering participant passcode 3350095#, or via live audio webcast at https://rfcapgroup.com/Investor-Relations/Quarterly-Information. A recording of the conference call will be available until Monday, December 6, 2021, by dialing 905-694-9451 or 1-800-408-3053 (toll free) and entering access code 8752860#. The audio webcast will be archived at https://rfcapgroup.com/Investor-Relations/Quarterly-Information.
Presentation of Financial Information and Non-GAAP Measures
Unless otherwise specified herein, financial results contained in this press release including related historical comparatives, are based on our Third Quarter 2021 Financial Statements, which Management has prepared in accordance with International Financial Reporting Standards (IFRS). The Canadian dollar is our functional and reporting currency for the purposes of preparing our consolidated financial statements.
Non-GAAP Measures
We use a variety of measures to assess our performance. In addition to GAAP prescribed measures, we use certain non-GAAP measures that we believe provide useful information to investors regarding our performance and results of operations. Readers are cautioned that non-GAAP measures often do not have any standardized meaning and therefore may not be comparable to similar measures presented by other issuers. Non-GAAP measures are reported in addition to and should not be considered alternatives to net income or comparable metrics determined according to IFRS as indicators of our performance, liquidity, cash flows, and profitability.
The primary non-GAAP financial measures used in this press release are:
Assets Under Administration
Assets under administration (AUA) is a non-GAAP financial measure of client assets common to the wealth management business. AUA represents the market value of client assets managed and administered by us from which we earn commissions and fees. This measure includes funds held in client accounts as well as the aggregate market value of long and short security positions. Our method of calculating AUA may differ from the methods used by other companies and therefore may not be comparable to other companies.
EBITDA
The use of EBITDA is common in the wealth management industry. We believe it provides a more accurate measure of our core operating results, is a proxy for operating cash flow, and is a facilitator for enterprise valuation. EBITDA is used to evaluate core operating performance by adjusting net income to exclude:
- Interest expense, which we record primarily in connection with term debt
- Income tax expense/(benefit)
- Depreciation and amortization expense, which we record primarily in connection with intangible assets, leases, equipment, and leasehold improvements; and
- Amortization in connection with investment advisor transition and loan programs. We view these loans as an effective recruiting and retention tool for advisors, the cost of which is assessed by management upfront when the loan is provided rather than over its term.
Operating Expenses and Operating Expense Ratio
Operating expenses include:
- Employee compensation and benefits; and
- Selling, general, and administrative expenses
These are the expense categories that factor into the EBITDA calculation discussed above.
The Operating Expense Ratio is determined by dividing adjusted operating expenses by gross margin. We use this ratio to measure the efficiency of our operations.
Adjusted Results
In periods that we determine that specified items have a significant impact on a user’s assessment of ongoing business performance, we may present adjusted results in addition to reported results by removing these items from the reported results. Management considers the adjusting items to be outside of our core operating performance. We believe that adjusted results can to some extent enhance comparability between reporting periods or provide the reader with a better understanding of how management views core performance. Adjusted results are also intended to provide the user with results that have greater consistency and comparability to those of other issuers.
Adjusting items in this press release include the following, by reporting segment:
Wealth Management:
- Transformation costs and other provisions: charges in connection with the ongoing transformation of our business and other matters. These charges encompass a range of transformation initiatives, including refining our ongoing operating model, realigning parts of our real estate footprint, and rolling out our new strategy across the Company. We expect that these charges will begin to decline in Q4.
- Carrying broker transformation costs: charges in connection with the outsourcing of our carrying broker operations. These charges relate to a workforce realignment and exiting certain technology provider relationships early.
- Share-based compensation costs: adjustments for compensation recorded in connection with certain non-cash awards granted to employees and investment advisors. This amount is included in the Employee compensation and benefits expense line on our income statement. These adjustments apply only to the 2020 comparative results and not to 2021 results.
Corporate:
- Transformation costs: incremental professional and advisory fees in connection with the acquisition of Richardson Wealth and the development of our go-forward strategy
- Amortization of acquired intangible assets: amortization of intangible assets created on the acquisition of Richardson Wealth
All of the adjusting items affect reported expenses. The following table itemizes these adjustments and reconciles our reported operating expenses to adjusted operating expenses:
Forward-Looking Information
This press release contains forward-looking information as defined under applicable Canadian securities laws. This information includes, but is not limited to, statements concerning objectives and strategies to achieve those objectives, as well as statements made with respect to Management’s beliefs, plans, estimates, projections and intentions and similar statements concerning anticipated future events, results, circumstances, performance, or expectations that are not historical facts. Forward-looking information generally can be identified by the use of forward-looking terminology such as “outlook”, “objective”, “may”, “will”, “expect”, “intend”, “estimate”, “anticipate”, “believe”, “should”, “plans” or “continue”, or similar expressions suggesting future outcomes or events. Such forward-looking information reflects Management’s current beliefs and is based on information currently available to Management. The forward-looking information contained herein is expressly qualified in its entirety by this cautionary statement.
The forward-looking statements included in this press release, including statements regarding the nature of our growth strategy going forward and execution of any of our potential plans, are not guarantees of future results and involve numerous risks and uncertainties that may cause actual results to differ materially from the potential results discussed or anticipated in the forward-looking statements, including those described in this press release and our AIF. Such risks and uncertainties include, but are not limited to, market, credit, liquidity, operational and legal and regulatory risks, and other risk factors, including variations in the market value of securities, dependence on key personnel and sustainability of fees. In addition, other factors, such as general economic conditions, including interest rate and exchange rate fluctuations, and pandemics, natural disasters, or other unanticipated events (including the novel coronavirus and variants thereof (“COVID-19”) pandemic) may also influence our results of operations. For a description of additional risks that could cause actual results to differ materially from current expectations, see the “Risk Management” and “Risk Factors” sections in our 2020 MD&A and the “Risk Factors” section of our AIF.
Although we attempted to identify important risk factors that could cause actual results to differ materially from those contained in forward-looking information, there may be other risk factors not presently known to us or that we presently believe are not material that could also cause actual results or future events to differ materially from those expressed in such forward-looking information.
Certain statements included in this press release may be considered a “financial outlook” for purposes of applicable Canadian securities laws. The financial outlook may not be appropriate for purposes other than this press release.
Forward-looking information contained in this press release is:
- based on Management’s reliance on certain assumptions it considers reasonable; however, there can be no assurance that such expectations will prove correct. As such, readers should not place undue reliance on the forward-looking statements and information contained in this press release. When relying on forward-looking statements to make decisions, readers should carefully consider the foregoing factors, the list of which is not exhaustive;
- made as of the date of this press release and should not be relied upon as representing our view as of any date subsequent to the date of this press release. Except as required by applicable law, our Management and Board undertake no obligation to update or revise any forward-looking information publicly, whether as a result of new information, future events or otherwise; and
- expressly qualified in its entirety by the foregoing cautionary statements.
About RF Capital Group Inc.
RF Capital Group Inc. (RF Capital) is a TSX-listed (TSX: RCG) wealth management-focused company. Operating under the Richardson Wealth brand, the Company is one of Canada’s largest independent wealth management firms with $34.4 billion in assets under administration (as of September 30, 2021) and 20 offices across the country. The firm’s Advisor teams are focused exclusively on providing strategic wealth advice and innovative investment solutions customized for high net worth or ultra-high net worth families and entrepreneurs. The Company is committed to maintaining exceptional fiduciary standards and has earned certification – determined annually – from the Center for Fiduciary Excellence for its Separately Managed and Portfolio Management Account platforms. Richardson Wealth has also been recognized as a Great Place to Work™ for the past three years, a Best Workplace for Women, a Best Workplace in Canada, a Best Workplace for Mental Wellness and a Best Workplace in Financial Services and Insurance. For further information, please visit our corporate website at www.rfcapgroup.com and www.RichardsonWealth.com.
Media and Investor Contact:
RF Capital Group Inc.
Rocco Colella, Managing Director, Investor Relations
Tel: (416) 941-0894; [email protected]