
Investor Strategy
3 March 2026
Mostly smooth sailing
Sign up here to receive the Investor Strategy by email.
- Love for some, but not all, in February
- HALO immunity idol
- Improving economy
- Japan rising
- Market cycle & portfolio positioning
- Final note
Love for some, but not all, in February
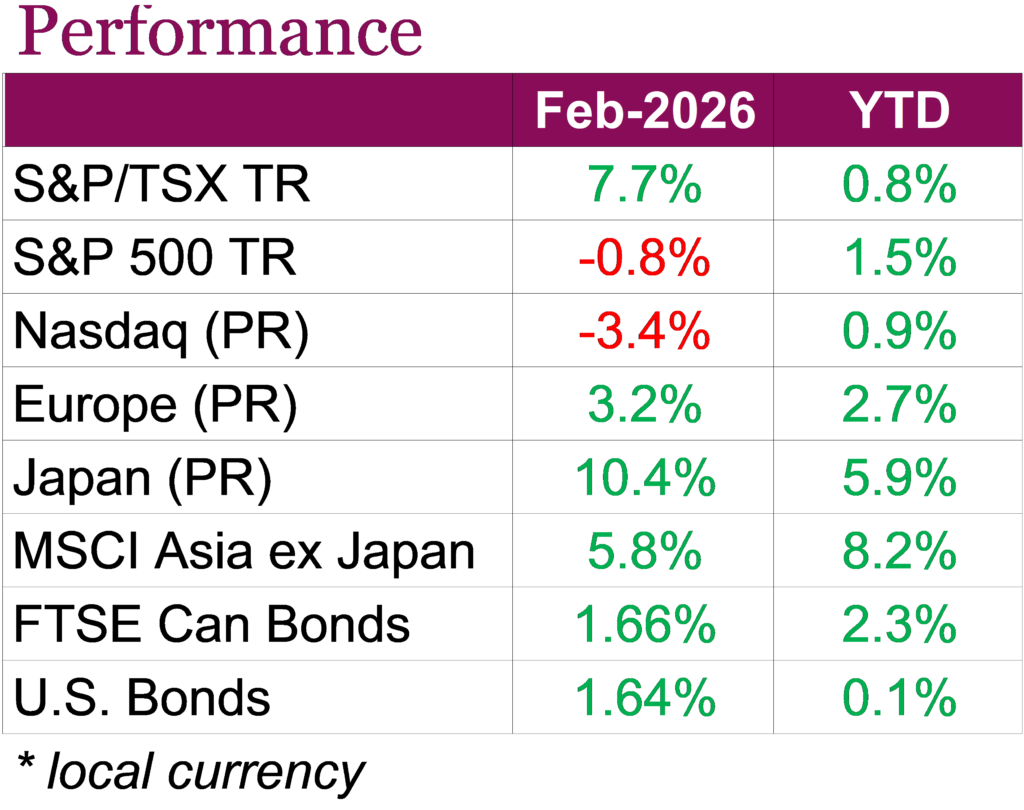
February delivered a mixed performance across major markets, highlighting changing fundamentals and evolving policy dynamics across the globe. In the U.S., the S&P 500 declined -0.8% on a total return basis, while the Nasdaq fell -3.4%, weighed down by continued pressure in large-cap tech and software names. On the other hand, Canadian equities were a bright spot, with the S&P/TSX advancing 7.2%, supported by strength in financials, energy, and materials. Yields declined throughout the month, as volatility in equities and shifting rate expectations supported bond prices. Canadian bonds, measured by the FTSE Canada Universe bond index, returned 1.66% and U.S. Aggregate Bonds gained 1.64%. Gold rebounded after weakness in late January and early February and now sits near all-time highs, as geopolitical uncertainty led many investors to look for safety. Market leadership continued to broaden, with investors rotating away from high-valuation tech and megacap stocks toward more cyclical and defensive sectors. We saw international developed markets outperform U.S. equities year to date, with improving profitability trends in Japan and selective strength in Europe contributing to renewed investor interest.
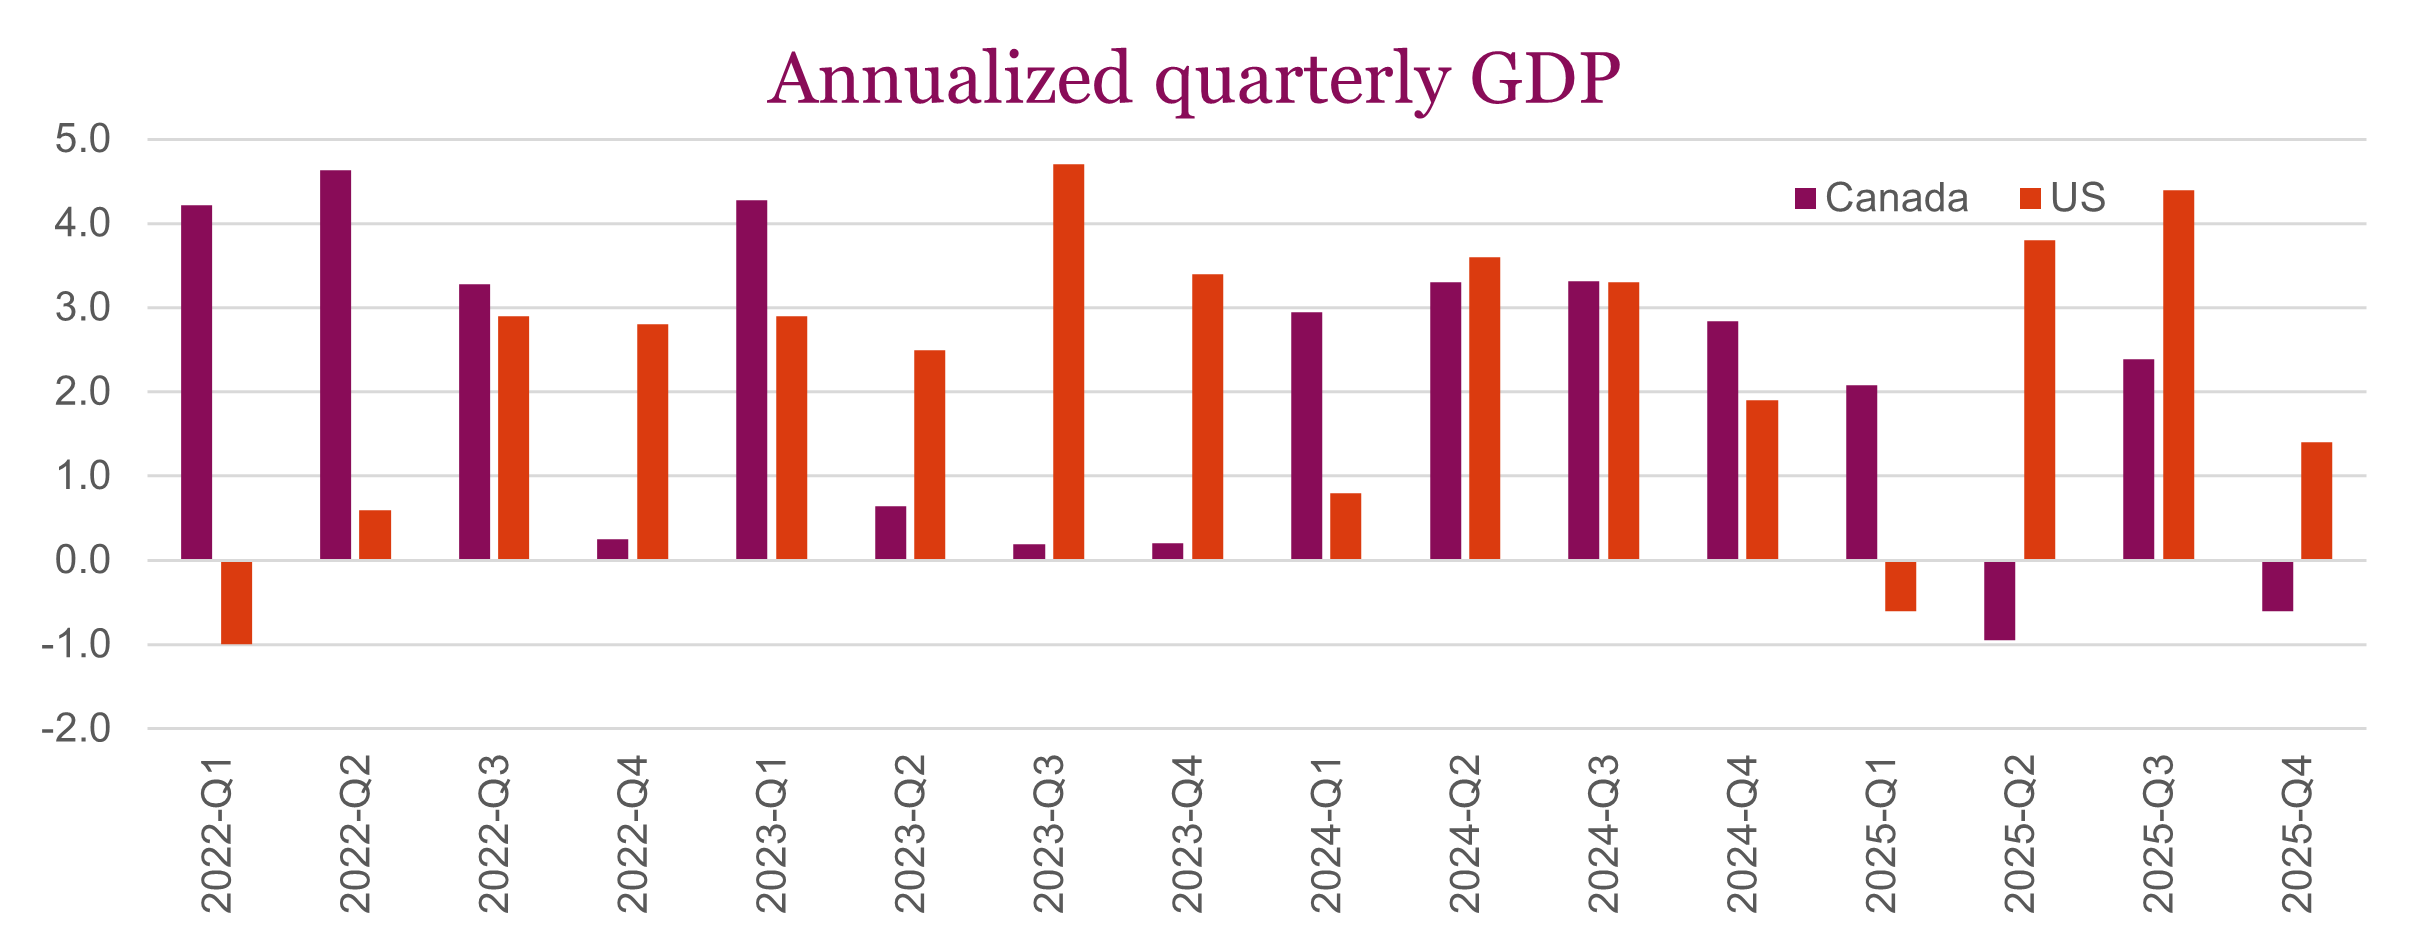
In the U.S., economic and policy developments remained front and centre. A hotter-than-expected January PPI reinforced concerns that inflation pressures remain sticky. Headline producer prices rose 0.5% month over month, while core prices increased 0.8%, both well above expectations, suggesting ongoing inflation could complicate the Fed’s rate path. Meanwhile, Q4 GDP growth slowed to an annualized 1.4%, down from 4.4% in the prior quarter, as weaker consumer spending, trade headwinds, and the impact of a prolonged government shutdown weighed on activity.
Trade uncertainty also increased over the month, following a U.S. Supreme Court ruling limiting the Trump administration’s use of the International Economic Emergency Powers Act to impose tariffs. In response, the White House introduced a universal 10% tariff on most imports, with an additional 5% applied selectively, as a temporary bridge while pursuing longer-term trade measures under alternative legal authorities. Although the blended tariff rate is expected to remain near prior levels, the policy uncertainty adds another layer of complexity for businesses and investors. Investors did however take comfort in corporate earnings, with S&P 500 profits rising 13% year over year. Still, fewer companies exceeded expectations and forward guidance disappointed, contributing to muted equity performance. At the same time, improving earnings momentum in Europe and Asia has prompted investors to reassess U.S. overweight positions. Concerns about the disruptive impact of AI have further weighed on software and cybersecurity stocks, widened credit spreads, and contributed to a rotation into other sectors, even as strategists remain constructive on broader profit growth over the year.
While stocks in Canada outperformed their U.S. peers, investors had to contend with a slowing economy and economic uncertainty. The economy contracted at an annualized -0.6% rate in Q4, mainly due to a drawdown in business inventories, though domestic demand rose 2.4% and household consumption remained steady. For 2025 as a whole, GDP expanded only 1.7% as the economy felt the impacts from U.S. tariffs and softer investment. Inflation continued to ease modestly, with headline CPI at 2.3% in January and core measures also drifting lower, while shelter inflation fell below 2% year over year for the first time in nearly five years. Canada’s corporate earnings picture was strong, with all of the Big Six banks exceeding first-quarter expectations. This performance was helped by broad-based revenue growth across retail banking, capital markets, and wealth management, with several institutions reporting returns on equity above 17% and announcing capital returns. Taken together, February underscored the importance of diversification across regions and sectors, as leadership continues to rotate and policy and geopolitical uncertainty remains elevated. Let’s see what has worked and not so far this year.
HALO immunity idol
The price-to-earnings ratio of Microsoft is now equal to that of Exxon. Exxon’s P/E ratio has risen over the past six months from 14.6x to 21.4x, while Microsoft came from the other direction, falling from 32.3x. Or how about Amazon trading at 22x, roughly the broader market valuation while Coca-Cola has climbed to 25x.
Growth and technology stocks have been rolling over, while economically cyclical and defensive sectors are holding up the market. Year to date, the top-performing sectors in both Canada and the U.S. are energy and materials. Consumer staples have also done extraordinarily well, up 14.5% so far this year in the U.S. This is a different market than investors have gotten used to. Cyclicals and defensives are not supposed to be leading at the same time. From a factor standpoint, momentum remains strong, but close behind it is the dividend and value factors emerging as new market leaders. We even have a new acronym that has entered the investing lexicon: the HALO trade (Heavy/Hard Asset, Low Obsolescence). Suddenly, being reliable and a little boring is being rewarded. This is unusual, and it signals a meaningful shift underneath the headline volatility.
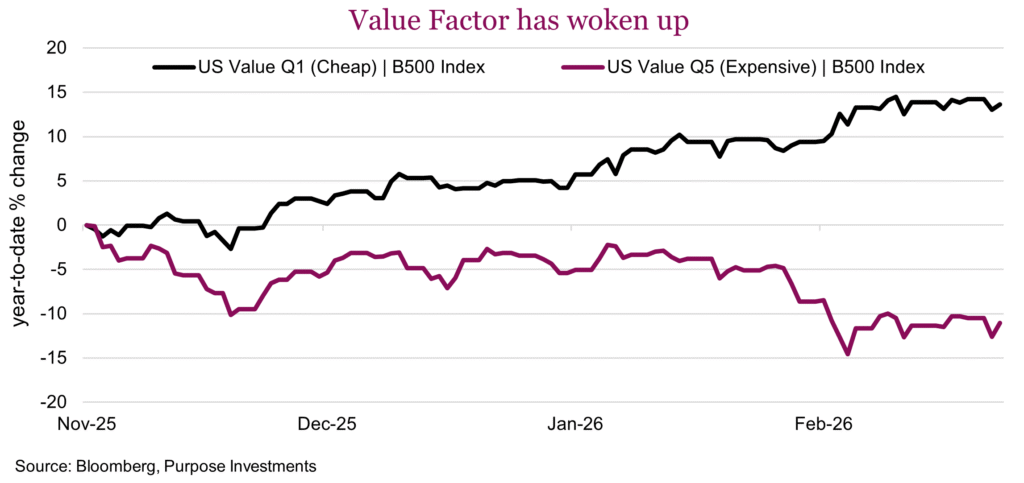
Factors (dividend and value) – Rotation has been the name of the game in the stock market this year. Grabbing many headlines in the technology space is the rotation out of software and into hardware, specifically anything to do with memory. But besides this rather narrow subset, there has been a much larger rotation in market leadership. It flipped in January and has accelerated dramatically in recent weeks from growth to value and dividend stocks.
Since November, the cheapest stocks in the S&P 500 have outperformed the most expensive stocks in the index by a wide margin, as seen in the chart below. Divided into quintiles, the cheapest stocks have outperformed the most expensive by over 20%. Old school dividend stocks are back! Energy, utilities, pipelines and staples have seen major inflows, pushing up prices and valuations. Behind the resurgence in dividend stocks is the dominance of value.
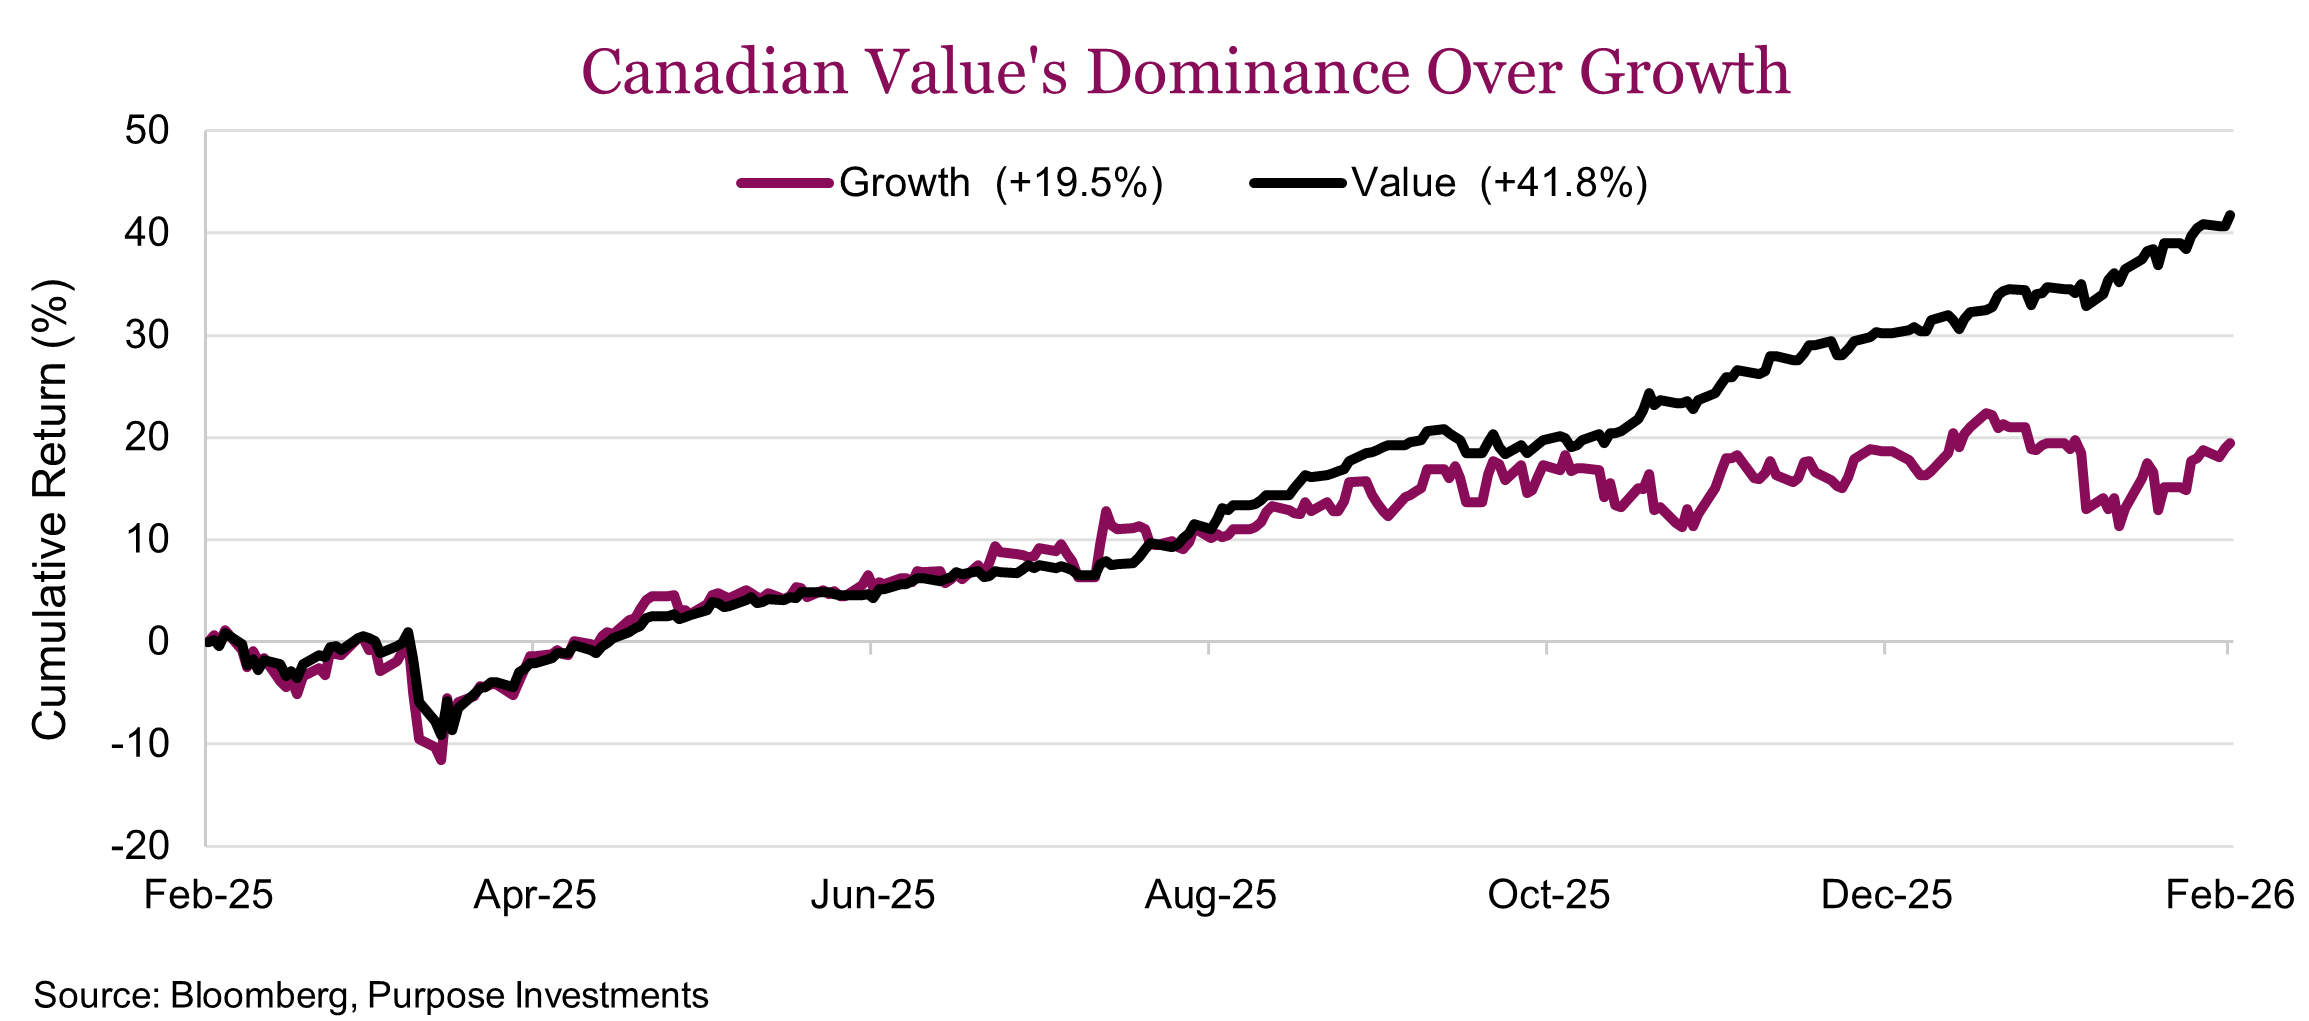
Rotation north of the 49th – The rotation into value is not just a U.S. story. The chart below shows that the Canadian value index (dark line) significantly outperformed, rising 41.8% over the trailing year versus just 19.5% for growth. While still a solid return, growth’s gain is less than half of value’s. Like the U.S., the divergence began at the end of October and has since widened considerably. Unlike the U.S., it’s not as much an AI/software story. Rather, value’s heavy allocation to financials (54.9%) has been the largest tailwind. Energy is the second-largest weight in value at 24.2% and has contributed solid returns year to date. While gold miners have done their fair share for the growth index, a tilt toward tech and industrials has had a negative impact. What particularly stood out was that the Canadian growth index had a 13% exposure to Shopify, which has amplified the drag from tech underperformance. Growth’s higher daily volatility has only compounded the pain.
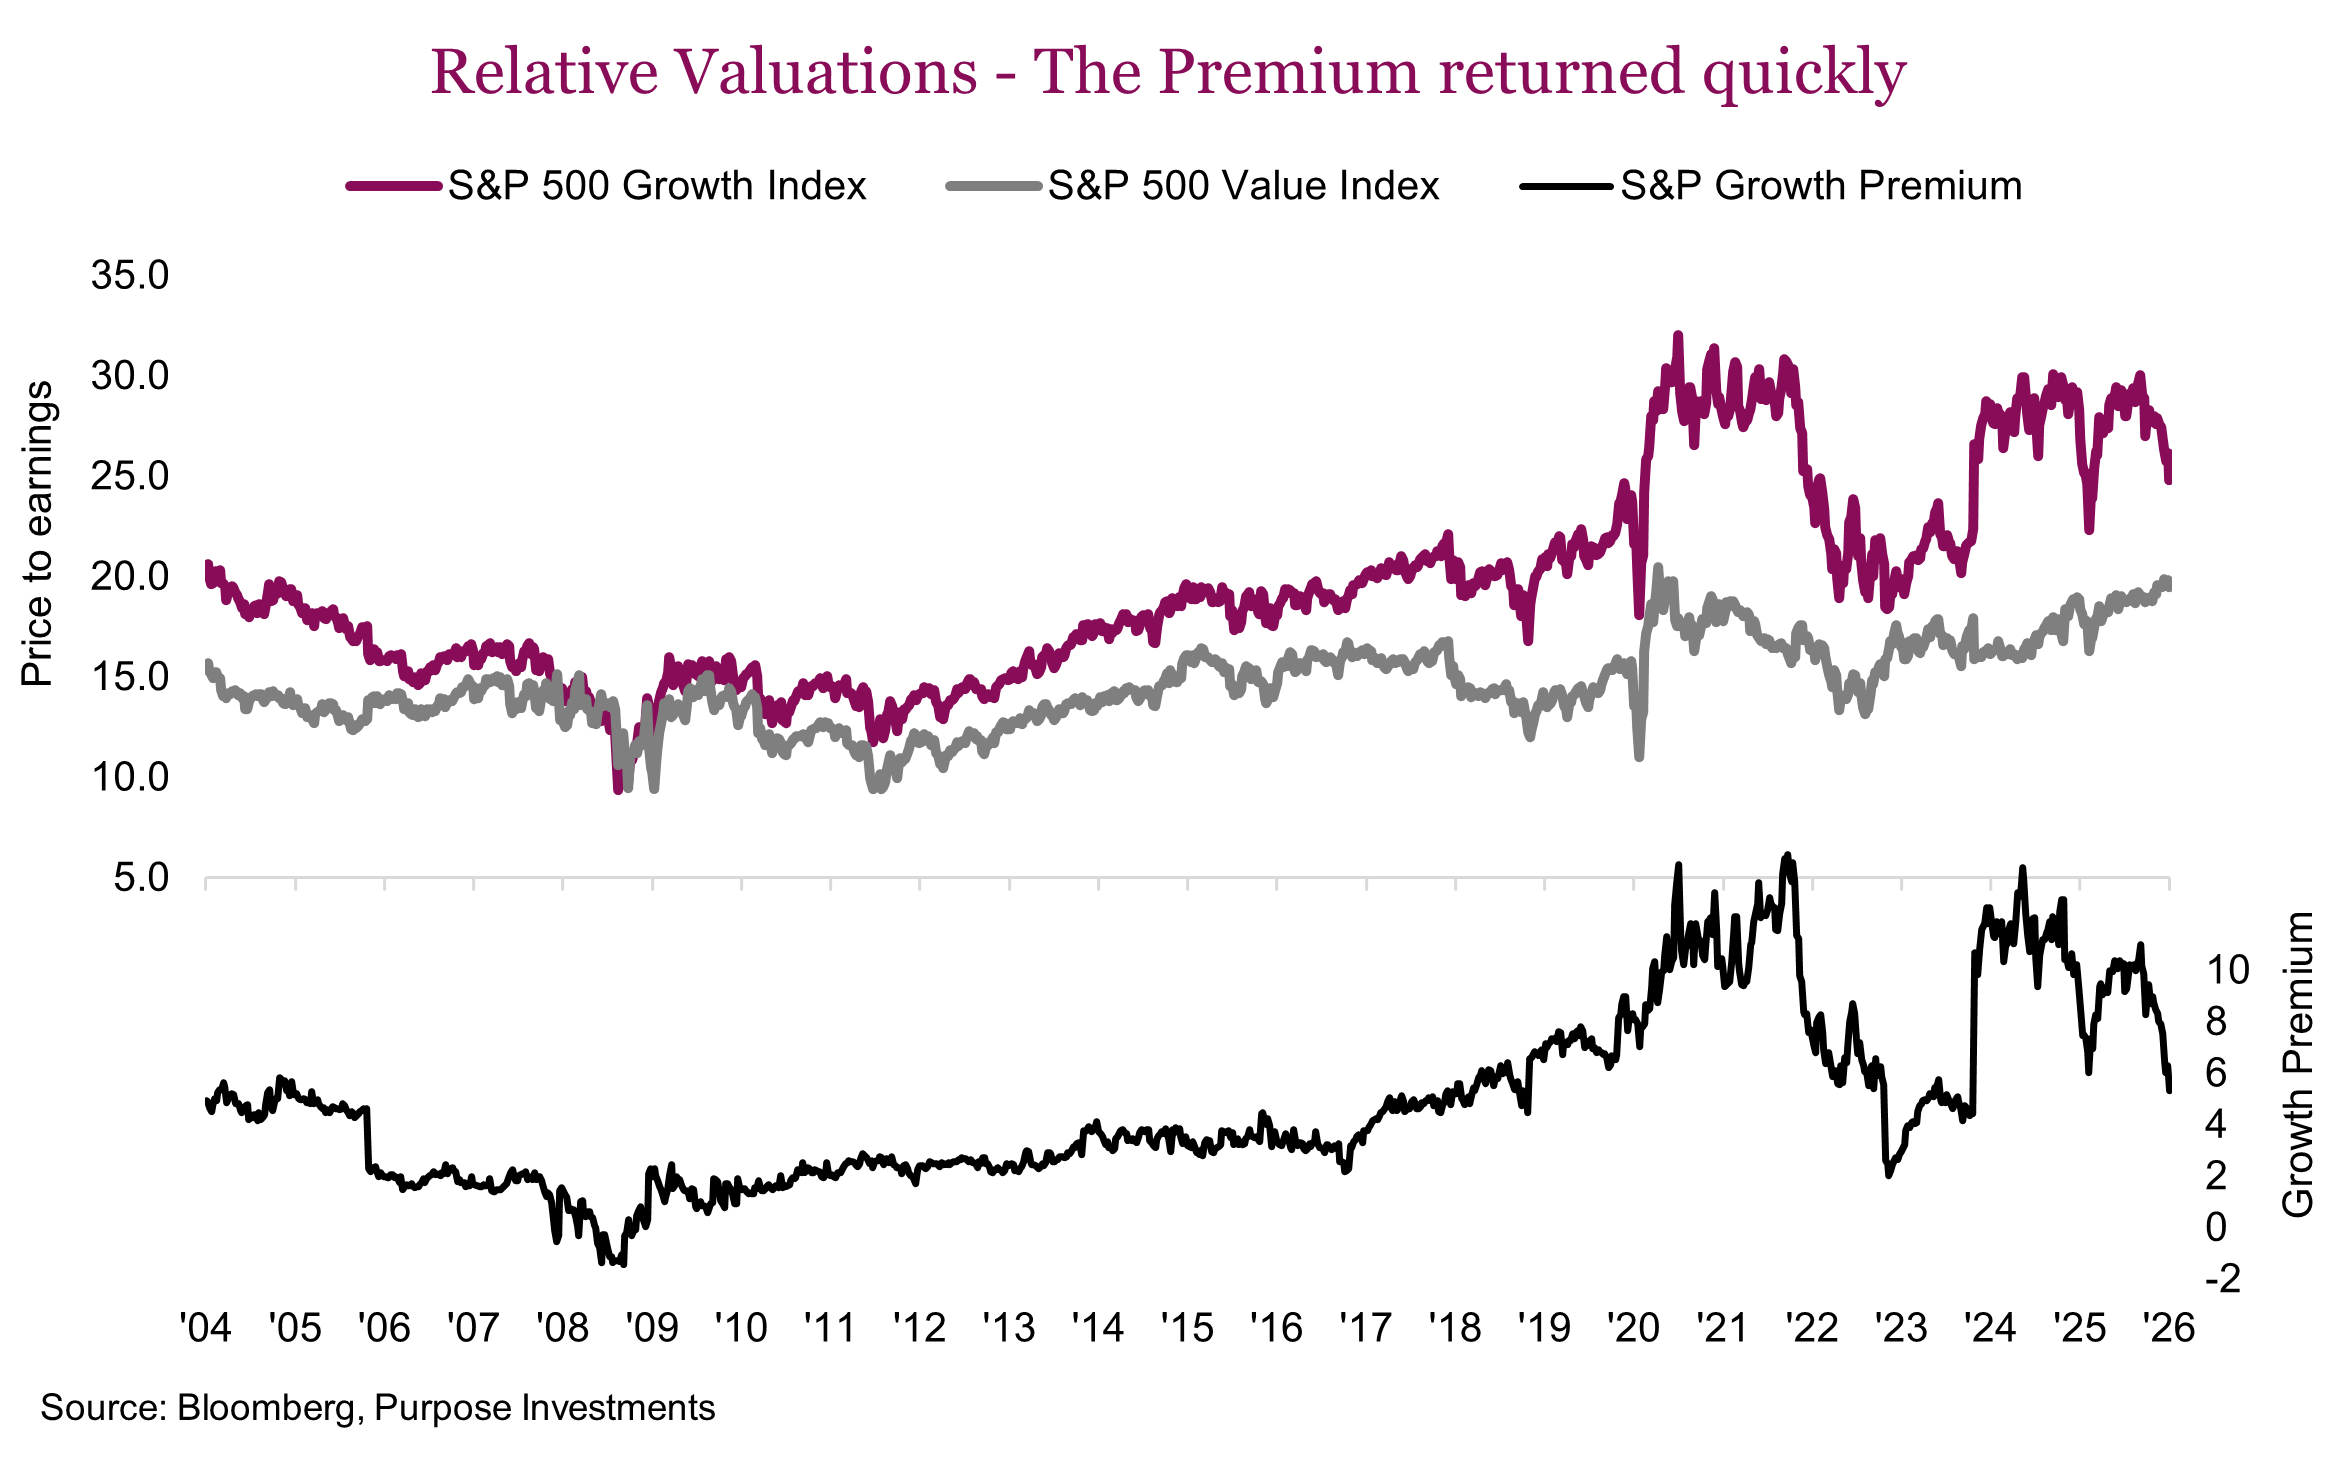
Valuations – While value has been winning, we’re cognizant that previous bouts of outperformance have reversed course quickly. Below we’ve charted the historical valuation premium of growth over value. While the S&P 500 Growth Index currently trades at a meaningful premium to the S&P 500 Value Index, hovering around a 5–6x point premium. This spread remains elevated by historical standards. However, it is noteworthy that the spread has halved since the end of October. Value has delivered strong relative performance, and we believe there is further runway as fundamentals continue to support the trade. That said, we remain vigilant. The experience of late 2022 serves as a reminder that the growth-to-value rotation can reverse sharply as the premium snapped back quickly when mega-cap growth reasserted leadership. Our approach is to continue riding the current wave of value outperformance while closely monitoring the spread for signs of inflection.
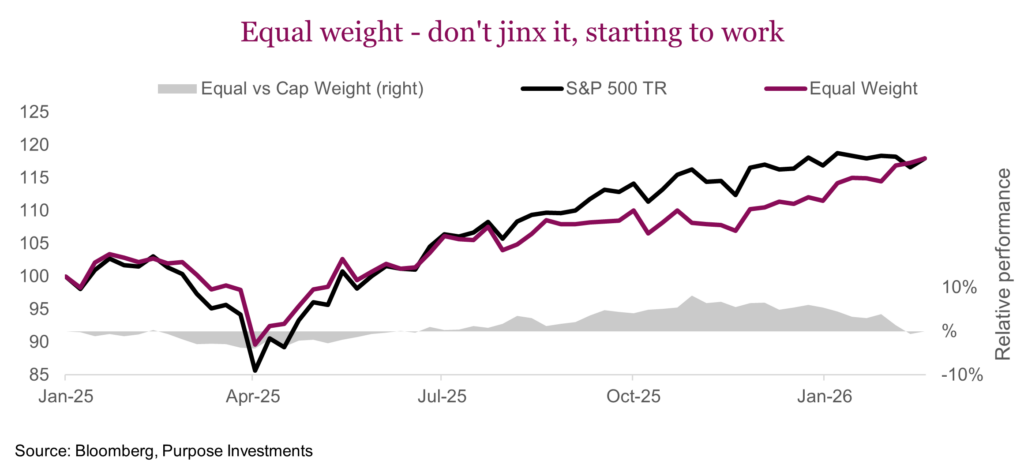
Equal weight remains vehicle of choice – Besides outright factor-tilt ETFs, one of the ways to play the value/growth dynamic, at least in the U.S., is adding equal-weight exposure rather than plain vanilla cap-weighted S&P 500 exposure. The equal-weighted index has a much stronger value tilt compared to cap-weighted, thanks largely to lower tech exposure and significantly more financials. We’ve been proponents of equal-weight exposure for some time, to our detriment when tech was really running. After its recent outperformance, now 5.6% year to date, equal weight is tied with cap weight since the beginning of 2025. The valuation spread has narrowed by a third, to just 3.4 points from a high of 5.3 at the end of October. It’s still historically wide, but close to the lowest levels seen over the past three years.
What we’ve been seeing is a consistent diversification away from legacy tech. Given that tech is nearly a third of the cap-weighted index, when it’s running hot, cap weight will always win out. Over the longer term, historically it’s been more of a coin flip — the equal-weight index has outperformed in 18 of the past 36 years. In 2000, equal weight beat the S&P 500 by 18%. How long this lasts will depend on how the AI trade plays out.
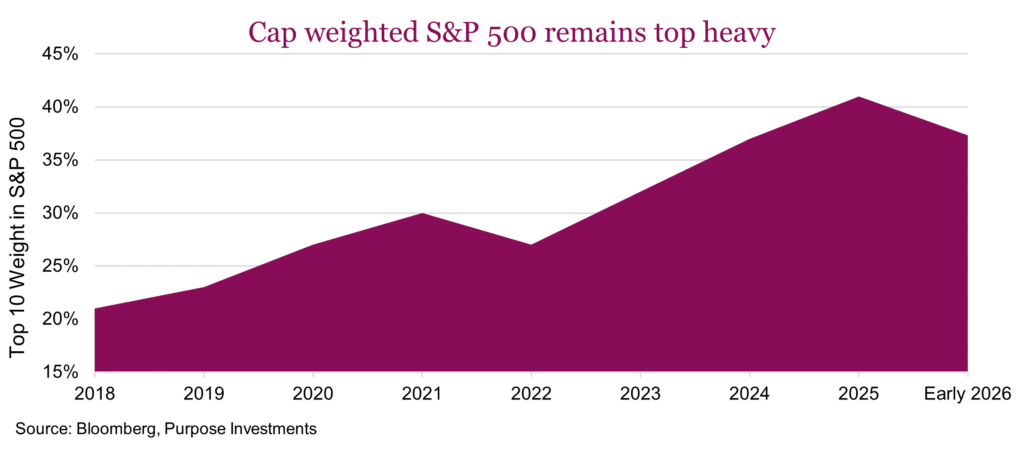
Besides valuations, the other main reason we continue to favour equal-weight exposure is reduced concentration risk. The S&P 500 remains very top-heavy. While off of the highs of 41%, the current top-10 weight in the S&P 500 is still elevated at 37%. Should the mega-caps stumble, the cap weighted index will shake, a lot.
Seeking the “Immunity Idol” – Our guess is that there is more to go in this rotation. Earnings do appear stretched for many cyclical stocks, but we’re in an environment that should be constructive for deeper cyclicals, and we’d expect earnings growth to sort out what appear to be elevated valuations. The HALO trade has been working. We’re still on board and think there is more room to run as investors continue to rotate capital out of high-growth tech and AI stocks. Investing in these ‘old economy’ stocks is the new momentum trade. It will continue to work until it doesn’t, but in the meantime there’s something refreshing about owning solid businesses that don’t require bold technological predictions well outside of most investors’ core competency. Sometimes boring is good.
Or to put it another way, for the Survivor fans, HALO is your portfolio’s “Immunity Idol” (protection from getting voted off the island for all the nonfans). It won’t last forever, but while the rest of the market figures out who AI is voting off the island, you’re sitting in businesses that generate real cash flow and return it to shareholders. It’s no coincidence that the resurgence in HALO stocks has gone hand in hand with renewed demand for dividend strategies. Hard assets and steady income tend to travel together.
Improving economy
As we have noted, one of the tailwinds for markets in the second half of last year was firming-up economic activity pushing down any talk of near-term recession risk. This helped markets post those great gains. Impressively, this improving economic trend has picked up even more so in 2026. Providing a helping hand is manufacturing, one of the more cyclical components of the overall economy. Trends in PMI manufacturing surveys globally have been improving over the past few months and this accelerated this past month. That includes the U.S. which saw a huge increase in new orders.
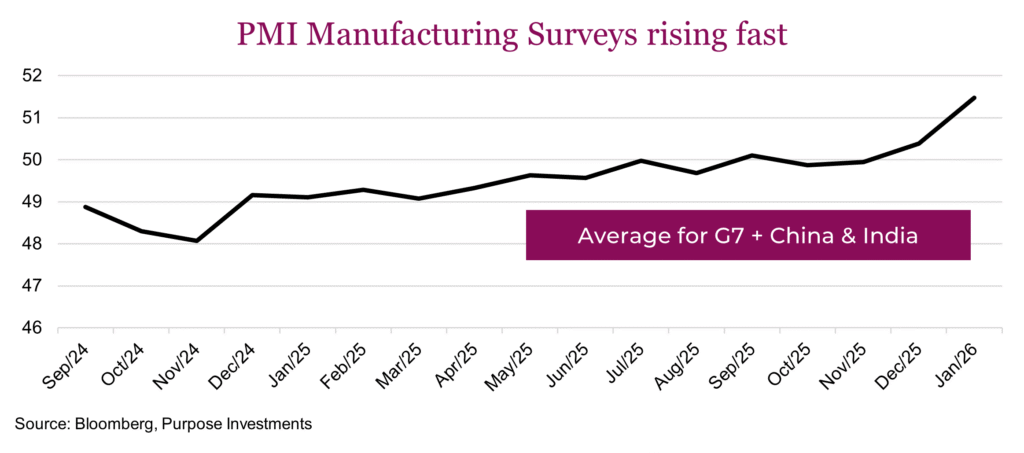
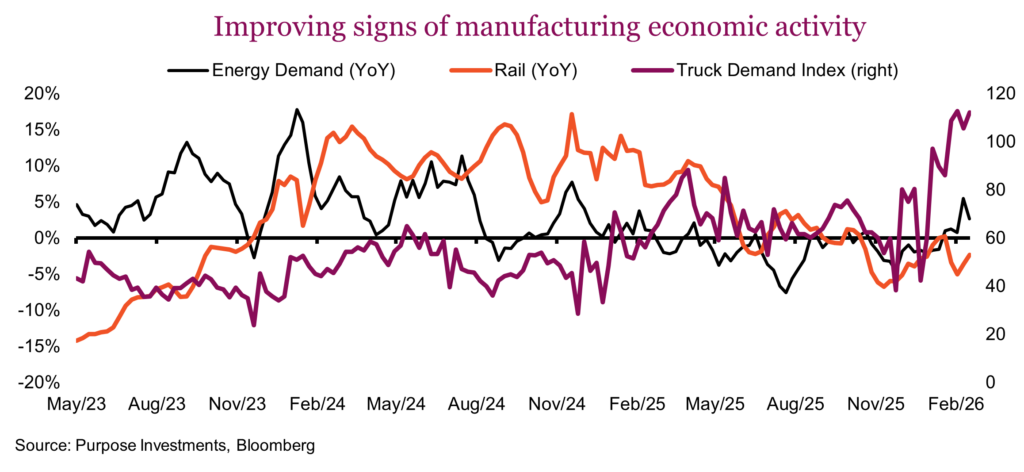
This is survey data, always worth noting. The PMI survey simply asks purchasing managers what their intentions are for next month. Fortunately, this improved survey data is supported by a decent amount of hard data as well. In the U.S., energy demand has risen decently over the past few months, often a sign of increasing economic activity in industrial production. Plus, trucking demand has jumped materially higher. Rail volumes of those intermodal containers have not improved yet, but we would highlight port volumes are on the rise.
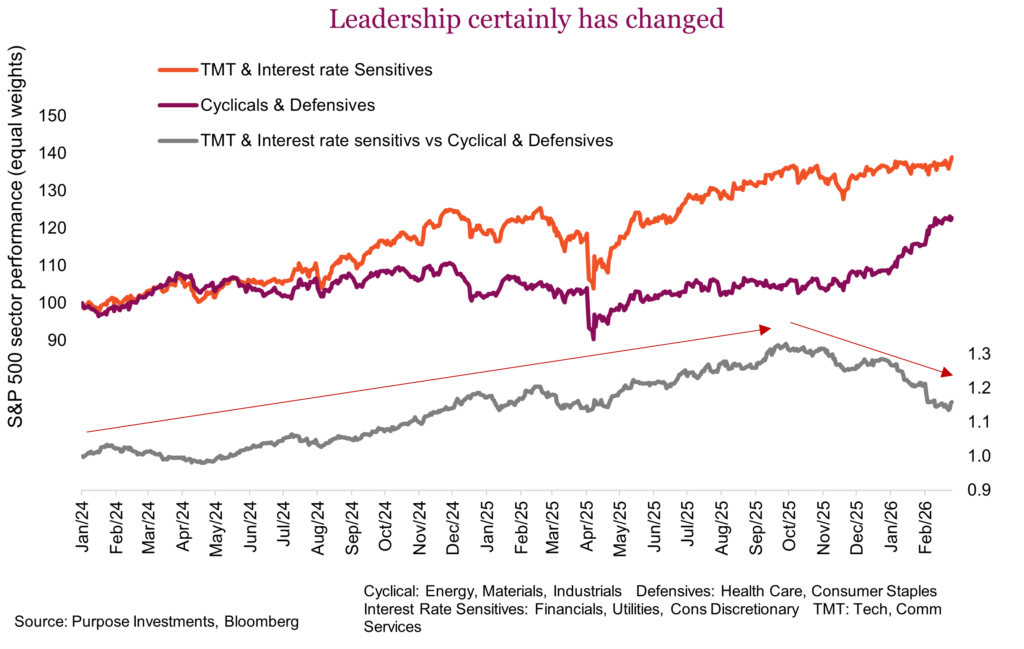
This improving economic data is not a secret; the stock market is well aware of it. In 2024 and most of 2025, market leadership was driven by tech, media and interest rate sensitives such as financials and consumer discretionary. But since late 2025 this leadership has changed. While defensives such as health care and consumer staples are doing well, the big star is the economically cyclical sectors. This includes energy, materials and industrials, clearly picking up on the improving economic data and some change in leadership flows.
This improving economic data may be partially fueled by some inventory restocking. Around the tariff fiasco about a year ago, many companies stockpiled. Now with those stockpiles somewhat depleted, orders are ramping up. If just an inventory restocking, it could last a few quarters. If broader economic improvements, it could last longer. Either way, the data is pretty darn good and it is helping economic cyclicals.
Japan rising
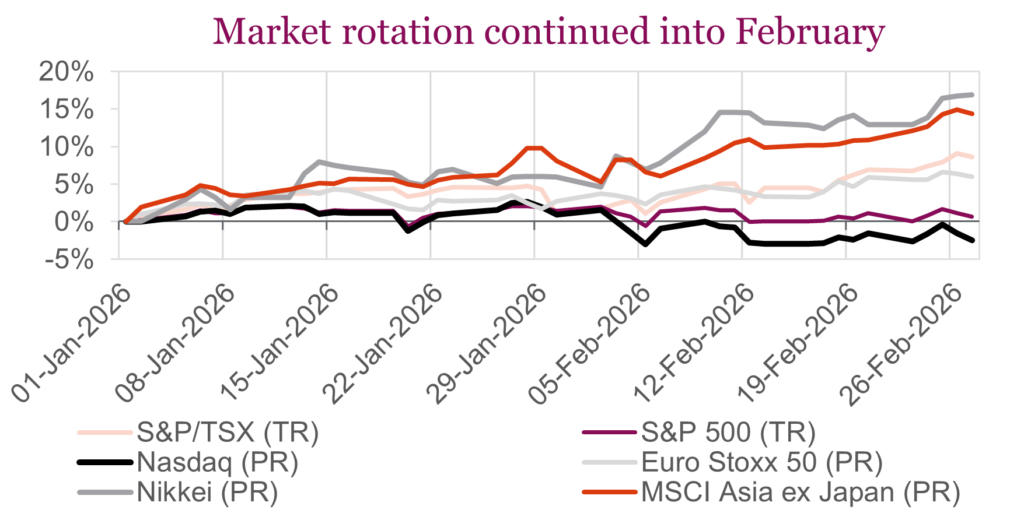
We are two months into 2026 and it has been a good year so far. Sure, the U.S. is struggling roughly flat so far but Canada is up 8%, Europe is up 6% and Japan is the star, up 17%. We have had a pretty heavy exposure to Japan, more than the vast majority in the multi-asset space, for some time (June of 2022 to be specific). So, we are well aware of this strong performance, which may be lost on most investors given Japan is generally under-owned in our opinion.
The stars have really aligned for Japan so far this year. Politics have become a positive, increasing likelihood of more economic stimulus. But we would not get too excited, relying on politicians for market returns is rarely a good strategy. Fortunately, there are a number of longer-term or even secular factors that are providing tailwinds for Japanese equities.
It’s cheap – Not from a valuation perspective after the recent equity market advance. In Canadian dollar terms, the Nikkei is up 17% year-to-date after being up 21%, 16% and 16% in the last three calendar years. This has pushed valuations higher, now up to 19x from 12x back in 2022. However, the yen remains very cheap, as just about anyone who has vacationed in Japan recently can attest to.
There are structural reasons for the low yen, which does provide a cautionary tale for any central bank considering yield curve control. But with inflation returns and yields rising accordingly, this is a positive. And if the yen stays cheap, it does continue to provide Japanese exporters a strong competitive advantage.
Improved governance – Corporate philosophy has been gradually changing in Japan to be more shareholder friendly. America remains the gold standard for putting shareholders first, above other stakeholders, including employees. We’re generalizing here, but in previous decades Japanese corporations put more emphasis on stability versus shareholder value. This resulted in less labour mobility, more cross-ownership, more holding accumulated cash.
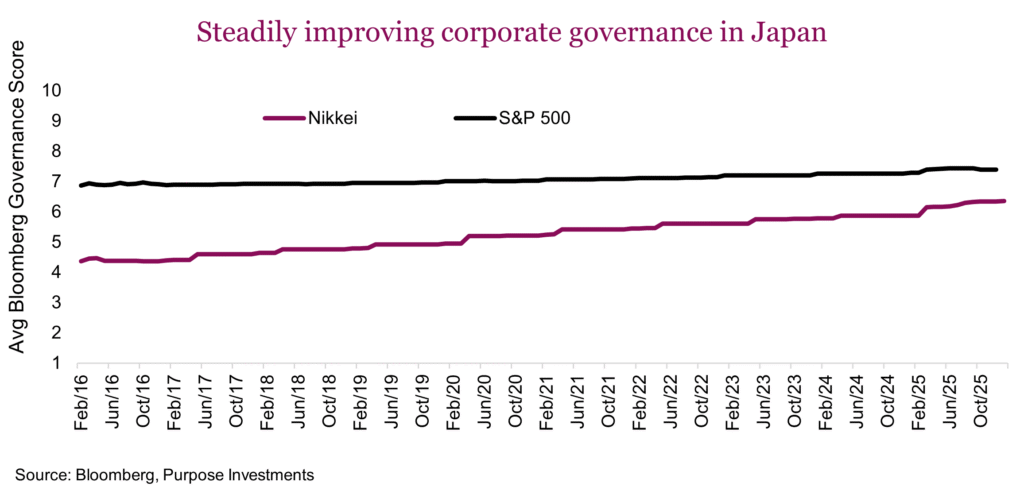
This has been gradually changing over the past few years, some from regulatory efforts, some by shareholder pressure, some by the need to foster more economic growth. It is challenging to try and measure this but looking at the average governance score over time for Nikkei and S&P companies does capture this trend. Governance measures a number of factors believed to capture shareholder interests. The gap is closing.
There are other factors as well. Cross ownership appears to be on the decline and companies are returning more money to shareholders. This is a secular change and is good for markets. Below we have recreated a chart measuring the return on equity for Japan since the late 1970s. This is a secular trend and may continue to provide a tailwind for equities.
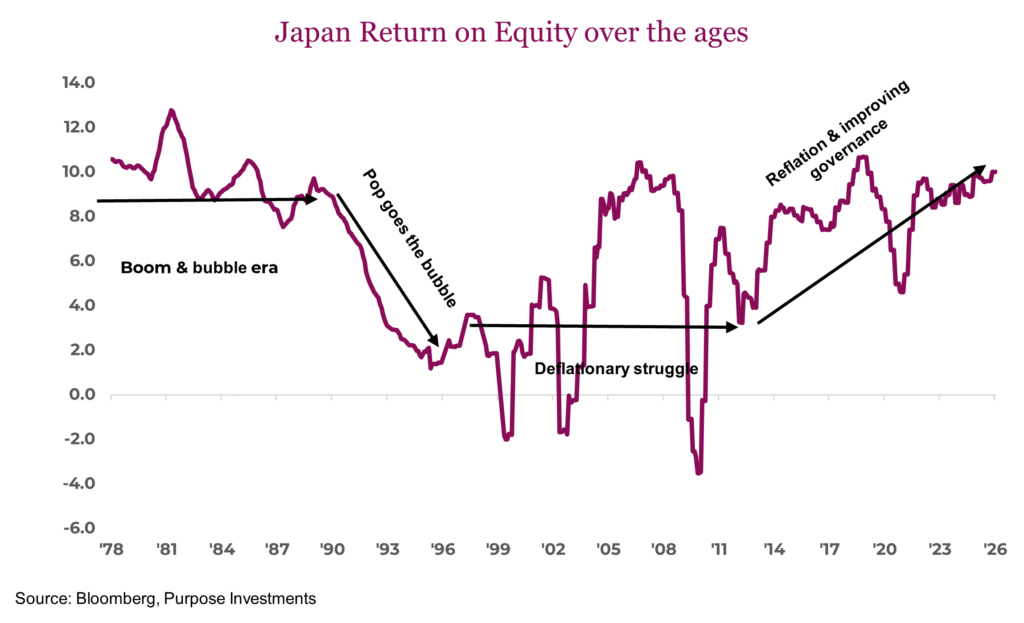
We are not saying it’s smooth sailing for Japan. It’s certainly a bit overbought in the short term. And in the longer term there is a very challenging demographic dynamic and just a wee bit of accumulated debt. That was sarcasm, Japan is the most indebted developed nation in the world. These headwinds are not new and the tailwinds continue to improve. Plus, global investors appear to be warming to Japan. We remain positive on exposure to Japan.
Market cycle & portfolio positioning
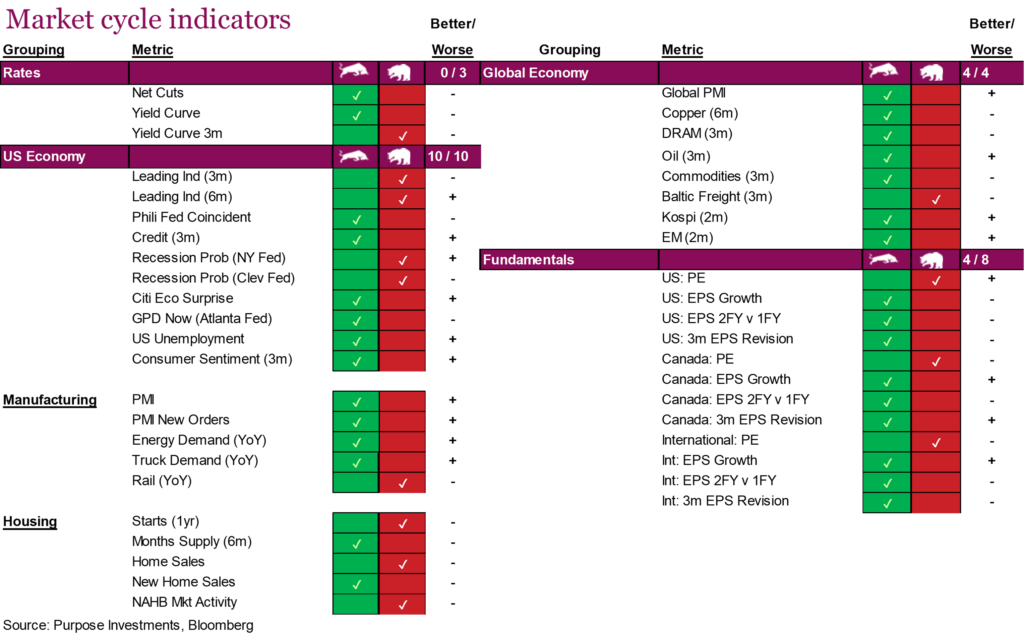
Let’s jump into it, the data was decent last month and is improved again this month. Probably not much of a surprise if you have been reading this Ethos in order. The biggest positive moves were in manufacturing, as the PMI indicators turned bullish off last month’s encouraging survey. This good news was offset in some softening in housing data. Housing and manufacturing are the more cyclical components of the U.S. economy, in case you were wondering why they are carved out and given their own groupings in the table below. On the global side, there was an improvement as oil turned bullish.
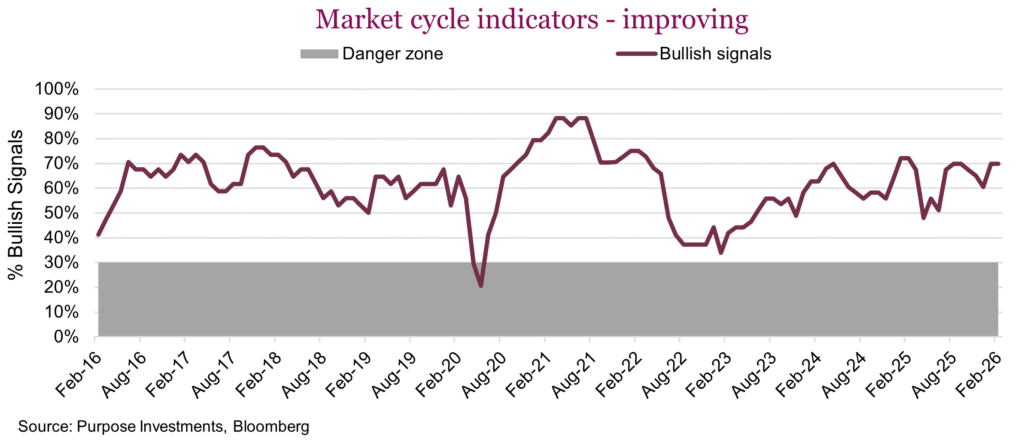
Add it all up, healthy market cycle that become even a bit more healthy.
Being more defensive, a tilt towards equal weight in the U.S. which has been working really well of late, having more cash, provides optionality. Given a healthy market cycle, we continue to view market weakness as an opportunity.
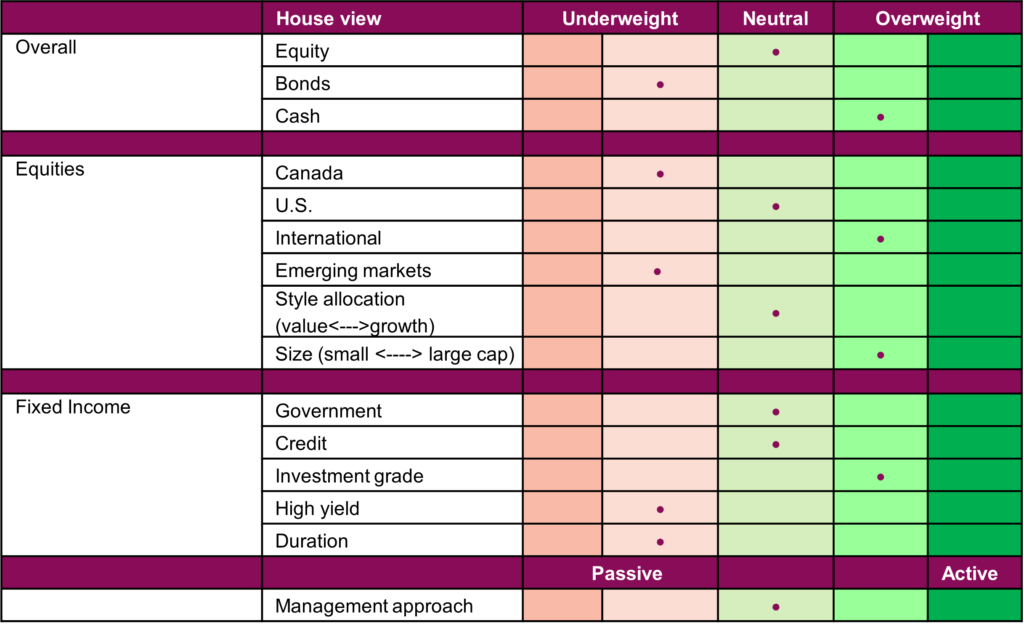
Portfolio positioning
Final note
This year is off to a good start. Dividend factor is doing well, cyclicals are helping the TSX make new highs, international flying, economic data better, it’s was all working out well. But now, we have an energy crisis afoot and inflation fears rising with the new geopolitical unrest in the Middle East igniting at the end of February. Stay tuned as we digest the quick moving headlines and evaluate the impact on markets and portfolios.