
Investor Strategy
June 3, 2025
Opportunistic diversification
Sign up here to receive the Market Ethos by email.
- May flowers
- Policy to the rescue?
- Constructive on emerging markets
- Global in name only
- Market cycle & portfolio positioning
- Final note
May flowers
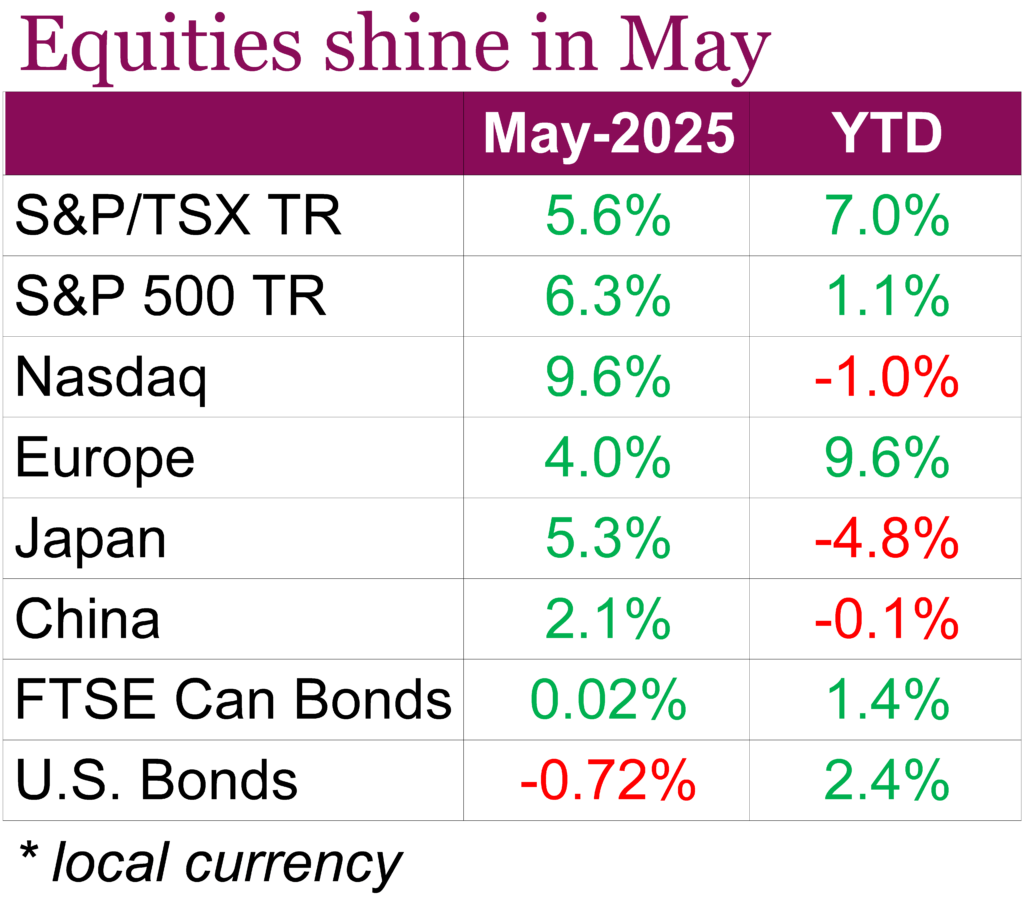
It may sound cliché, but April showers really did bring May flowers. Global equity markets saw a strong rebound in May with both Canadian and U.S. equities posting significant gains. The TSX rose 5.56% on a total return basis, hitting multiple all-time highs and marking a 16.7% rally since its April low, largely supported by gold and metal mining stocks. Economic data eased some concerns, with Canada’s Q1 GDP growing at an annualized 2.2%, exceeding expectations due to a spike in exports and inventory buildup ahead of anticipated U.S. tariffs. Still, domestic demand remained weak, and economists expect this momentum to fade later this year. Despite a strong May, concerns about economic headwinds, such as high unemployment and tariff uncertainty, persist. While the Bank of Canada’s rate cuts and potential trade clarity could support markets long-term, analysts remain cautious about short-term volatility and potential corrections.
In the U.S., the S&P 500 and Nasdaq posted impressive total returns of 6.29% and 9.65% respectively, buoyed by a resurgence in Big Tech and improved investor sentiment. The S&P notched its best monthly performance since November 2023, helped by easing inflation and a sharp rebound in consumer confidence, which rose to a four-year high. However, softer consumer spending and a narrowing labour market have pointed to some economic deceleration. The market rally was also supported by hopes for trade resolutions, as President Trump delayed new tariffs to allow further negotiations between the EU and China. Despite U.S. equity markets clawing back losses, there has been a notable shift in markets. Investors in Asia and Europe have reduced exposure to U.S. assets amid rising geopolitical and fiscal concerns, signaling a potential long-term change in global capital flows.
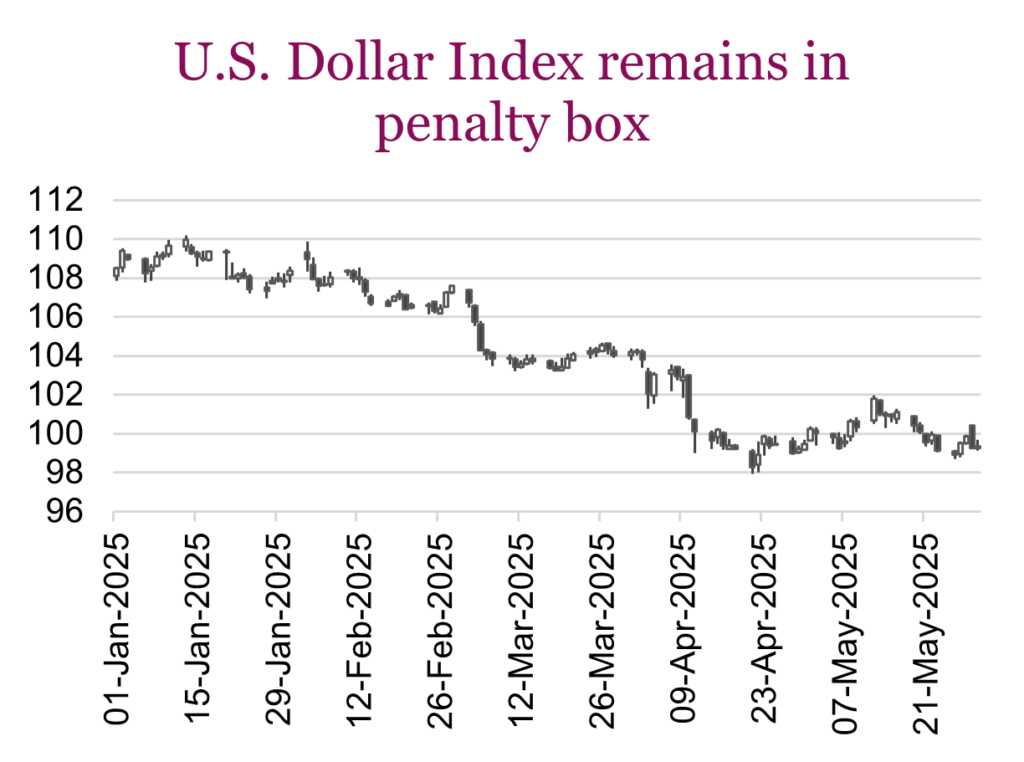
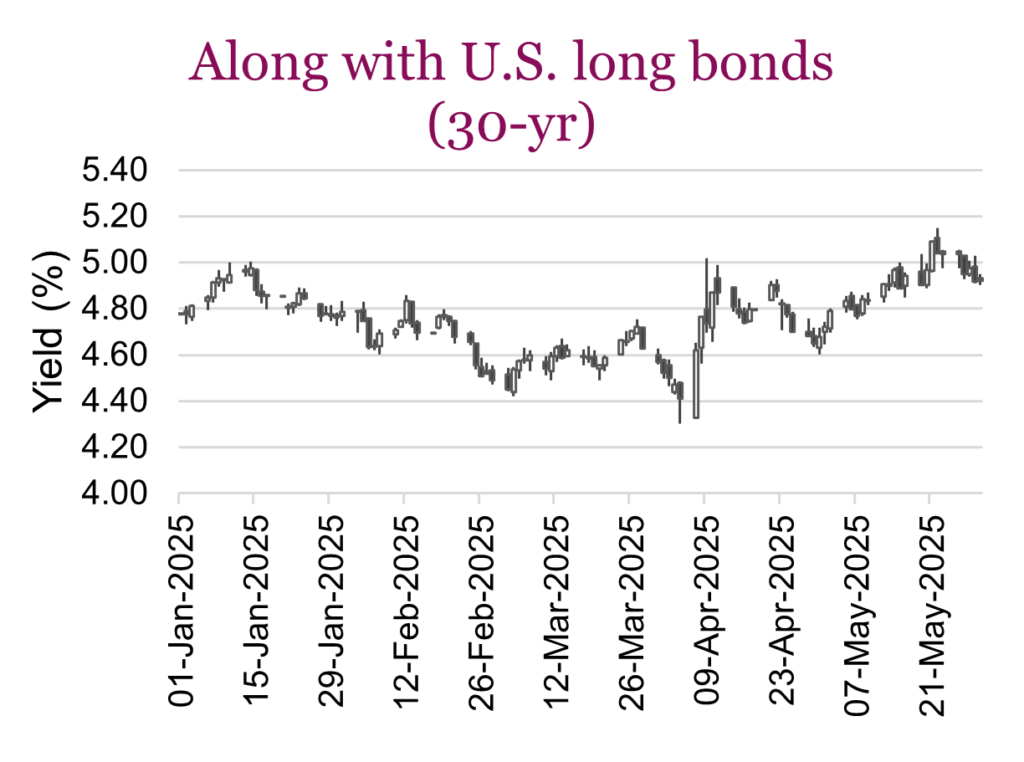
Bond markets saw heightened volatility over the month, with the U.S. 30-year yield rising to 5.15%, the highest since October 2023, before coming back down to just under 5%. The bearish sentiment came amid a U.S. downgrade, a steep selloff in Japan’s super-long bonds, and the passing of President Trump’s tax-bill in the House. While most of the activity was on the long end of the curve, U.S. aggregate bonds took a hit, ending the month -0.72% lower. The USD also continued its decline over the month, falling -0.14% over the month and now sitting -8.4% lower for the year.
Policy to the rescue?
From the late 1980s through the end of 2021, for a long 30+ years, almost without exception, policy was ubiquitously supportive of markets. If the markets or economy got into trouble, policy would come to the rescue by either cutting rates, injecting liquidity into the system, increasing fiscal spending, making direct asset purchases or changing reserve requirements. The financial crisis saw TARP (Troubled Asset Relief Program) and a slew of supportive policies, Covid saw unprecedented monetary and fiscal policies. Even the tech bubble bursting, which barely impacted the broader economy, was soothed by policy that cut rates and eased rules around home ownership. Perhaps they soothed one bubble bursting by creating another, but intentions were good.
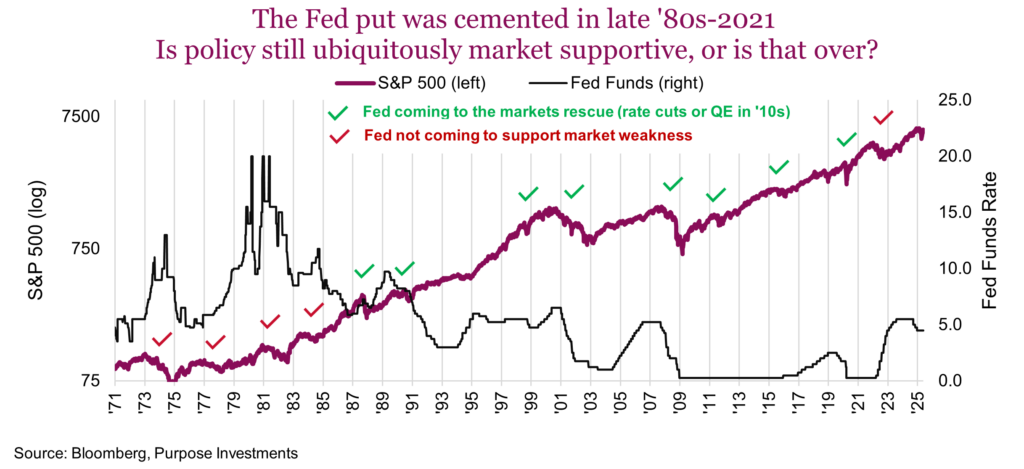
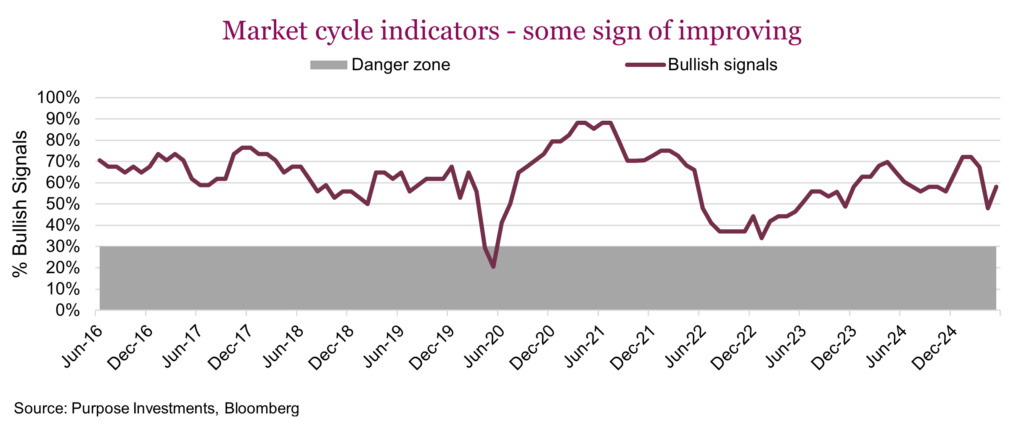
Let’s focus just on the Fed, even though this recent trend in policy spans many channels and countries. The Fed came to the rescue of markets reliably from ’87 to ’21 (see chart above with the little green check marks). But before the late ‘80s and more recently, it wasn’t as supportive (little red check marks).
Perhaps we could argue that low/falling inflation allowed the Fed to be super supportive without consequences. In the 1970s and since 2021, inflation remained elevated, limiting the central bank’s rate-cutting ability. But it isn’t just the Fed’s monetary policy. Policy everywhere, beyond central banks and in most countries, has been very supportive of markets and the economy during this late ‘80s to 2021 period.
Supporting markets and the economy worked well, and it really resonates with voters. Higher markets make people happy, right? For some reason, that’s not the case anymore, as voters are clearly unhappy with established parties and continue to vote for material change. Income disparity, lack of opportunities, costs of living and home ownership, trade injustices, etc. – whether these are real or just perceived, the global trend is voting in politicians to tackle these other issues.
So, policy change is afoot in the 2020s, with the downside that policy uncertainty is higher now — relying on policy to save markets may be more tenuous. This isn’t a bad thing; bigger, global problems are starting to be tackled these days, which is likely good for society.
The challenge is that markets would prefer no change unless they need help. But the world has some big challenges, and these could use addressing. Some may be positive for markets, like an effort to improve productivity or growth. Some are not, like changing trade/tax rules.
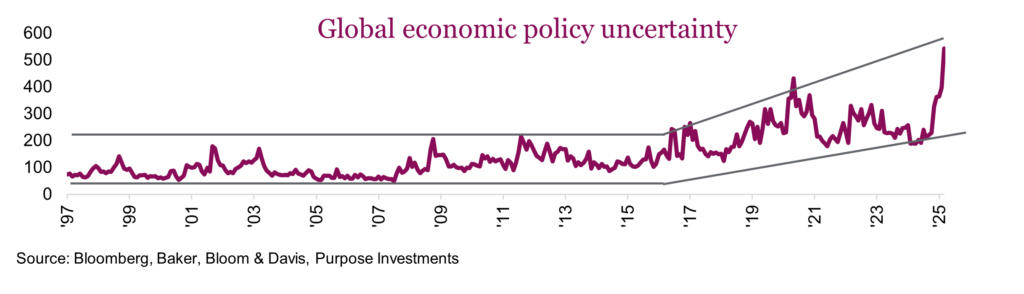
This isn’t just because we have a new president; this rising policy uncertainty has been rising for a while. The challenge is that we are now likely to see more policy corrections, like the one earlier this year. A change of policy, whether well-founded or not, creates a spike of uncertainty in the markets.
The good news, historically, is that policy or event-driven corrections are short-lived. Clearly, this one was, with the one caveat that a policy or event correction can cause a growth slowdown, which would morph a policy correction into a more traditional economic weakness variety. Time will tell if this is in the cards in the coming months.
If we’re in an era of higher policy uncertainty, this would likely increase the frequency of policy-induced corrections. Every correction is different in duration, speed, and the root cause. Most investors are familiar with an economic slowdown correction: the economy starts to slow, earnings come under pressure, and markets react negatively. This variety of correction was dominant over the previous 30 years.
But we are now experiencing more unique corrections, caused by exogenous shocks like Covid (2020), inflation (2022) or policy (2025). Given higher inflation and a more uncertain policy environment, these more unique corrections may be more prevalent in the 2020s than the plain vanilla variant.
The challenge from a portfolio construction perspective is that these more unique corrections may require a different strategy. For a plain vanilla economic slowdown correction, the traditional portfolio diversifiers like bonds and U.S. dollar exposure work really well. For the other types, these diversifiers often don’t work as well, while other diversifiers work really well. The table below highlights the challenge by looking at what helped, hurt or was kind of in the middle from a defence diversification perspective over each correction.
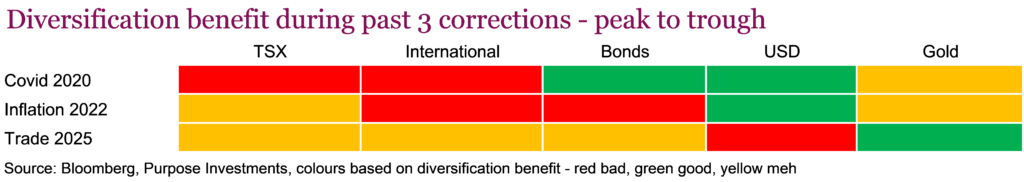
Even though Covid was an exogenous shock, traditional core diversifiers, including bonds and U.S. dollar exposure, helped the most. With inflation in 2022, the TSX did relatively well among equities thanks to resources exposure; gold helped a bit, while the U.S. dollar shone bright. And in this most recent policy correction, the TSX, international, and bonds maybe helped a bit, while the U.S. dollar sucked and gold came to the rescue.
The takeaway for portfolio construction is that while bonds remain the core defence provider, because of slowing economic growth, concerns will likely still be the most common correction type. And, atypical corrections are increasing in frequency, requiring different types of diversifiers. This supports our view that portfolios should have more diversified defence from more international equity exposure, including incrementally more alternative sources from volatility management, momentum or gold.
Additionally, a more tactical approach is needed for periods of weakness. If that involves policy, or if an exogenous shock is induced, we recommend a quicker buying-the-dip approach. Inflation or economic weakness-driven corrections may require more patience, as these take longer to work their way through market prices. It simply isn’t as easy to diversify as it has been in previous decades, requiring a more thoughtful approach to defence.
Constructive on emerging markets
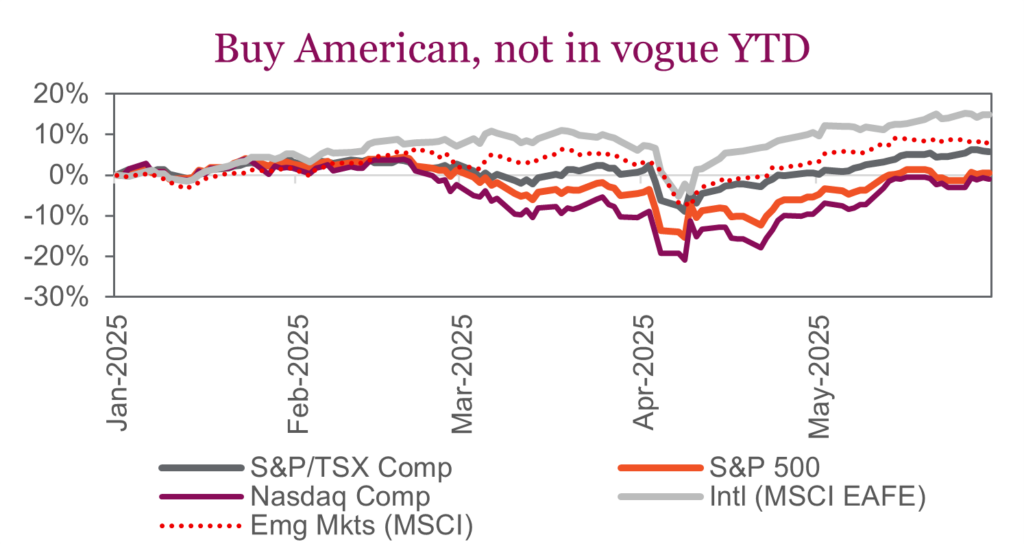
Instead of “Buy American,” investors are increasingly saying “Bye, America” and looking elsewhere to invest their capital. So far this year, the S&P 500 has rallied from the brink of a bear market to being flat on the year, while international developed markets are relative winners, with the MSCI EAFE index up 17%. Looking beyond the developed nations in the EAFE index, even emerging markets are having a strong year, up around 8% year-to-date.
Over the past year, emerging markets have kept pace with developed markets. However, this headline performance masks significant dispersion at the country level. China has delivered an impressive 20% return in the past twelve months, handily outperforming its developed and developing counterparts. In contrast, markets such as India, Taiwan, and South Korea have faced a more challenging environment. India, for its part, is showing signs of recovery and is now positive year-to-date after a significant drawdown from its peak last fall. Among the strongest emerging market performers year-to-date are Brazil (+20%), South Africa (+16%), and China (+14%).
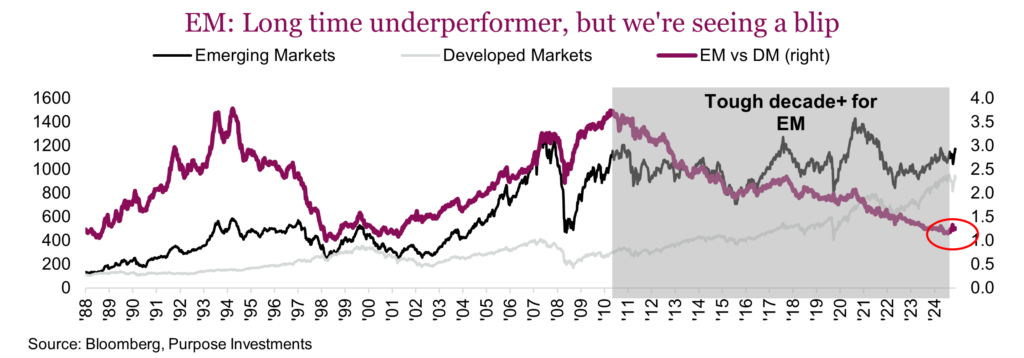
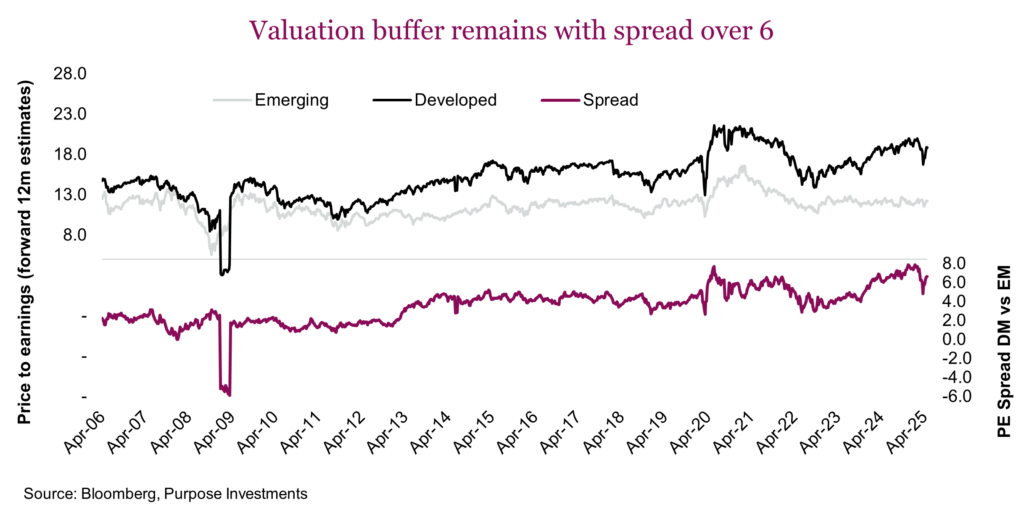
The positive view on emerging market equities, established after a long period of underperformance, as seen in the chart below, remains intact. The original thesis is underpinned by attractive valuations, an improving earnings outlook, and supportive macroeconomic conditions. We believe we are in the early stages of a long-term cycle of EM strength. While the recent gains are but a small blip on the long-term chart and risks remain, including the trade war and uncertain tariff impacts, we believe the positive fundamentals in the asset class present a compelling counterbalance for portfolios.
Valuations are still attractive
Emerging markets currently offer one of the most attractive valuation propositions in decades relative to developed markets. The EM index trades at approximately 12.5x forward earnings compared to 21.7x for the S&P 500 and 19.3x for developed markets, representing a substantial 35% discount to developed market equities. This discount reached a record earlier this year, but with a still lofty 6.8-point spread between emerging and developed markets, they remain quite attractive from a valuation perspective, providing a significant margin of safety for long-term investors.
The valuation story becomes even more compelling when examining EM value stocks specifically. The MSCI EM Value Index trades at just 9.5 forward price-to-earnings, in line with its 20-year average. In contrast, the MSCI World Value Index trades at 14.8x, two points above its 20-year average. The combination of low valuations and improving fundamental characteristics creates an asymmetric risk-reward profile favouring EM allocations.
With valuations in many countries, such as China, still very depressed, even a modest uptick in sentiment can have a dramatic impact on share prices. Given that U.S. markets are essentially fully valued, markets that can experience both earnings growth and multiple expansion offer an attractive runway to outsized returns.
Earnings growth recovery and momentum
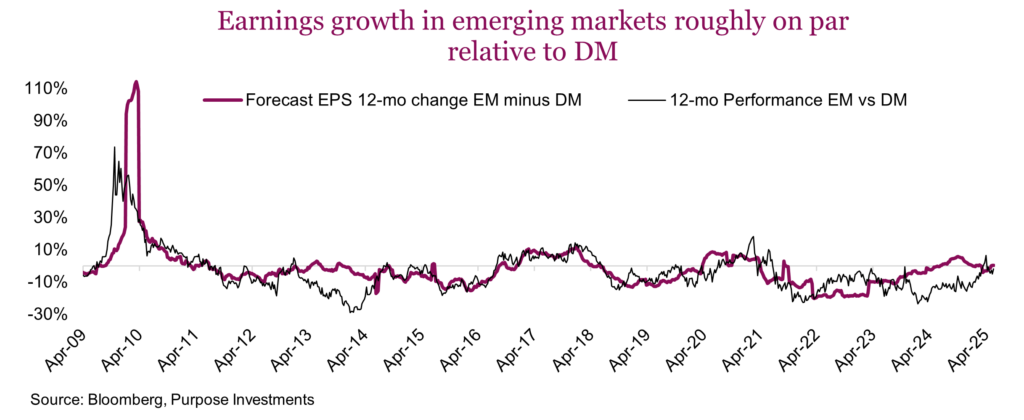
After years of disappointing earnings performance, emerging markets are experiencing a significant earnings revival that should drive future returns. EM earnings per share growth accelerated meaningfully in 2024 and is expected to continue growing strongly in 2025, representing a major shift from the previous ten-year average of just 2%. Earnings growth expectations have slowed for both emerging markets and developed markets, with the growth rates for both staying about the same.
EM relative earnings are historically depressed compared to developed markets, which skews the risk-reward equation in favour of emerging markets. With trade tensions easing and global growth conditions expected to remain supportive, EM relative earnings have significant upside potential over the next six to 12 months, even in scenarios where global growth moderates.
Favourable dollar dynamics
The U.S. dollar is down considerably in 2025, which has led to fears of dollar debasement and foreign investors dumping Treasuries and other U.S. assets (perhaps overblown but a popular narrative these days). While we don’t believe this to be a major cause for concern, our outlook is that a weaker U.S. dollar provides a significant tailwind for emerging market assets.
In the chart below, you can see the strong correlation between EM outperformance and dollar weakness. There is a strong historical inverse correlation, and while the correlation may not be as strong now compared to the past, it should still be a benefit. One of the reasons why the relationship may not be as strong is that the amount of emerging market government and corporate debt denominated in U.S. dollars has shrunk over the years, with an increasing amount denominated in local currency.
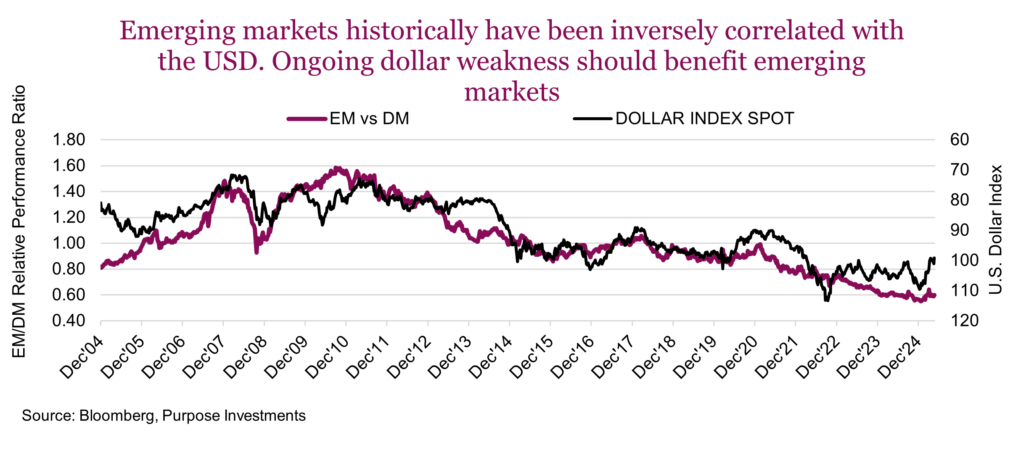
This currency dynamic has likely already benefited EM equities, with the dollar index down 10% from its highs. Based on the chart, it has helped, but the backdrop of a softening U.S. dollar should continue to be a tailwind longer-term.
While the U.S. is busy putting up barriers to trade, globally, most trade happens without the U.S. In the current environment, it’s likely that foreign companies would be increasingly willing to look to other markets outside of the U.S. rather than deal with higher tariffs. Emerging markets are in a prime position to benefit, with more trade occurring outside the US.
From a portfolio construction standpoint, we are mindful of the long-standing valuation and allocation gap as emerging markets represent approximately 39% of global GDP but only 26% of global equity market capitalization. While there is no hard science to determine an optimal allocation, this discrepancy suggests potential for structural rebalancing over time.
Although we currently have no dedicated EM allocation, we continue to monitor the opportunity set. The combination of attractive valuations, gradually improving earnings fundamentals, and long-term structural growth drivers make emerging markets an area worth watching. While risks remain and volatility is expected, the evolving macro environment could present an attractive entry point for investors with a longer time horizon.
Global in name only
There are certain phrases in portfolio management that we accept at face value, like “balanced portfolio.” “Global equity” is another one. You would think the title says it all – it sounds like a diversified portfolio with exposure across many regions. But these days, “global equity” often means one thing: The United States. And you might be holding more of it than you think.
It is no secret that the U.S. has dominated the last 10-15 years of equity returns, powered by megacap tech and accretive policy tailwinds along the way. Naturally, that success pulled more capital in, and over time, it’s changed the shape of everything it touches, including the funds meant to look beyond it.
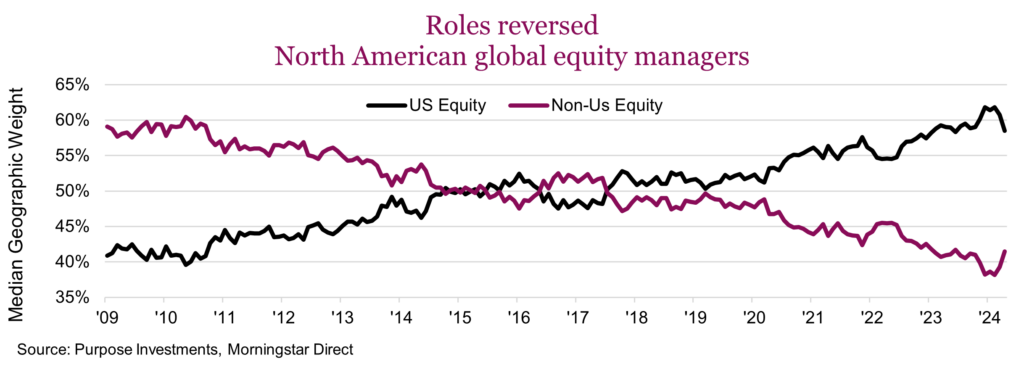
After the global financial crisis, North American global equity managers held just over 40% in U.S. equities, a modest allocation that felt reasonable given the size and influence of the U.S. market. While 40% is still a substantial country weight, it reflects a more balanced global approach. Today, that number has climbed as high as 62% and currently sits around 59%.
This shift has quietly redefined what it means to invest globally. And to be clear, no one’s blaming the managers. Ignoring U.S. dominance over the past decade would’ve been career suicide. The issue isn’t how we got here; it’s whether we’re still comfortable with where we are.
As a result, this has also influenced portfolio construction, often without investors realizing it. You might assume you’re underweight in the U.S. or sitting at a neutral position, but once you look under the hood, the picture tells a different story. Looking at some advisor model portfolio the U.S. geographic equity allocation is nearly 50%.
A few weeks back, we shared some thoughts on international equities and touched briefly on how global equity managers are positioned, but we felt it was important to bring the conversation back to the portfolio. There’s been a clear and consistent pattern: U.S. equity weights across portfolios are almost always dominant, especially relative to our baseline.
In most cases, there is an awareness that their U.S. allocation is meaningful, but the idea that it might be an overweight doesn’t always register the same way. We’re not saying that’s wrong, but it’s worth knowing, especially if the positioning wasn’t fully intentional.
But here’s the part that is most often missed. That almost 50% U.S. geographic equity exposure is not just coming from dedicated U.S. mandates. A meaningful portion is coming in through the “global” positions in the portfolio. Looking across average portfolios, the median allocation to global equity funds was 10% of the total portfolio. And within those funds, the median U.S. equity exposure was 65%. That means, for a typical balanced portfolio with a 60% equity allocation, roughly 11% of the equity sleeve ends up in U.S. equities through global funds alone.
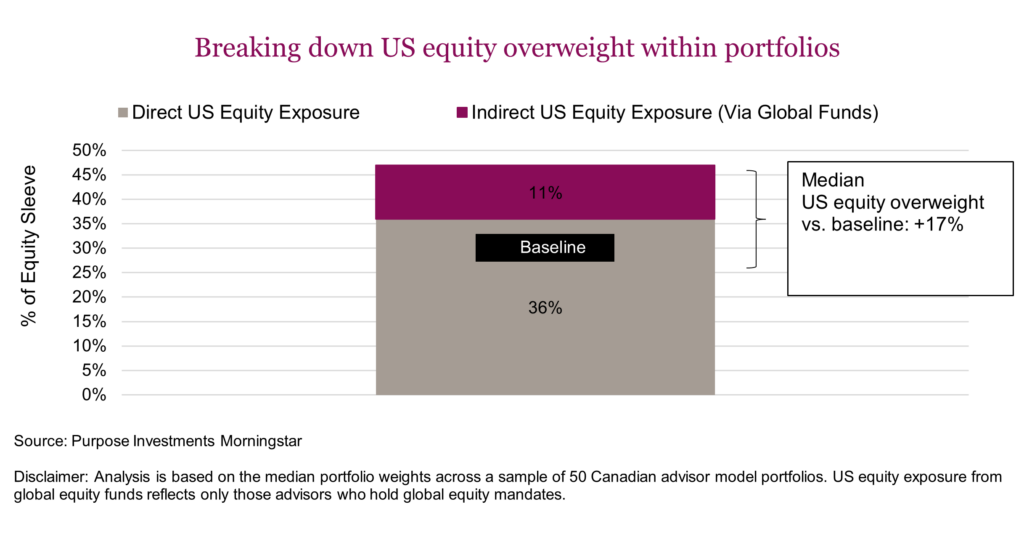
It’s one of those things that looks harmless on the surface but changes the entire shape of a portfolio. In many cases, that indirect exposure contribution brings the total weight to a level well above what is believed and almost entirely encapsulates the overweight. The global equity funds are meant to diversify regional risk and instead end up reinforcing it.
Within many of these portfolios, global equity funds have become the primary source of international exposure. And it’s easy to see why. They’ve consistently delivered, though let’s be honest, that’s mostly because of their higher U.S. exposure. That relative strength has driven more allocation to global funds, which in turn increases U.S. concentration even further. Over time, the cycle has fed itself, leaving many portfolios with less true international diversification than the labels suggest.
This is not a red flag for everyone. Some investors are very comfortable with having a higher U.S. equity weight. The idea is to bring this concentration to light and understand what you own. The real risk here is not just overexposure to the U.S., but underexposure to everything else.
We have had a very strong period for international equities so far this year, and for the most part, many portfolios did not feel that supportive benefit amidst the U.S. weakness. If the first half of the year has taught us anything, it’s that diversification is still alive and well.
This is not a call to unwind U.S. exposure or avoid global mandates, although some portfolios may be able to benefit from it. It’s just a reminder that many of the frameworks we rely on were built during a different version of “global,” and we believe the goal should be to introduce a bit more balance. Moving forward, it may be time to revisit what those funds actually hold and how much of your U.S. equity weight is coming from indirect sources. Nothing in portfolio construction is static, but this trend has moved far enough that it deserves another look.
Global equity isn’t broken, but it’s not what it used to be. If true diversification matters, it’s worth asking whether your global exposure is really as global as it claims to be.
Market cycle & portfolio positioning
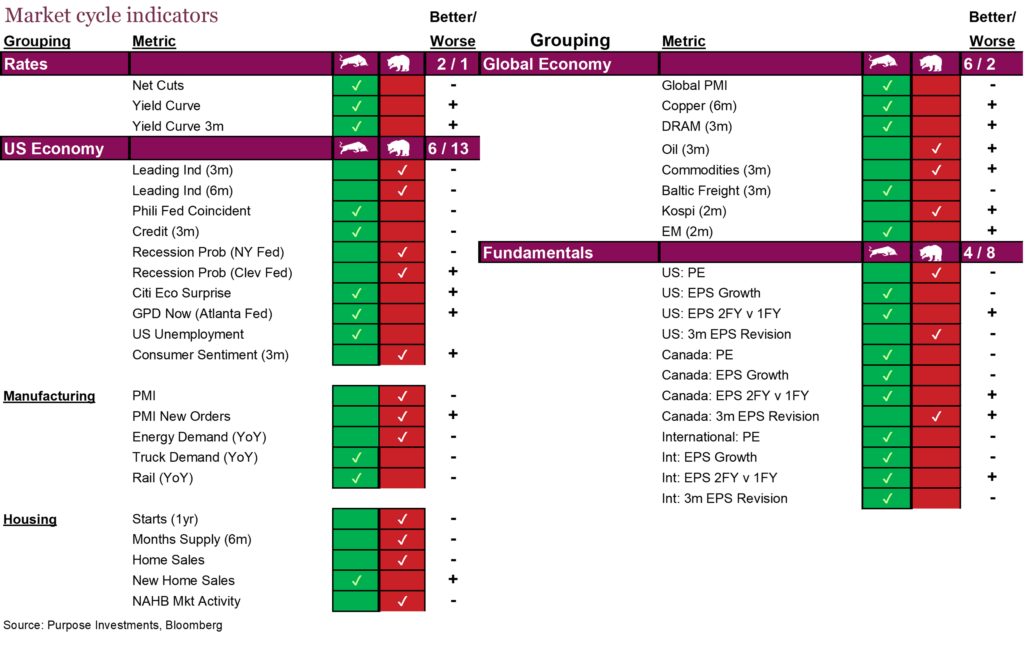
The market cycle indicators improved decently over the past month. Economic data did get a bit better, looking at the Citi Economic Surprise Index for the U.S. and the GDP Now from the Atlanta Fed. While not an indicator, Q1 US GDP revisions were not so great, with consumer spending showing a deceleration. Perhaps cooling policy uncertainty around tariffs will alleviate; time will tell.
Another potential upside: The yield curve has steepened. This may not be a huge positive, though. There is much talk of longer yields rising because of deficit concerns, and few are citing improving economic activity. The latter is good, the former not so much.
Nonetheless, an improvement is an improvement. We still believe there may be a period of economic growth weakness later this year as the impact of tariff uncertainty bleeds into the data. And given markets have largely recovered; there does appear to be a lot of good news priced in.
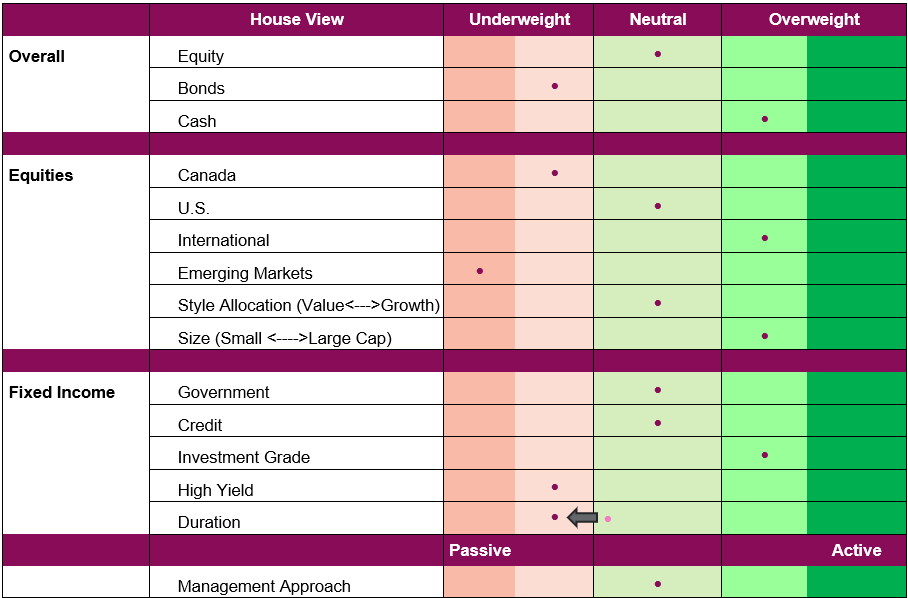
After portfolio changes in January and May (more defensive fixed income posture emphasizing reduced duration), we’re holding at about neutral on equities, under on bonds, and over on diversifiers and cash. The speed of this rebound is impressive, reminding investors that policy-induced corrections are usually quick. But now with TSX and international indexes around all-time highs, and with the S&P only a few points away, markets certainly have gone back to an “optimistic” mood. As contrarians, this does make us a bit nervous.
Portfolio Positioning
Final note
Markets sure have recovered from April’s uncertainty-driven correction, as a much less dire scenario appears to be forming. But make no mistake: policy uncertainty is likely here to stay for some time, and not just in America.
So far this year, markets have gone from being overly optimistic in the early months that trade policy would not be an issue, to overreacting to the downside, and now back to optimism. Policy could flare up again, but we do think the bigger risk is slowing earnings and economic activity, weighed down by such a prolonged period of uncertainty for investors, consumers, governments, and corporations.
2025 sure does look like a year to be opportunistic. We would encourage keeping a diversified defence and dry powder on hand in case this optimism fades in the summer months.