
Market Ethos
30 March 2026
Buy the dip … anyone?
Sign up here to receive the Market Ethos by email.
As the Middle East conflict continues to evolve, this market is starting to become increasingly fragile. Now, with bond yields rising on a combination of concern over inflation and deficits, the U.S. 10-year Treasury bond yields recently just hit 4.45%. Yields were just below 4% before hostilities started. As evidence this market is lacking confidence, it sure looks like many folks don’t want to go home on Fridays long equities. Every week since this all started, the market generally moves higher in the early days of the week only to see a slide into the close on Friday.
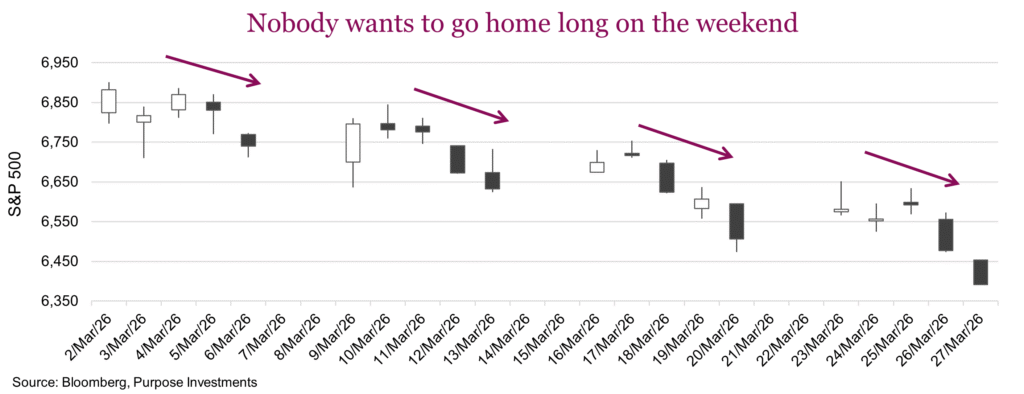
We suppose that with an ongoing war, there is greater risk of news on the weekend and no ability to act. The S&P 500 is now down about -8% from its high, recall it had been holding up better than international markets and the TSX. But that gap has narrowed and the TSX is now down less. Energy has helped the TSX, and dare we say gold is finally starting to behave normally given higher geopolitical risks.
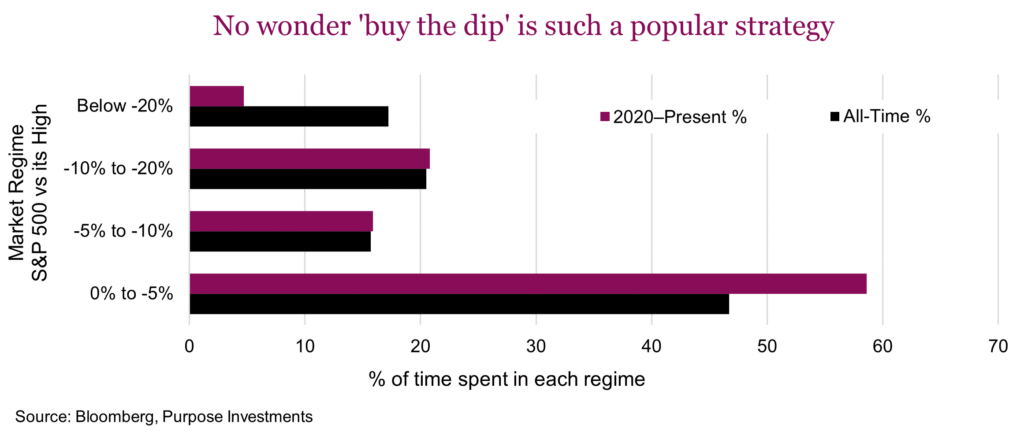
As this is clearly a dip, where are those reliable dip buyers? Pretty sure everyone has heard the term ‘buy the dip’, or the similar term with an added expletive. Dip buying has consistently been rewarded for many years with more and more investors behaving this way. Memories of bear markets that last years, or take years to recover, have been wiped from most investors’ minds. In fact, since 2020, the S&P 500 has been down -20% from its high less than 5% of the time. And most of that was during COVID. Most of the time, almost 60%, the market is within a stone’s throw of its highs. This is very different compared to the long history going back to the 1950s. And clearly supports the ‘buy the dip’ mindset.
To showcase the dip buyer behavior let’s look at equity ETF & fund flows during past corrections in this ‘buy the dip era’. The following chart (which we think is pretty cool), maps the past 11 dips (-7.5% or bigger) over the past decade. The S&P line is the average decline to the market bottom and subsequent recovery. The shaded purple area is the average flows during these dips.
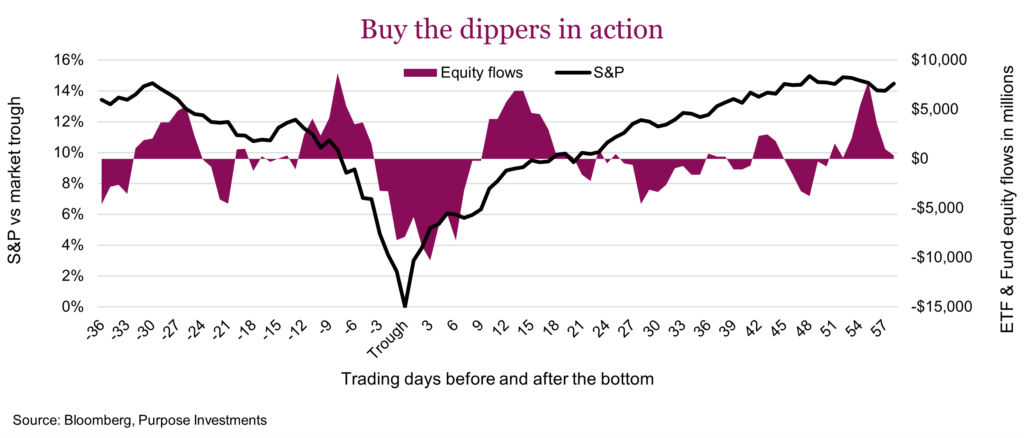
Of course, nobody knows where the ‘trough’ is until well after the fact. However, there is a pattern. Initial market weakness witnesses net buying in the early phase, which then gives way to net selling as the market drops further. This selling continues as the market begins to recover, and then the dip buyers come back in. This is a powerful look at investor behaviour during periods of market weakness.
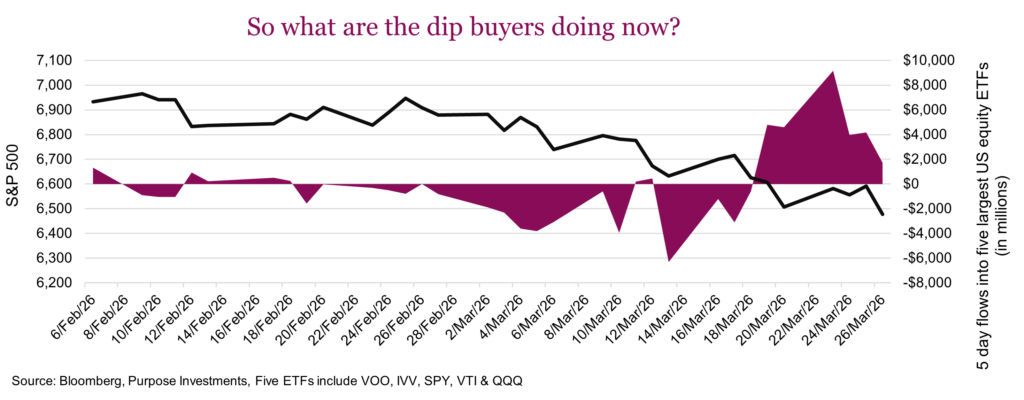
So where are the dip buyers now? Based on ICI weekly fund & ETF flows, there has been some buying on the initial weakness. The challenge with this data is the delay — the last data point is March 18, which is a week and a half stale. To help get a timelier look, we turn to flows into or out of the five largest U.S. equity ETFs. Once the S&P got down to 6,600, the buyers came in. But that activity appears to be fading — perhaps those were the initial buyers and the capitulators are coming next. We would provide the caveat that averages hide a lot of variance and of course any news on the conflict could flip things quickly. For now though, investor dip buying appears to be waning. A silver lining may be that when the sellers come rushing in, or if they do, that is often really close to the bottom. ‘Averagely’ speaking that is.
Final thoughts
It once again appeared that last Friday, investors didn’t want to go home long. Perhaps the capitulation outflows will start to mount, following the typical pattern of past periods of market weakness. This may usher in the market bottom. But fair to say much will depend on the ever-changing news flow, whether real news or fake, as markets continue to adjust for a wider variability of potential outcomes.
Bonus Ethos thoughts – The folly of “point in time” narratives
So, war breaks out in the Middle East, dramatically increasing global geopolitical risks, and gold is down more than $1,000/oz or about -20%. That is not what gold is supposed to do. Or how about a bombing campaign that has clearly gone on longer than expected, depleting missile inventories every day. Lockheed Martin, the maker of many of those missiles is down -9% since day one of the conflict. Should we be convinced this market has gone haywire? Maybe not so fast.
It isn’t just how something has performed since this event started, it is also the trajectory coming into the event that matters. Gold would have likely been a good portfolio diversifier during this conflict, had it not gone up $3,400/oz or 160% over the previous two years. And Lockheed Martin had already run from $500 to reach $680 by the first day of the war before falling back down to $625 per share.
Obviously, the big winner has been the price of oil, rising from $65/bbl to $94 based on the West Texas Intermediate. That is a pretty big jump, caused by the obvious supply issue. But let’s not forget, before this conflict most commodities enjoyed strong gains while oil was a flatline.
So far, this war has resulted in a broad mean reversion. Anything that was up a lot before the conflict started seems to have been hardest — gold, emerging markets, international equities and the TSX. Things that had performed poorly or lagged, have held up better — oil and bitcoin in the green, and the S&P down much less than most other markets. (Recall the S&P was the lagging market to most others in 2025).
While the reaction of many asset classes has seemed odd since this event got going, normalcy appears to be returning. Over the past few sessions, gold has started to behave as one would expect during a period of heightened geopolitical risk. Defensive equities such as staples, health care and utilities are now behaving as defensives again.