
Market Ethos
June 10, 2024
Everything in moderation
Sign up here to receive the Market Ethos by email.
If the wealth advice service was in the manufacturing industry, the portfolio would be akin to what we make. Sure, there are many value-added services in addition to the portfolio, but it’s the portfolio that has to succeed for the client to reach their long-term goals. So, the more we can think about portfolio construction, the better.
One challenge is that while portfolio construction is often based on as long a historical time period as possible, things never remain static. Markets evolve and change over time, relationships change, and the available tools in the portfolio construction toolbox also change over time. One recent change that has been a challenge is the bond/stock correlation. After a couple of decades of very low or even negative correlations between these two core building blocks, correlations are back to being positive.
The following chart shows the 2-year monthly correlation between Canadian equities and bonds. It looks similar for the U.S. and global markets, but we just thought some Canadian content would be nice. The higher correlation means that, more often, equities and bonds are moving in the same direction. Nobody complains when both are moving higher, like in the past 12 months, but when they move lower together, everyone starts getting grumpy, like in 2022. The second line, beta, measures not just the direction of the two asset classes but the magnitude of the relative move.
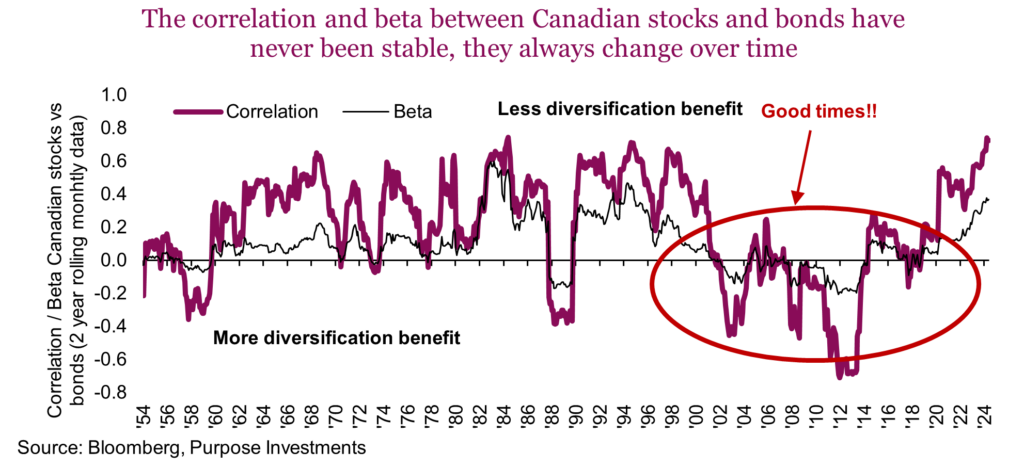
This chart goes back to the 1950s, and clearly, there have been many periods of positive equity/bond correlations. But the recent memory of 2000-2020 was a sweet spot. Equity/bond correlations were low or negative, which enhanced the benefits of diversification between equities and bonds. Now, this diversification benefit is more muted. As a possible silver lining, given yields are higher now, the return assumption for bonds is higher. So perhaps a bit less useful as a volatility management tool and a bit more on the return side – a decent trade-off.
This higher correlation has many portfolio construction practitioners looking for different sources of diversification. Of course, the proliferation of different tools has augmented this behaviour as well. Many have lower correlations, but we would caution against this as the main driver of a decision.
Why do we care about correlation? In 2022, you couldn’t go a day or two without seeing an article talking about the 60/40 being dead due to higher correlations between bonds and stocks. And yet, the correlation is higher today with fewer articles. That’s because nobody cares when equities and bonds are moving higher in unison, only when moving lower together. So, maybe we need some additional measures to augment correlations.
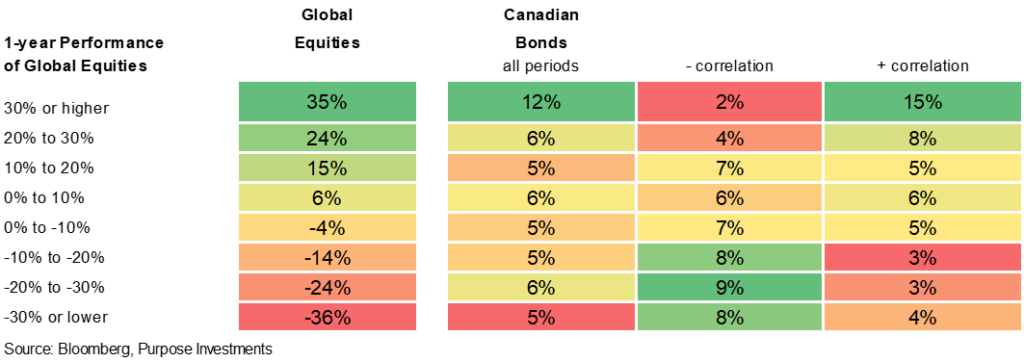
Here is a good lens. Using data back to the 1950s, we looked at the one-year returns for global equities and broke them down into return range buckets. Truthfully, who cares what their bonds are doing when stocks are up 20 or 30%? But we do care much more when stocks are down -20 or -30%. More impactful – bond returns were further split from periods with negative bond/equity correlations and those with a positive correlation (last two columns).
No denying periods with a negative bond/equity correlation that bonds are a better stabilizer during down markets. Eyeballing it, one could argue twice as good. But even when positively correlated, bonds, on average, are a decent stabilizer. Of course, these are averages that can hide a lot of information. There were 103 instances in which global equities were down on a 1-year basis simultaneously when the bond/equity correlation was positive. Bonds were higher in 77% of those instances. That hit rate moves up to 86% if you include periods when bonds were down minimally (less than -2.5%). Bonds, not broken.
Another useful lens is ‘Crisis Alpha.’ This is looking at an asset class or strategy’s performance during periods of stress in the market. This could be a short-term correction or a longer-term bear market. If you can add value during these periods, or at least stability, that has positive attributes for portfolio construction.
| Drop – Start to Bottom | |||||||||||
|---|---|---|---|---|---|---|---|---|---|---|---|
| Crisis | Start | Bottom | Duration (yrs) |
Global Stocks |
Bonds | Gold | Hedge Funds |
Long/ Short |
Mkt Neutral |
Managed Futures |
Cdn Hedge |
| 1990 Recession | Dec/89 | Sep/92 | 2.8 | -12% | 35% | -13% | 37% | ||||
| Russian debt crisis & LTCM | Jul/98 | Sep/98 | 0.2 | -12% | 4% | 4% | -10% | -8% | 0% | 10% | |
| Tech bubble burst | Mar/00 | Mar/03 | 3.0 | -48% | 32% | 21% | 11% | -10% | 31% | 37% | |
| Credit crisis | Jun/07 | Feb/09 | 1.7 | -53% | 10% | 45% | -16% | -18% | -41% | 17% | -21% |
| Euro debt crisis | Mar/11 | Sep/11 | 0.5 | -17% | 6% | 13% | -5% | -11% | -1% | 0% | -10% |
| Oil Tumble 2014 | Oct/14 | Jan/15 | 0.3 | -2% | 3% | 9% | 2% | 3% | 0% | 11% | 3% |
| China crisis | Jul/15 | Feb/16 | 0.6 | -12% | 2% | 13% | -6% | -6% | 0% | 5% | -5% |
| Q4 2018 sell-off | Sep/18 | Dec/18 | 0.3 | -14% | 2% | 8% | -4% | -7% | -5% | -2% | -6% |
| Covid | Dec/19 | Mar/20 | 0.2 | -21% | 3% | 4% | -9% | -11% | -5% | -2% | -12% |
| Inflation | Dec/21 | Sep/22 | 0.7 | -26% | -15% | -9% | 0% | -11% | -2% | 19% | -10% |
| Average | 0.8 | -23% | 5% | 12% | -4% | -9% | -3% | 10% | -9% | ||
Source: Purpose Invesments, Bloomberg, Global stocks are MSCI World, Bonds are US Bond Aggregate, Credit Suisse hedge fund indices, Barclay Managed Futures and Scotia for Canadian Hedge
The reason we expand and show all the different instances is because each has its ideal period of market weakness, and each has episodes in which the strategy falls short. For instance, market neutral typically does well but is completely wrecked during the credit crisis. Managed futures (often a momentum strategy) did really well in 2022 but not great in a number of other periods of market weakness.
Based on this, one could make a case for managed futures, more market neutral, and a splash of gold to better diversify a portfolio. But don’t forget these are crisis periods, and there is a whole lot of time between crises. Global stocks suffer, yet over the past 20 years, they have compounded around +8%. That market neutral index has only grown at a 0.8% annualized pace over the past two decades, and the managed futures index is only a bit better at 3.6%. Defence often comes at a cost.
Final thoughts
Investors should start to think differently about portfolio construction and diversification. We do believe correlations may remain elevated for some time (a future Ethos edition will tackle this) and looking to expand sources of diversification appears prudent. Call it diversifying your diversification.
But don’t get too carried away. The simple fact is when correlations are higher, it is harder to reduce portfolio volatility. Something we may have to live with. If you go too far in trying to smooth out the ride, you may sacrifice long-term returns. It would be a bit of a Pyrrhic victory to enjoy a vol of 5% if the end nest egg is smaller.
Everything in moderation – bonds still work, and some defensive diversification is clearly warranted in a more positively correlated world.