Investor Strategy
2 June 2026
Beneath the surface
Sign up here to receive the Investor Strategy by email.
- Climbing the wall of worry
- Inflation déjà vu?
- What companies are saying
- Portfolio inflation protection
- Cyclical yield
- Market cycle & portfolio positioning
- Final note
Climbing the wall of worry
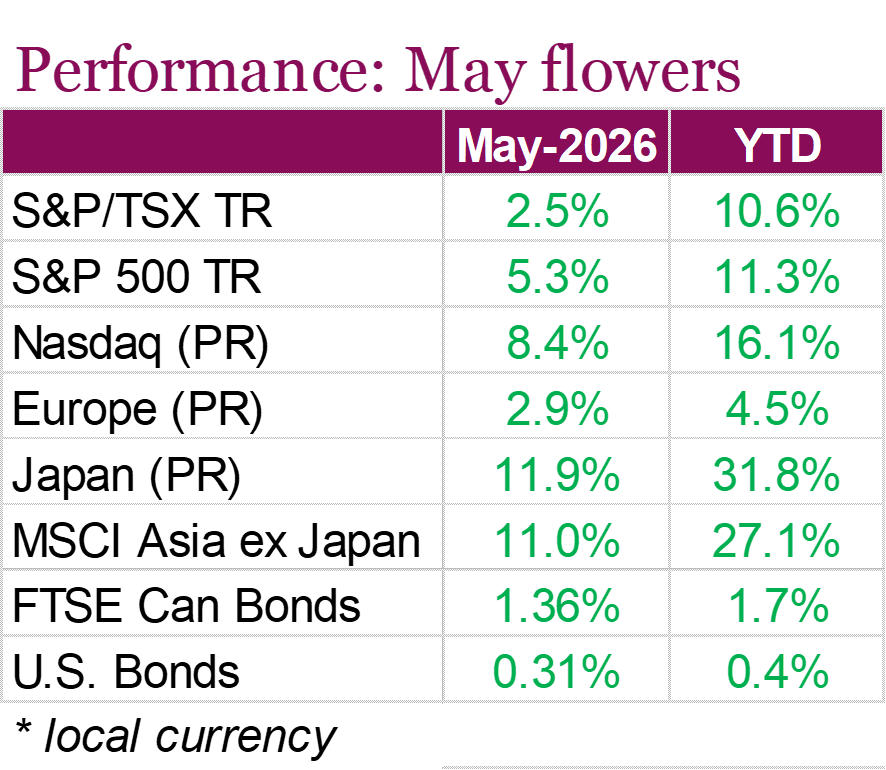
May was another strong month for markets, with North American equity indexes reaching new record highs despite ongoing economic and geopolitical uncertainty. The S&P 500 gained 5.3% on a total return basis, helped almost entirely by strength in the tech sector, signaling that market breadth is beginning to narrow once again. Continued enthusiasm around AI, strong corporate earnings, and easing concerns in the Middle East also helped the Nasdaq advance 8.4% over the month. Canadian equities moved higher as well, although not at the pace seen in the U.S., with the TSX returning 2.5% on a total return basis, helped by strength in Financials. Canadian banks delivered solid quarterly results, benefiting from strong capital markets activity and higher trading revenues. Dividend increases and share buybacks announced by several major banks highlighted the sector’s strength, although rising credit losses and slower domestic economic growth remain areas the banks continue to monitor. Fixed income markets delivered more modest gains, with Canadian Aggregate Bonds returning 1.36% and U.S. Aggregate Bonds gaining 0.31%.
A key driver of market performance over the month was earnings. With nearly all S&P 500 companies reporting Q1 results, 85% exceeded earnings expectations and 81% beat revenue forecasts. Earnings growth is tracking at 28.6% year-over-year, the strongest pace since late 2021, with analysts raising earnings estimates for both the second quarter and full year 2026. Markets also benefited from improving geopolitical sentiment. Progress towards a ceasefire agreement between the U.S. and Iran helped reduce concerns about energy supply disruptions, contributing to a decline in oil prices during the month. This was welcome news to investors who have raised concerns around oil’s impact on inflation.
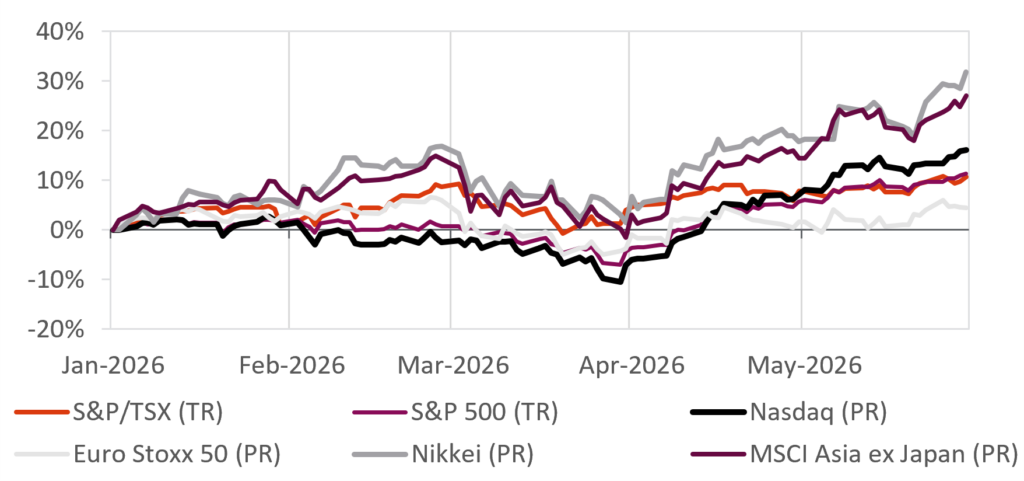
Beneath the strong market performance, however, some economic cracks are starting to show. In Canada, Q1 GDP contracted for a second consecutive quarter, pushing the economy into a technical recession for the first time since the pandemic. Business investment, exports, and government spending all weakened, while higher energy costs pushed inflation higher. Headline inflation increased to 2.8% in April, driven by higher gasoline prices. In the U.S., consumers are feeling the squeeze with the University of Michigan Sentiment Index falling to 44.8 in May, down from 49.8 in April, marking the weakest results on record. Short-term inflation expectations climbed up to 4.8%, while long-term expectations also moved higher, suggesting price concerns are becoming more prevalent, despite signs of easing tensions.
Looking ahead, investors will need to balance strong corporate fundamentals against elevated valuations, persistent inflation pressures, and geopolitical uncertainty. While markets have demonstrated impressive resilience, there remain signs that investors may not be completely at ease.
Inflation déjà vu?
Memories of the inflation spike in 2021/22 are still fresh, so the recent uptick of inflation has many feeling uneasy. U.S. CPI has printed two months a bit over 0.5%, European inflation even higher. The primary culprit is well known: a partial, albeit material, blockage in the global supply chain. This has brought the price of oil up materially, along with several other commodities and goods.
The good news is this isn’t 2021/22. That period was driven by a very unique alignment of factors, that probably won’t be repeated in a similar fashion. During COVID, mobility was limited, but people kept earning a living and savings ballooned. Once mobility returned, consumer demand rocketed higher. Meanwhile, supply chains were still struggling to adjust to changing consumer appetites. Gong show.
Most of this recent uptick in inflation can be traced back to the Strait of Hormuz, clearly the epicenter of the supply issue. Let’s assume the Strait reopens relatively soon — it will take time to get things flowing but some of the inflationary pressure should be alleviated. In fact, taking a step back, it has been impressive how the global economy has managed through this blockage. Backup pipelines springing into action, U.S. energy exports ramping, strategic reserve usage. While not yet out of the woods, a few quarters from now this may be chalked up to another one of those ‘crisis’ that didn’t quite live up to the hype. We’ll see.
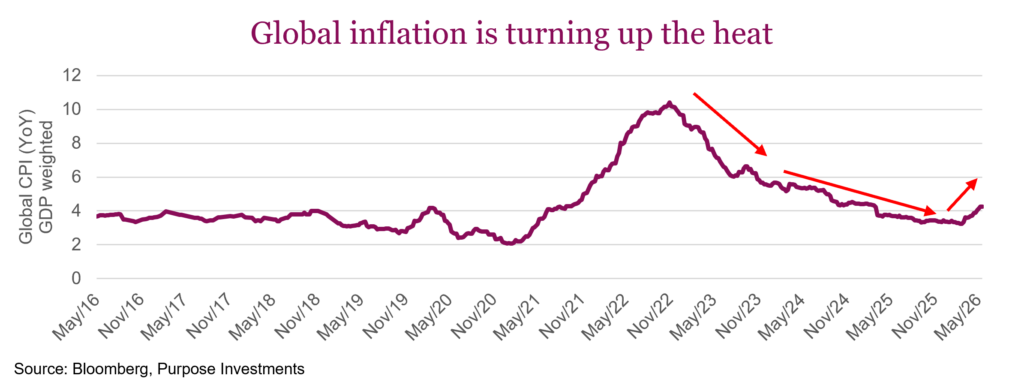
Even if the surge in energy prices fades in the coming months (assuming the Strait opens soon), don’t sound the all- clear on inflation just yet. There are a number of additional factors that we believe are working their way through the economy which will influence inflation, tilted to the upward direction. Let’s break them down.
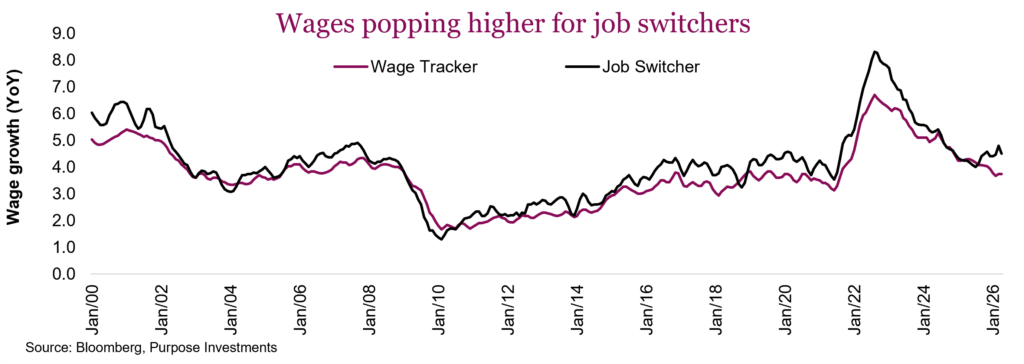
Relatively tight economy (UP) – We are going to go a little eco here. The U.S. has an unemployment rate of 4.3%, which is now below NAIRU of 4.5%. NAIRU is the non-accelerating inflation rate, implying a lower rate is too tight for the labour market. U.S. labour additions have recently been firming up after a soft 2025. Job postings have ceased their declining trend, while job switchers are seeing a rise in wages — this is characteristic of a tighter labour market.
Initial jobless claims remain low, while job cuts, which have grabbed some headlines, are trending lower. Globally unemployment is generally pretty low. On the positive side, the Small Business Survey on compensation plans remains muted. And we do have more slack in Canada’s labour market, so we’re not saying it’s tight everywhere.
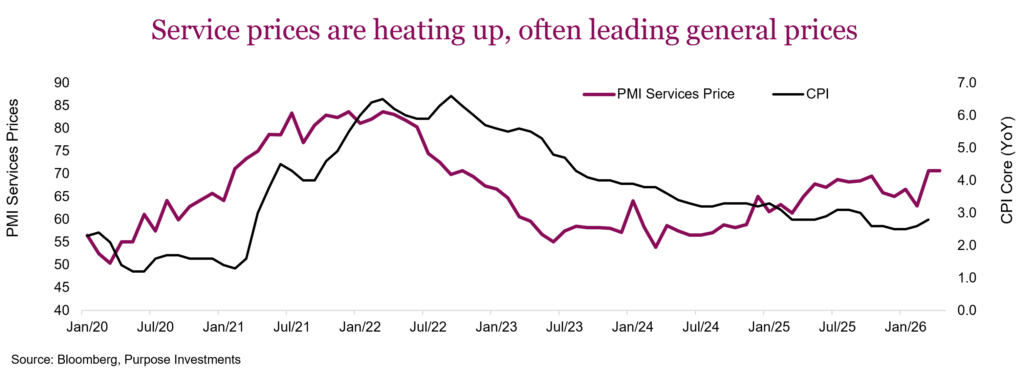
Services (UP) – Given developed economies are much more tilted towards services, with labour as the biggest cost input, wages are key. But services prices are influenced by many factors including energy costs. The monthly PMI survey for service industries in the U.S. covers everything from accommodations, food services, the arts, construction, education, finance, health care, real estate services, retail and transportation, to list a few. Prices in this survey are on the rise in the services sectors. Worth noting, this price survey has historically been a good lead on general price changes.
Artificial intelligence (UP?) – This is a nuanced one. AI carries the promise of enhancing productivity, which is disinflationary. If you can have greater output, thanks to being more productive, the price of output falls. A lot depends on what AI is being used for and if there is a time savings, what the person does with that time. Coding is more productive, being creative in software tools is amazing, drafting is a big time saver. Then again, never in our careers have we seen such a high frequency of decks and dashboards created. We will assume it is leading to better decision making.
If AI enhances productivity and that is disinflationary, why did we put ‘UP’ next to this one? Well, the infrastructure buildout of AI is increasingly inflationary. The builders of said infrastructure are all very well financed, and we believe this is a race to meet rising demand in which you can’t fall behind. Speed trumps cost or even return on investment. The result is a dramatic rise in the price of anything going into the production chain of these data centers. The examples are many; below we focus on the hardware from memory to chips to other components.
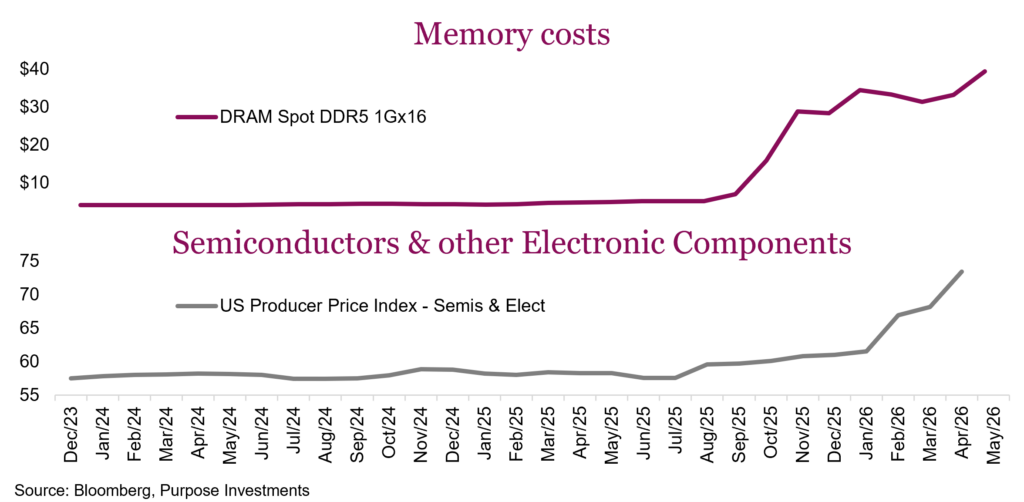
Add upward pressure on energy prices, and AI is likely inflationary before any material disinflationary benefits arise. And this is global since many of the pieces come all over the globe. The good news is that technology spending carries a minimal weight in the consumer price index. Currently it is 0.7%, behind alcoholic beverages. But while low in CPI, it has a higher impact on companies which are very good at passing along higher costs to the consumer.
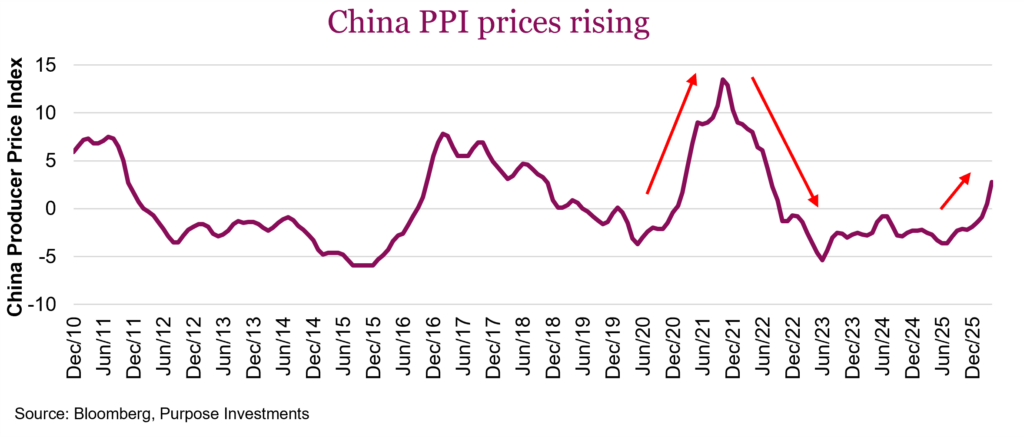
China (UP) – For decades, China was an exporter of disinflation. While initially a labour arbitrage from higher cost jurisdictions moving manufacturing to China, their prowess at manufacturing now carries many additional benefits, which has made them arguably the global manufacturing leader. As a result, for goods, their producer price index is very important as a signal on the potential path of global good prices.
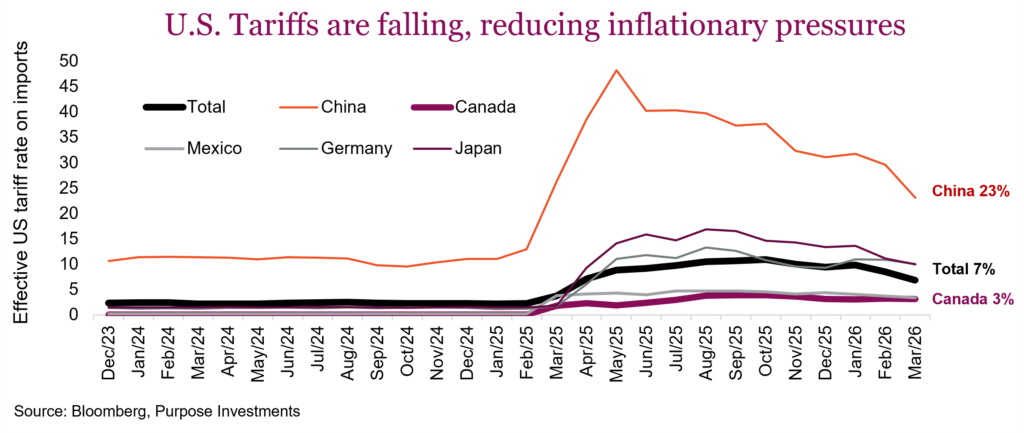
Tariffs (DOWN) – Remember those tariffs announced last year which then continued to move up and down? Well, tariffs are inflationary, but the U.S. effective tariff rates have been declining. Some court rulings, combined with additional reductions, have helped the effective tariff rate fall from over 10% six months ago to 6.8% today. If you’re wondering about the motivation for this, it is probably the desire to get inflation lower with mid-term elections approaching.
Aggregate demand (DOWN) – The inflation spike of 2022 was fueled by abnormally strong aggregate demand, thanks to accumulated savings. Focusing on the U.S. consumer, what is the difference between income and spending? A lot of moving parts, but during the pandemic, incomes were simply growing much faster than spending. But those accumulated savings are long gone. And in the past six months, spending has been growing faster than incomes. This dynamic is starting to weigh on total spending.
There are clearly factors on both sides. We believe inflation will soften, assuming the Strait of Hormuz opens shortly, but will start to rise again later this year. And the risk remains to the upside. This may help keep upward pressure on bond yields as well. No repeat of 2021/22 but certainly an upward bias.
What companies are saying
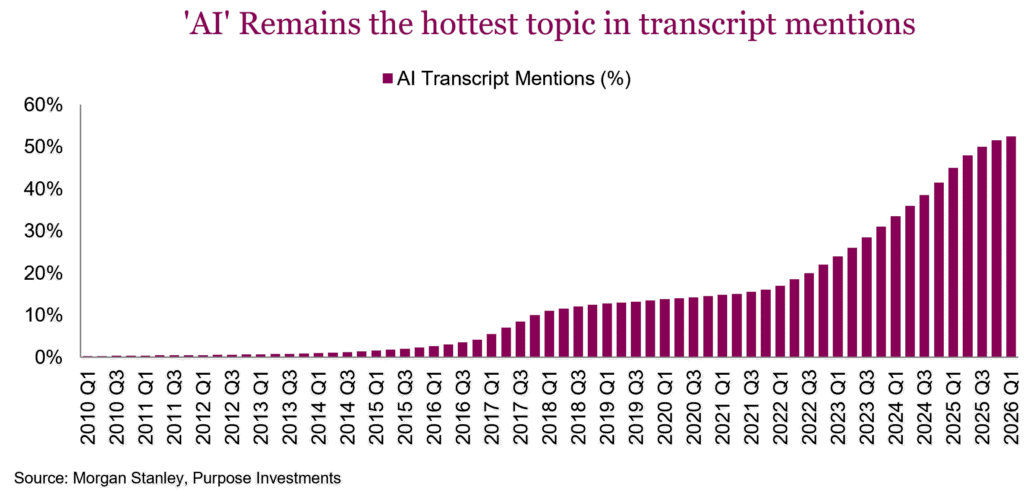
Coming out of a gangbuster earnings season dominated by very strong aggregate earnings growth, all the attention, not surprisingly, was on AI and the massive amounts of CAPEX required. This dominated the headlines and drove markets. Scanning all U.S. earnings transcripts, AI remains the hottest topic, with over 52% of companies mentioning it at least once. Since Chat GPT was launched in late 2022, as you can see in the chart below, ‘AI’ continues to grow in popularity. We will note however, that the growth rate is leveling off, with only a 1.9% increase over last quarter. The quarterly growth rate has also decreased for four quarters in a row, a clear sign that ‘AI’ is shifting to the next stage of adoption and maturation within the corporate world.
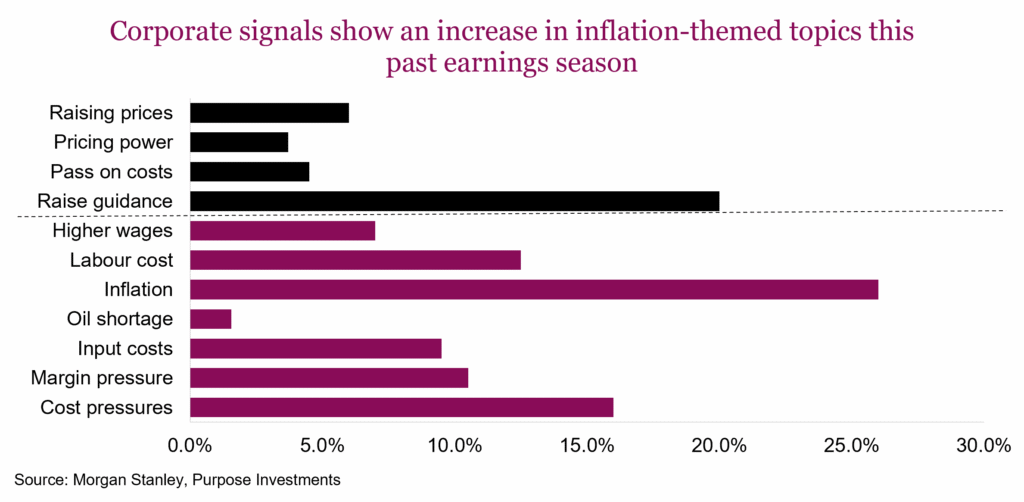
What didn’t get as much attention if you dug a little deeper was what companies were saying across the board. Inflation has crept back up as a persistent talking point. Companies themselves are confirming this with ’oil shortage’ and ‘cost/margin pressures’ which saw a marked increase versus last quarter. It’s worth noting that monitoring what companies are saying is a critical signal for the quarters to come. The graph below shows that ‘inflation’, ‘cost ‘pressure’, ‘margin pressure’ and ‘labour cost’ are increasingly hot topics for companies. Across U.S. corporations, ‘input cost’ mention hit roughly 10%, the highest reading since 2022. Similarly, ‘cost pressure’ mentions are back to roughly 16%, elevated but still below the 2022 peak of 20%. Mentions of ’inflation’ rose to about 26%, well below the 2022/2023 peaks of 50% plus. This is interesting, and aligns with our view that the current inflation fears are likely a transitory shock and still manageable.
We are also seeing more companies talking about potential cost passthroughs in coming quarters. From a sector standpoint, materials, industrials, consumer staples, energy and health care had the highest increase in cost pressure mentions. However, management teams still see the elevated costs from the energy crisis as a manageable cost event.
Proctor and Gamble said the annual cost impact of Brent at around $100 per barrel is roughly $1.3 billion before tax or $1 billion after tax versus a pre-conflict oil price in the mid-$60s, and that this goes beyond direct commodity cost to include other upstream and downstream cost impacts that would hit the P&L. 3M isn’t waiting around, they are already offsetting costs increased with price increases. Not every company acts as quick to pass through costs, Walmart so far has largely absorbed higher fuel costs alone. They also noted that higher fuel costs are expected to exert upward pressure on retail price inflation in subsequent quarters if current conditions persist.
On the consumer front, consumer-focused companies are making it clear the K-shaped economy continues. Rising costs are eating into how lower income consumers shop. Again, we’ll look to Walmart to get an assessment of their consumer base. The company said the “lower income consumer is more budget conscious and perhaps navigating financial distress, and that the number of gallons that customers fill up with when they come to fuel stations fell below ten for the first time since 2022.” McDonalds also noted that “as we’re all seeing in the press right now, gas prices, and inflation is going to disproportionately impact low-income consumers, and we expect the pressures there are going to continue.” These comments appear to be a tangible signal of growing consumer stress.
Bank earnings can be a treasure trove of insights into how the consumer is spending. Card spend data so far is holding up, with Wells Fargo and JPMorgan both explicitly stating that consumers haven’t yet reduced discretionary spending to offset higher gas prices, but they expect this to materialize in the second half of the year. Closer to home, Royal Bank had this to say on Canada and the macro environment.
“Core inflation, excluding energy, has stayed broadly stable, and our own card spending data shows consumers are still spending and service-related sectors despite the energy disruption so far. Weakness in tariff-exposed sectors has not spread to the broader economy, with growth seen in several sectors, including energy and agriculture. However, uncertainty remains elevated. The near-term outlook for Canada hinges on how CUSMA negotiations unfold and how long the Middle East conflict persists, with impacts yet to be fully felt on input costs.”
So, basically Canadians are holding up and the pockets of weakness in the economy from tariffs are so far contained.
Putting it all together, companies are signaling that the cost-pressure spike associated with the Iran conflict is real, but management teams across the board are showing confidence that they can pass these pressures through, not permanently absorb them if they remain persistent. This means higher prices for end products is a strong likelihood. Labour costs remain a popular topic, but when looking at recent wage growth trends, it’s clear that labour doesn’t have the upper hand like it did coming out of the pandemic.
Portfolio inflation protection
When most investors think about inflation risk, the first thing that comes to mind is prices going up. Prices at the pumps and the grocery store top the list, partly because energy and food make up a meaningful share of disposable income, but also because these purchases happen frequently and any increase is easy to compare. That wallet-level view captures only a fraction of how inflation actually affects our day to day. For investors, what happens at a portfolio level is actually far more important than the prices at the grocery store or the daily cup of coffee.
Inflation risk has several dimensions that affect asset classes differently. The first is the type: cost-push (supply-driven, like the current energy shock), demand-pull (overheating economy), wage-induced, or currency-induced. Each calls for a different policy response and a different portfolio response. The second is speed and persistence. A one-off elevated CPI print is not the concern; markets price the trend, not the spot reading. The third, and most underappreciated, is the secondary effects. Entrenched inflation expectations change consumer behaviour, pull forward demand, and lift term premia. The 2022 drawdown was driven less by falling earnings and more by multiple compression on rising real rates. The fourth is the lagged pass-through of input costs. Energy prices today take six to twelve months to show up on the shelf, meaning the current oil shock will feed core inflation well into 2027 even if oil retreats by year end.
A simple portfolio-centric framework starts at the top, trying to diagnose the type of inflation risk and policy regime first, then work through the portfolio line by line to identify holdings most at risk, potential winners, and any gaps. Below is an illustration of this framework as well as an explanation on how to assess the winners and losers in major asset classes.
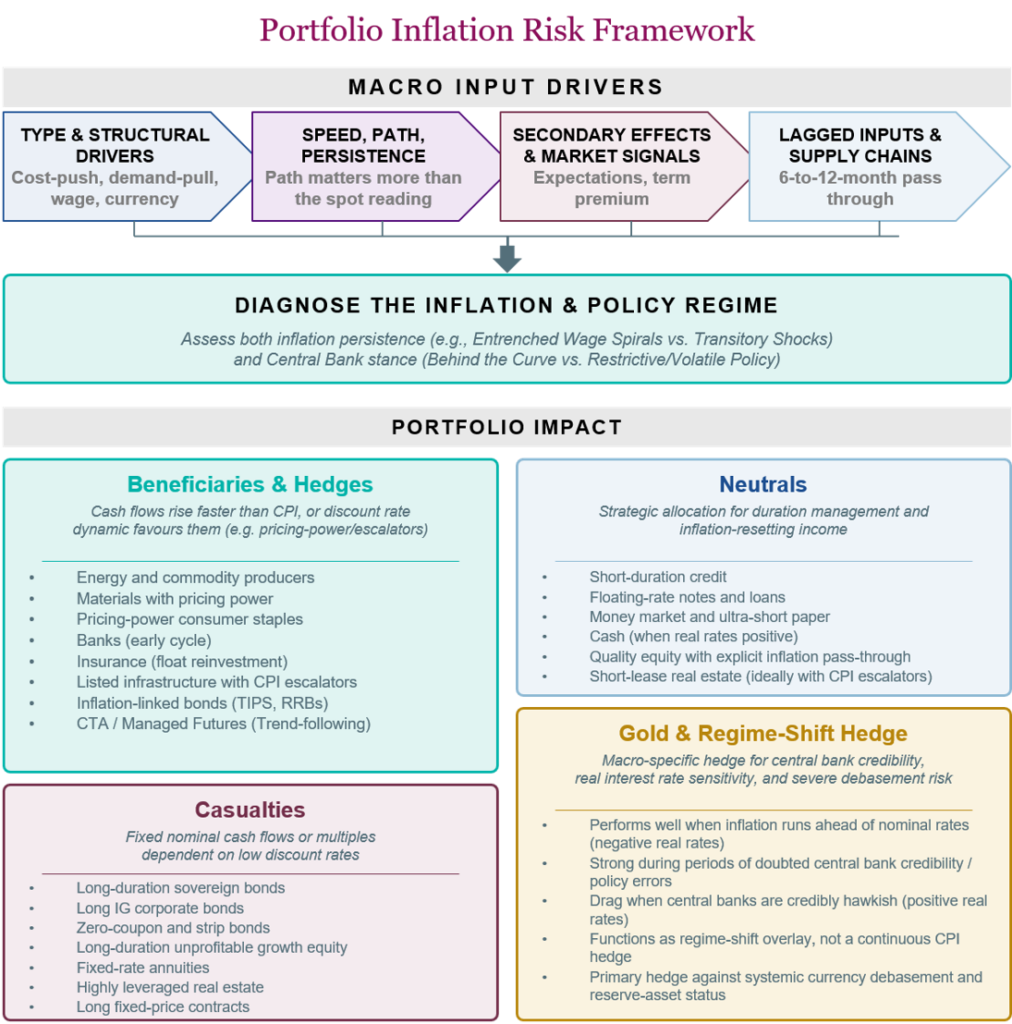
Fixed income – Higher inflation leads to higher rates, which makes fixed income the asset class most directly damaged by inflation. That said, abandoning the class altogether introduces other risks, including loss of equity-shock diversification, lack of dry powder for rebalancing, and increased portfolio volatility. The right response is repositioning rather than elimination.
The first step is to assess effective duration on a line-by-line basis to understand total rate sensitivity. From there, shortening duration is the most direct lever, whether through short-duration ETFs, short-duration credit, or floating-rate loan exposure in the right context. The yield give-up is actually quite modest. Currently, XBB (duration 6.86 yrs) yields 3.46% while XSB (duration 2.69 yrs) yields 3.09%. Giving up 37 basis points to cut duration by over half is a reasonable trade when the inflation path is uncertain. For higher-conviction inflation views, inflation-protected bonds (TIPS, Real Return Bonds) are the most direct hedge. Most of these products can be higher duration, so the short-term protection provided in a volatile rate environment can be negligible.
Equities – Equities are a reasonable hedge to moderate inflation in the 2-to-4% range. Above that, multiple compression typically outpaces nominal earnings growth. Within equities, the winners are typically more cyclical companies with commodity exposure, especially producers with long-life reserves and low extraction costs. Pricing power is king, so consumer staples with strong brands hold up well. Coca-Cola is trading at an all-time high, and a 32-pack at Costco is approaching $20, which is the pricing-power story in nutshell. Industrials with CPI escalators in long-term contracts and regulated utilities with rate riders also tend to thrive, and insurance companies benefit from float reinvested at higher rates.
The losers are typically long-duration growth stocks, though the current setup is more nuanced as most of these unprofitable growth stocks don’t seem to be all that rate sensitive given the bubblicious market behaviour. Within the sleeve, dividend tilts and value factors typically outperform, and the line-by-line work is identifying the pricing-power profile of each individual holding.
Real estate and infrastructure – Real assets provide solid inflation protection over longer horizons. Listed infrastructure typically has explicit CPI-linked escalators in long-term contracts which certainly help over the long term. Real estate has historically delivered sound protection, particularly for short-lease assets like apartments, hotels, and self-storage where leases reset quickly. The catch is rate sensitivity. Pipelines, utilities, and REITs all carry meaningful duration, and in a rising-rate environment the multiple compression can dominate the fundamental hedge in the short term. Within REITs, debt maturity and structure matter enormously. A REIT with half its debt maturing in 18 months is in a different position than one with well-laddered maturities to 2030.
Commodities – Commodities are a textbook inflation hedge, but the question is whether they’re the right hedge for this regime. Our base case is a resolution in Iran with oil retreating into year end. Direct energy exposure underperforms in that scenario, even as the lagged pass-through into core inflation continues. Base metals likely fare better as global manufacturing improves, and soft commodities depend more on weather than CPI. A specific, tactical commodity exposure is likely more protective than a broad-basket allocation in this setup.
Gold – Gold’s relationship with inflation runs through real interest rates, not nominal CPI. It performs best when inflation rises faster than nominal rates can keep up, or when central bank credibility is in doubt. As 2022 demonstrated, when central banks credibly fight inflation, gold can be a significant drag despite high headline CPI. The setup today is more favourable than it appears at first glance. Gold is trading roughly 20% off its highs, with many central banks signalling they will look through this energy shock rather than tighten aggressively against it. If that posture holds, gold has the conditions it needs to do well.
Cyclical yield
A framework we have found very useful in managing changing direction of bond yields and inflation has been Cyclical Yield vs Interest Rate Sensitives. The essence of it is to break down dividend-paying equities based on their sensitivity to changes in bond yields. If more so, they are interest-rate sensitive. Those that are less influenced by changing yields are Cyclical Yield.
This is useful as it helps you to think about how sensitive a portfolio is to changing yields or changing inflation. The fact is that real estate, utilities, telecom and gold are very interest rate-sensitive. Energy (not pipelines), insurance, transportation and banks are less so.
True to design, interest rate sensitives outperformed cyclical yield from 2010 to 2020, which bond yields roughly bottomed. Since then, cyclical yield has outperformed. With inflation likely still on the rise and keeping upward pressure on bond yields and central bank rates, cyclical yield still holds the advantage. However, when (not if) a recession materializes, that advantage will flip.
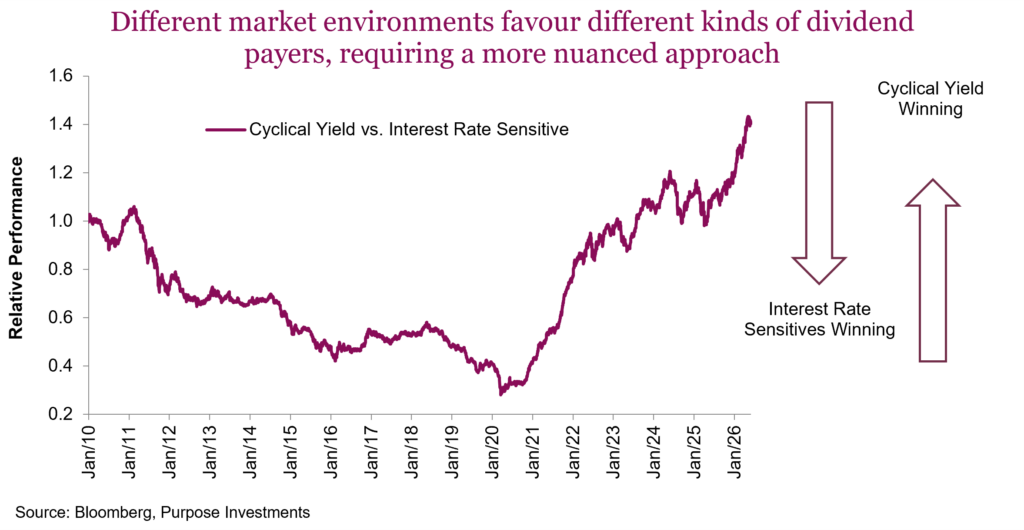
This is not the world for a static position on dividends. Having a balance of both is crucial, which we think should still be tilted towards cyclical yield ….at least for now.
Market cycle
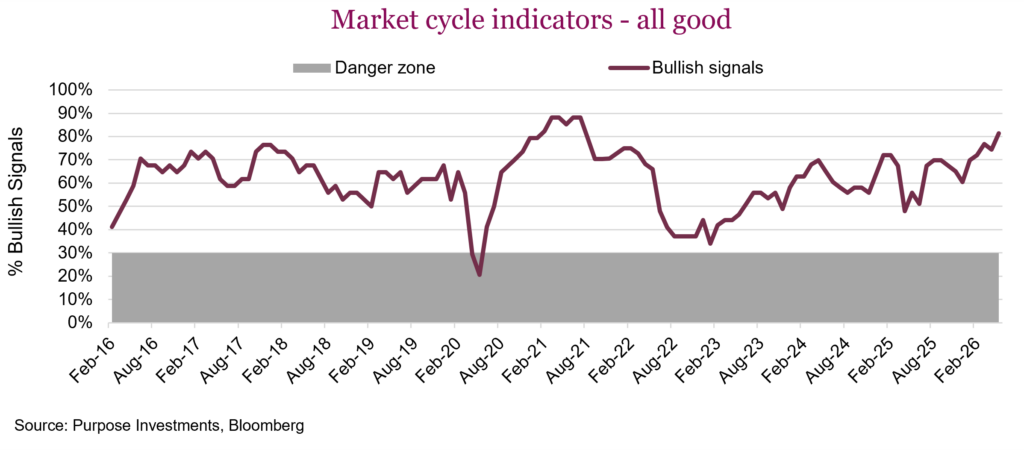
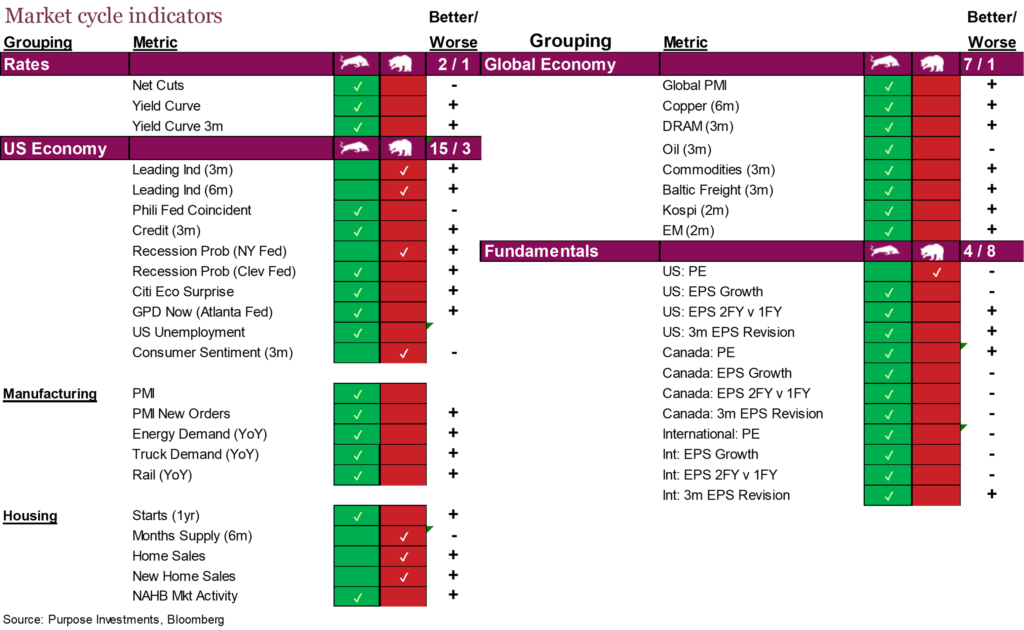
The global economic and market foundation is actually very healthy. We have just about every fundamental signal bullish and all the global economic indicators are supportive. The U.S. economy is decent, manufacturing really strong, housing soft. Overall, pretty good, which, given recent performance, the market is keenly aware of.
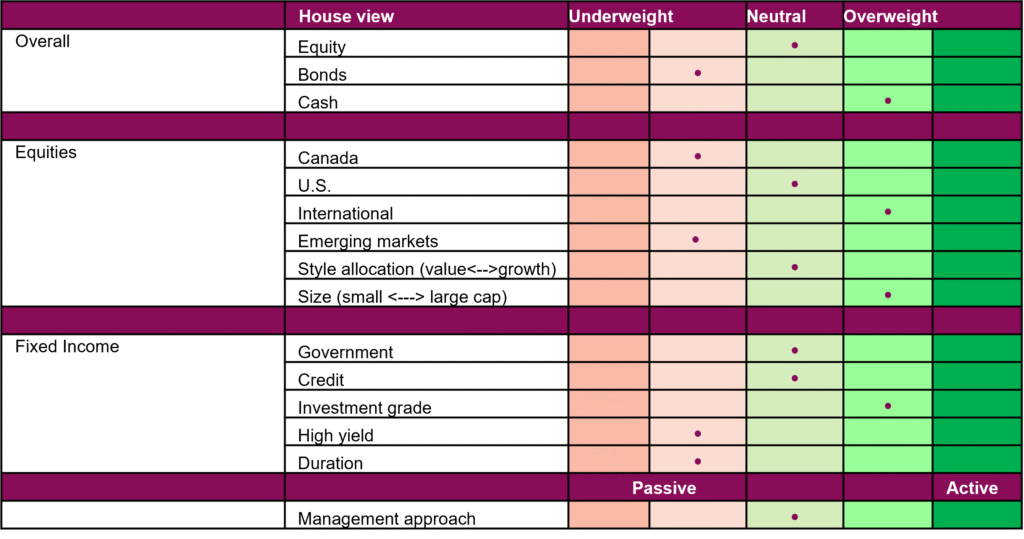
Portfolio positioning
Final note
Given our view that we are in a late stage of the market cycle, we are not surprised to see inflation experiencing upward pressure and bond yields trending higher. The equity market’s pain threshold to these factors may prove higher than most think. That is how the market behaves in the late stages, with enough good news stories to offset.
How the market absorbs these mega IPOs on the near horizon will be telling, as will margins as this inflation uptick makes its way through financial statements. Then again, this market appears more driven by narrative stories at the moment — another common late cycle characteristic. Enjoy it, these are fun times.