Earned net income from continuing operations of $3.7 million and diluted earnings per share of $0.03 in fourth quarter 2018
• On an adjusted basis, fourth quarter 2018 net income from continuing operations was $8.2 million and diluted earnings per share1 was $0.09
• Fiscal 2018 revenues grew 15%, adjusted net income from continuing operations was $34.8 million and diluted earnings per share1 was $0.40
• Board of directors approved a quarterly cash dividend of $0.025 per common share
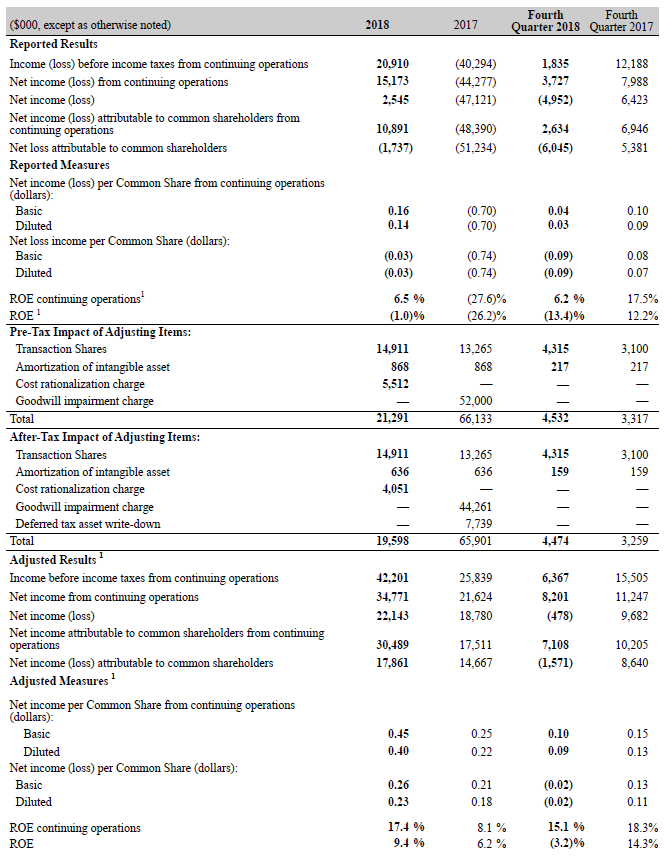
Toronto, March 1, 2019 – GMP Capital Inc. (GMP) (TSX: GMP) today reported net income from continuing operations of $3.7 million and EPS of $0.03 in fourth quarter 2018 compared with net income of $8.0 million and EPS of $0.09 in fourth quarter 2017. Adjusted EPS1 was $0.09 in fourth quarter 2018 compared with $0.13 in the prior year quarter. Revenue from continuing operations was $38.3 million in fourth quarter 2018.
GMP recorded a net loss from consolidated operations of $5.0 million in fourth quarter 2018 including a net loss of $8.7 million in our U.S. fixed income business, which was classified as a discontinued operation following our agreement to sell to a third party late last year.
“We are pleased to have delivered adjusted EPS of 9 cents in fourth quarter 2018 despite challenging market conditions, which led to negative performance across virtually all asset classes. Our performance this quarter is a testament to the strength and resiliency of our core Canadian capital market business and the continued profitability and scale of our industry-leading Wealth Management business. Our strategy moving forward is clear: we are focused on Canada. This is a market we know better than most and where we are consistently top tier and profitable,” said Harris Fricker, President and Chief Executive Officer, GMP.
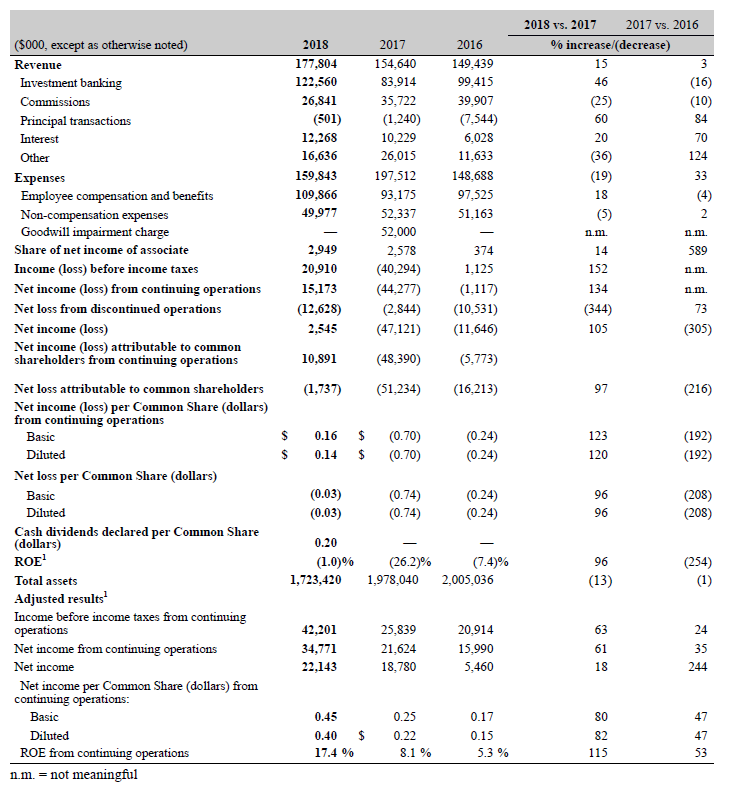
2018 revenue from continuing operations was $177.8 million, up 15% compared with 2017. GMP recorded net income from continuing operations of $15.2 million and EPS of $0.14 in 2018 compared with a net loss of $44.3 million and a diluted loss per share of $0.70 in 2017. 2017 included a $52.0 million non-cash goodwill impairment charge recorded in our Capital Markets business segment. On an adjusted basis1 net income was $34.8 million in 2018, generating EPS of $0.40 compared with net income1 of $21.6 million and EPS of $0.22 in 2017.
Commenting further, Mr. Fricker said, “We are encouraged with both the solid earnings growth we reported in 2018 and considerable strides made toward sharpening the firm’s focus on our highly profitable, scalable and core Canadian capital markets and wealth management businesses. Leading the way was a 46% increase in investment banking revenue with growth from cannabis, blockchain and energy sectors. Of note, our non-commodities businesses accounted for 70% of total investment banking revenue in 2018. Heading into 2019, the opportunity for our firm is continuing to do what we do best, namely helping small- to mid-cap companies efficiently access the requisite capital needed to grow their business.”
For further information about GMP Capital Inc., our results for fourth quarter and year-end 2018 and the meaning of certain references, this earnings release should be read in conjunction with our audited annual consolidated financial statements as at and for the year ended December 31, 2018 (2018 Annual Financial Statements), our management’s discussion and analysis for the year ended December 31, 2018 (2018 Annual MD&A) and our annual information form, which can be accessed on our website at gmpcapital.com and on SEDAR at sedar.com. Unless otherwise indicated, all dollar amounts are expressed in Canadian dollars and have been taken from our 2018 Annual Financial Statements prepared in accordance with generally accepted accounting principles (GAAP) under International Financial Reporting Standards (IFRS).
Discontinued Operations
In January 2019, GMP completed the sale of its U.S. fixed income business, which was conducted through its wholly owned U.S. subsidiary GMP Securities, LLC. As required under IFRS 5 – Non-Current Assets Held for Sale and Discontinued Operations, the operating results of the disposed U.S. fixed income business are reported as discontinued operations. Certain previously reported figures have been retroactively restated to show the discontinued operations separately from continuing operations. For further information, please refer to Note 8 to the 2018 Annual Financial Statements.
Net loss from discontinued operations was $8.7 million in fourth quarter 2018 compared with a net loss of $1.6 million in the prior year quarter. The decrease in performance relates largely to lower U.S. client-related fixed income trading activity and $5.4 million in charges in connection with the closing of the sale of our U.S. fixed income business, comprised primarily of a write-off of certain assets and goodwill, and professional fees incurred in connection with the sale.
FINANCIAL HIGHLIGHTS
Continuing Operations
Fourth Quarter 2018 versus Fourth Quarter 2017
• Revenue of $38.3 million decreased from $52.8 million.
• Net income of $3.7 million decreased from $8.0 million.
• On an adjusted basis1, net income of $8.2 million decreased from $11.2 million.
• Diluted earnings per share (EPS) of $0.03 decreased from $0.09.
• Adjusted EPS of $0.09 decreased from $0.13.
• Adjusted return on equity (ROE)1 of 15.1% compared with 18.3%.
2018 versus 2017
• Revenue of $177.8 million increased from $154.6 million.
• Net income of $15.2 million compared with a net loss of $44.3 million.
• On an adjusted basis1, net income of $34.8 million increased from $21.6 million.
• EPS of $0.14 compared with a diluted loss per share of $0.70.
• Adjusted EPS of $0.40 increased from $0.22.
• Adjusted ROE of 17.4%increased from 8.1%.
FOURTH QUARTER 2018 BUSINESS SEGMENT FINANCIAL RESULTS
FROM CONTINUING OPERATIONS
Fourth Quarter 2018 vs Fourth Quarter 2017
Revenue
Revenue of $34.5 million decreased 29% compared with fourth quarter 2017 largely due to unrealized losses on principal inventories and lower commissions. These decreases were partly offset by higher investment banking fees and higher interest revenue.
– Principal transactions generated net losses of $11.1 million in fourth quarter 2018 compared with net gains of $4.6 million in fourth quarter 2017. This decrease was led largely by unrealized losses on principal inventories acquired in connection with investment banking mandates and higher losses from client trade facilitation amid volatile equity markets in fourth quarter 2018, particularly December.
– Commission revenue of $5.7 million decreased 35% reflecting muted client trading activity, particularly in commodities.
– Investment banking revenue of $35.5 million increased 9% primarily driven by higher underwriting revenue, which increased 15% compared with fourth quarter 2017 led by notable activity in the cannabis sector. Advisory revenue in fourth quarter 2018 decreased by 7% compared with the same period a year ago.
Expenses
Expenses of $28.2 million decreased 16% compared with fourth quarter 2017 largely due to lower employee compensation and benefits expenses and lower selling, general and administrative expense. These decreases were partly offset by higher interest expense in connection with increased stock borrowing and lending activity.
– Employee compensation and benefits of $18.7 million in fourth quarter 2018 decreased 23% compared with fourth quarter 2017 led by a 32% decrease in variable compensation commensurate with lower revenue generation.
-Selling, general and administrative expenses in fourth quarter 2018 decreased 4% compared with fourth quarter 2017 led largely by lower transaction-related expenses commensurate with the decline in client trading activity over the same period and lower business development expenses.
Income Before Income Taxes
• Income before income taxes of $6.3 million decreased from $15.2 million.
WEALTH MANAGEMENT
Fourth Quarter 2018 vs Fourth Quarter 2017
-Wealth Management reported income before income taxes of $1.1 million; down from $2.1 million in fourth quarter a year ago largely due to lower dividends received on our preferred share investments in Richardson GMP following Richardson GMP’s fourth quarter 2017 redemption of its Class A preference shares and a substantial portion of its Class B preference shares. Net income in this business segment also includes our share of Richardson GMP’s net income.
Richardson GMP Highlights
The following information sets forth an overview of the consolidated financial results of Richardson GMP, on a 100% basis; noting, however, that GMP owns an approximate 33% non-controlling interest of Richardson GMP as at December 31, 2018.
Fourth Quarter 2018 vs Fourth Quarter 2017
• Revenue decreased 8% to $69.1 million primarily driven by a decrease in transactional commissions.
• Adjusted EBITDA2 decreased 16% to $10.6 million.
• AUA of $27.4 billion decreased 10%, administered by 166 advisor teams, average AUA per team of nearly $165 million.
2. Considered to be a non-GAAP financial measure. This data should be read in conjunction with the “Supplemental Information” section at the end of this press release and in the 2018 Annual MD&A.
2018 FINANCIAL HIGHLIGHTS
Selected Financial Information
2018 vs 2017
GMP reported net income of $2.5 million in 2018 compared with a net loss of $47.1 million in 2017. The increase primarily reflects a $52.0 million non-cash goodwill impairment charge recorded in 2017 in our Capital Markets segment and stronger investment banking activity. On an adjusted basis, 2018 net income was $22.1 million compared with net income of $18.8 million in 2017.
Continuing Operations
GMP reported net income of $15.2 million in 2018 from continuing operations compared with a net loss of $44.3 million in 2017. The increase primarily reflects a $52.0 million non-cash goodwill impairment charge recorded in 2017 in our Capital Markets segment and stronger investment banking revenue in 2018. Results in Wealth Management in 2018 included $2.3 million in dividends received on our preferred share investments in Richardson GMP, compared with $14.4 million received in 2017. Results in 2018 also included a $4.1 million (after-tax) cost rationalization charge in our Capital Markets business. On an adjusted basis, 2018 net income from continuing operations was $34.8 million compared with net income of $21.6 million in 2017.
Total revenues from continuing operations increased 15% in 2018 compared with 2017 primarily due to higher investment banking fees, which increased 46% on stronger client activity in cannabis, blockchain and energy sectors. Higher interest revenue in 2018 compared with the same period a year ago also contributed to the increase.
Underwriting and M&A revenue both rose during 2018; up 50% and 37%, respectively, compared with 2017. Interest revenue increased by 20% in 2018 compared with 2017 in connection with increased stock borrowing and lending activity. Principal transactions generated net losses of $0.5 million in 2018 compared with net losses of $1.2 million in 2017. This moderate improvement was largely due to higher returns on principal inventories acquired in connection with investment banking mandates, which was offset by higher losses in connection with client trade facilitation.
Partly offsetting these improvements were lower commission revenues, which decreased 25% compared with 2017 on lower client trading volumes.
Total expenses decreased 19% in 2018 compared with 2017, primarily due to the $52.0 million non-cash goodwill impairment charge recorded in 2017. Lower non-compensation expenses also contributed to the decrease. This decrease was partly offset by higher employee compensation and benefits expense.
Non-compensation expenses decreased 5% compared with 2017 largely due to lower trading-related costs amid weaker client trading activity and lower business development expenses, which were partly offset by higher interest expense in connection with increased stock borrowing and lending activity.
Employee compensation and benefits expenses increased by 18% compared with 2017. This increase was led largely by higher variable compensation, which was commensurate with stronger revenue generation, and $5.5 million in rationalization costs recorded in 2018 in our Capital Markets business. This increase was partly offset by lower share-based compensation in 2018 compared with 2017 primarily in connection with the expiration of certain incentive arrangements. Expenses also include the Transaction Shares3, which added $14.9 million and $13.3 million, respectively, to employee compensation and benefits in 2018 and 2017.
Share of net income of associate reflects our share of Richardson GMP’s net income attributable to common shareholders. For more information on Richardson GMP’s 2018 financial performance, refer to the “Supplemental Information” section within this MD&A.Discontinued Operations
Net loss from discontinued operations was $12.6 million in 2018 compared with a net loss of $2.8 million in the prior year. The decrease relates largely to lower U.S. client-related fixed income trading activity and higher expenses, including a goodwill impairment of $2.4 million, other asset impairments and provisions of $2.7 million, and transaction related costs of $1.3 million.
3. On September 30, 2016, GMP completed the acquisition of FirstEnergy Capital Holdings Corp. (FirstEnergy). GMP acquired all of the outstanding equity securities of FirstEnergy and issued 11.2 million Common Shares to former FirstEnergy shareholders, with the balance of the consideration to be paid in the form of a promissory note (Buyer Note). Approximately two-thirds of the Common Shares issued are subject to an escrow agreement to be released over a four-year period pursuant to the terms of a purchase agreement (Transaction Shares).DIVIDENDS
On February 28, 2019, the board of directors of GMP approved a quarterly cash dividend of $0.2257 per Cumulative 5-Year Rate Reset Preferred Share, Series B, and $0.2837 per Cumulative Floating Rate Preferred Shares, Series C, each payable on
April 1, 2019, to preferred shareholders of record on March 15, 2019.
On February 28, 2019, the board of directors also declared a regular quarterly cash dividend of $0.025 per common share, payable on April 1, 2019, to common shareholders of record on March 15, 2019.
CONFERENCE CALL
A conference call and live audio webcast to discuss GMP’s fourth quarter and fiscal 2018 results will be held this morning at 10:00 a.m. (ET). Interested parties are invited to access the quarterly conference call on a listen-only basis by dialing 647-484-0477 or 1-866-548-4713 (toll-free) or via live audio webcast at www.gmpcapital.com/Investor-Relations/Quarterly-Information. A recording of the conference call will be available until Friday, March 8, 2019, by dialing 905-694-9451 or 1-800-408-3053 (toll-free). The passcode is 9173661#. The webcast will be archived at www.gmpcapital.com/Investor-Relations/Quarterly-Information.
NON-GAAP MEASURES
We use certain measures to assess our financial performance that are not GAAP measures under IFRS. These measures do not have any standardized meaning prescribed by GAAP and are therefore unlikely to be comparable to similar measures presented by other issuers. Non-GAAP measures should not be considered as alternatives to net income or comparable metrics determined in accordance with IFRS as indicators of GMP’s performance, liquidity, cash flows, and profitability. For further information, refer to the “Presentation of Financial Information and Non-GAAP Measures” section in the 2018 Annual MD&A.
The following table provides a reconciliation of GMP’s reported results to its adjusted measures including the composition of the adjusted measures for the periods presented.
SUPPLEMENTAL INFORMATION – RICHARDSON GMP
The following supplemental information reflects how Richardson GMP’s management assesses the financial performance of Richardson GMP.
Richardson GMP’s management assesses performance on both a reported and an adjusted basis and considers both bases to be useful in assessing underlying, ongoing business performance. Presenting results on both bases also permits readers to assess the impact of specified items on financial results. Richardson GMP’s management uses certain measures to assess the financial performance of Richardson GMP that are not GAAP measures under IFRS. EBITDA and adjusted EBITDA do not have any standardized meaning prescribed by GAAP and are therefore unlikely to be comparable to similar measures presented by other issuers. These Non-GAAP measures should not be considered as alternatives to net income or comparable metrics determined in accordance with IFRS as indicators of Richardson GMP’s performance, liquidity, cash flows, and profitability. Richardson GMP’s management believes adjusting results by excluding the impact of the specified items is more reflective of ongoing financial performance and cash generating capabilities and provides readers with an enhanced understanding of how management views Richardson GMP’s core performance. For further information, refer to the “Supplemental Information” section in the 2018 Annual MD&A.
The following table sets forth an overview of the consolidated financial results of Richardson GMP for the periods indicated, on a 100% basis; noting, however, that GMP owns an approximate 33% non-controlling interest of Richardson GMP as at December 31, 2018:
FORWARD-LOOKING INFORMATION
This press release contains “forward-looking information” as defined under applicable Canadian securities laws. This information includes, but is not limited to, statements concerning our objectives, our strategies to achieve those objectives, as well as statements made with respect to management’s beliefs, plans, estimates, projections and intentions, and similar statements concerning anticipated future events, results, circumstances, performance or expectations that are not historical facts. Specifically, this press release contains forward-looking information concerning GMP’s response to industry conditions, expectations regarding operating leverage, actions ensuring feasibility and enhanced competitive positioning. Forward-looking information generally can be identified by the use of forward-looking terminology such as “outlook”, “objective”, “may”, “will”, “expect”, “intend”, “estimate”, “anticipate”, “believe”, “should”, “plans” or “continue”, or similar expressions suggesting future outcomes or events. Such forward-looking information reflects management’s current beliefs and is based on information currently available to management.
Forward-looking information is not a guarantee of future performance and is subject to numerous risks and uncertainties, including those described in this press release. GMP’s primary business activities are both competitive and subject to various risks. These risks include market, credit, liquidity, operational, legal and regulatory risks and other risk factors including, without limitation: variation in the market value of securities, volatility and liquidity of equity trading markets, volume of new financings and mergers and acquisitions (M&A), dependence on key personnel, and sustainability of fees. Other factors, such as general economic conditions, including interest rate and exchange rate fluctuations and resource commodity prices, may also have an effect on GMP’s results of operations. Many of these risks and uncertainties can affect GMP’s actual results and could cause its actual results to differ materially from those expressed or implied in any forward-looking information disclosed by management or on its behalf. For a description of additional risks that could cause our actual results to materially differ from our current expectations, see “Risk Management” and “Risk Factors” in the 2018 MD&A and “Risk Factors” in GMP’s annual information form. These risks and uncertainties are not the only ones facing GMP. Additional risks and uncertainties not currently known to us or that we currently consider immaterial, may also impair the operations of GMP. Although forward-looking information contained in this press release is based upon what management believes are reasonable assumptions, there can be no assurance that actual results will be consistent with this forward-looking information. Certain statements included in this press release may be considered a “financial outlook” for purposes of applicable Canadian securities laws and, as such, the financial outlook may not be appropriate for purposes other than this press release. The forward-looking information contained in this press release is made as of the date of this press release, and should not be relied upon as representing GMP’s views as of any date subsequent to the date of this press release.
Except as required by applicable law, management and the Board of Directors undertake no obligation to publicly update or revise any forward-looking information, whether as a result of new information, future events or otherwise. ABOUT GMP CAPITAL INC.
GMP is a leading independent diversified financial services firm headquartered in Toronto, Canada, providing a wide range of financial products and services to a global client base that includes corporate clients, institutional investors and high-net-worth individuals in two integrated reporting segments. The Capital Markets segment provides investment banking, including advisory and underwriting services, institutional sales and trading and research through offices in Canada, the United Kingdom, and the Bahamas. Wealth Management consists of GMP’s non-controlling ownership interest in Richardson GMP Limited. Richardson GMP Limited, Canada’s largest independent wealth management firm, is focused on providing exclusive and comprehensive wealth management and investment services delivered by an experienced team of investment professionals. GMP is listed on the Toronto Stock Exchange under the symbol “GMP”. For further information, please visit our corporate website at gmpcapital.com.
FURTHER INFORMATION CONTACT:
GMP Capital Inc.
Rocco Colella, Director, Investor Relations
145 King Street West, Suite 300, Toronto, Ontario M5H 1J8
Tel: (416) 941-0894; Fax: (416) 943-6175
[email protected] or [email protected]