
February 2023.
Investor Strategy.
Executive summary
- January in full effect
- Rent this rally, don’t buy it
- Market cycle
- Earnings – unfounded worries
- Japan trip #2
- Getting real with inflation
January in full effect
Looking at monthly performance, January has historically shown good returns, hence the term ‘January Effect’. This January was no exception. Both bond and equity markets started the year on strong footing as signs that inflation may be cooling helped boost investor sentiment. North American equities made robust gains in January with the S&P/TSX up 7.4% and the S&P 500 up 6.3% in local terms over the month. In an attempt to correct pandemic excesses and boost earnings, tech companies continued to slash jobs throughout the month. Investors appeared encouraged by the moves, helping the Nasdaq to finish 10.7% higher for the month and register its best January since 1999. Emerging markets also benefited from January’s risk-on sentiment. China’s end to its zero-Covid policy, easing of regulatory pressures, increased policy support for the real estate sector, and better-than-expected Q4 GDP growth helped propel emerging market equities.
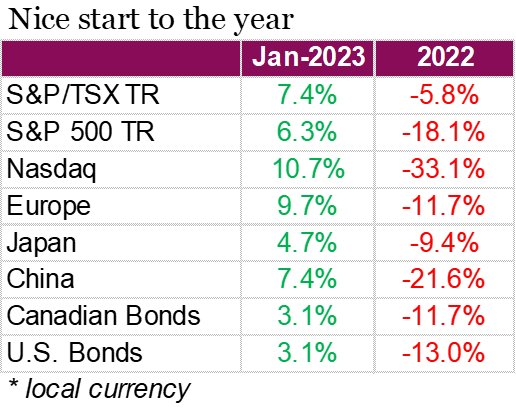
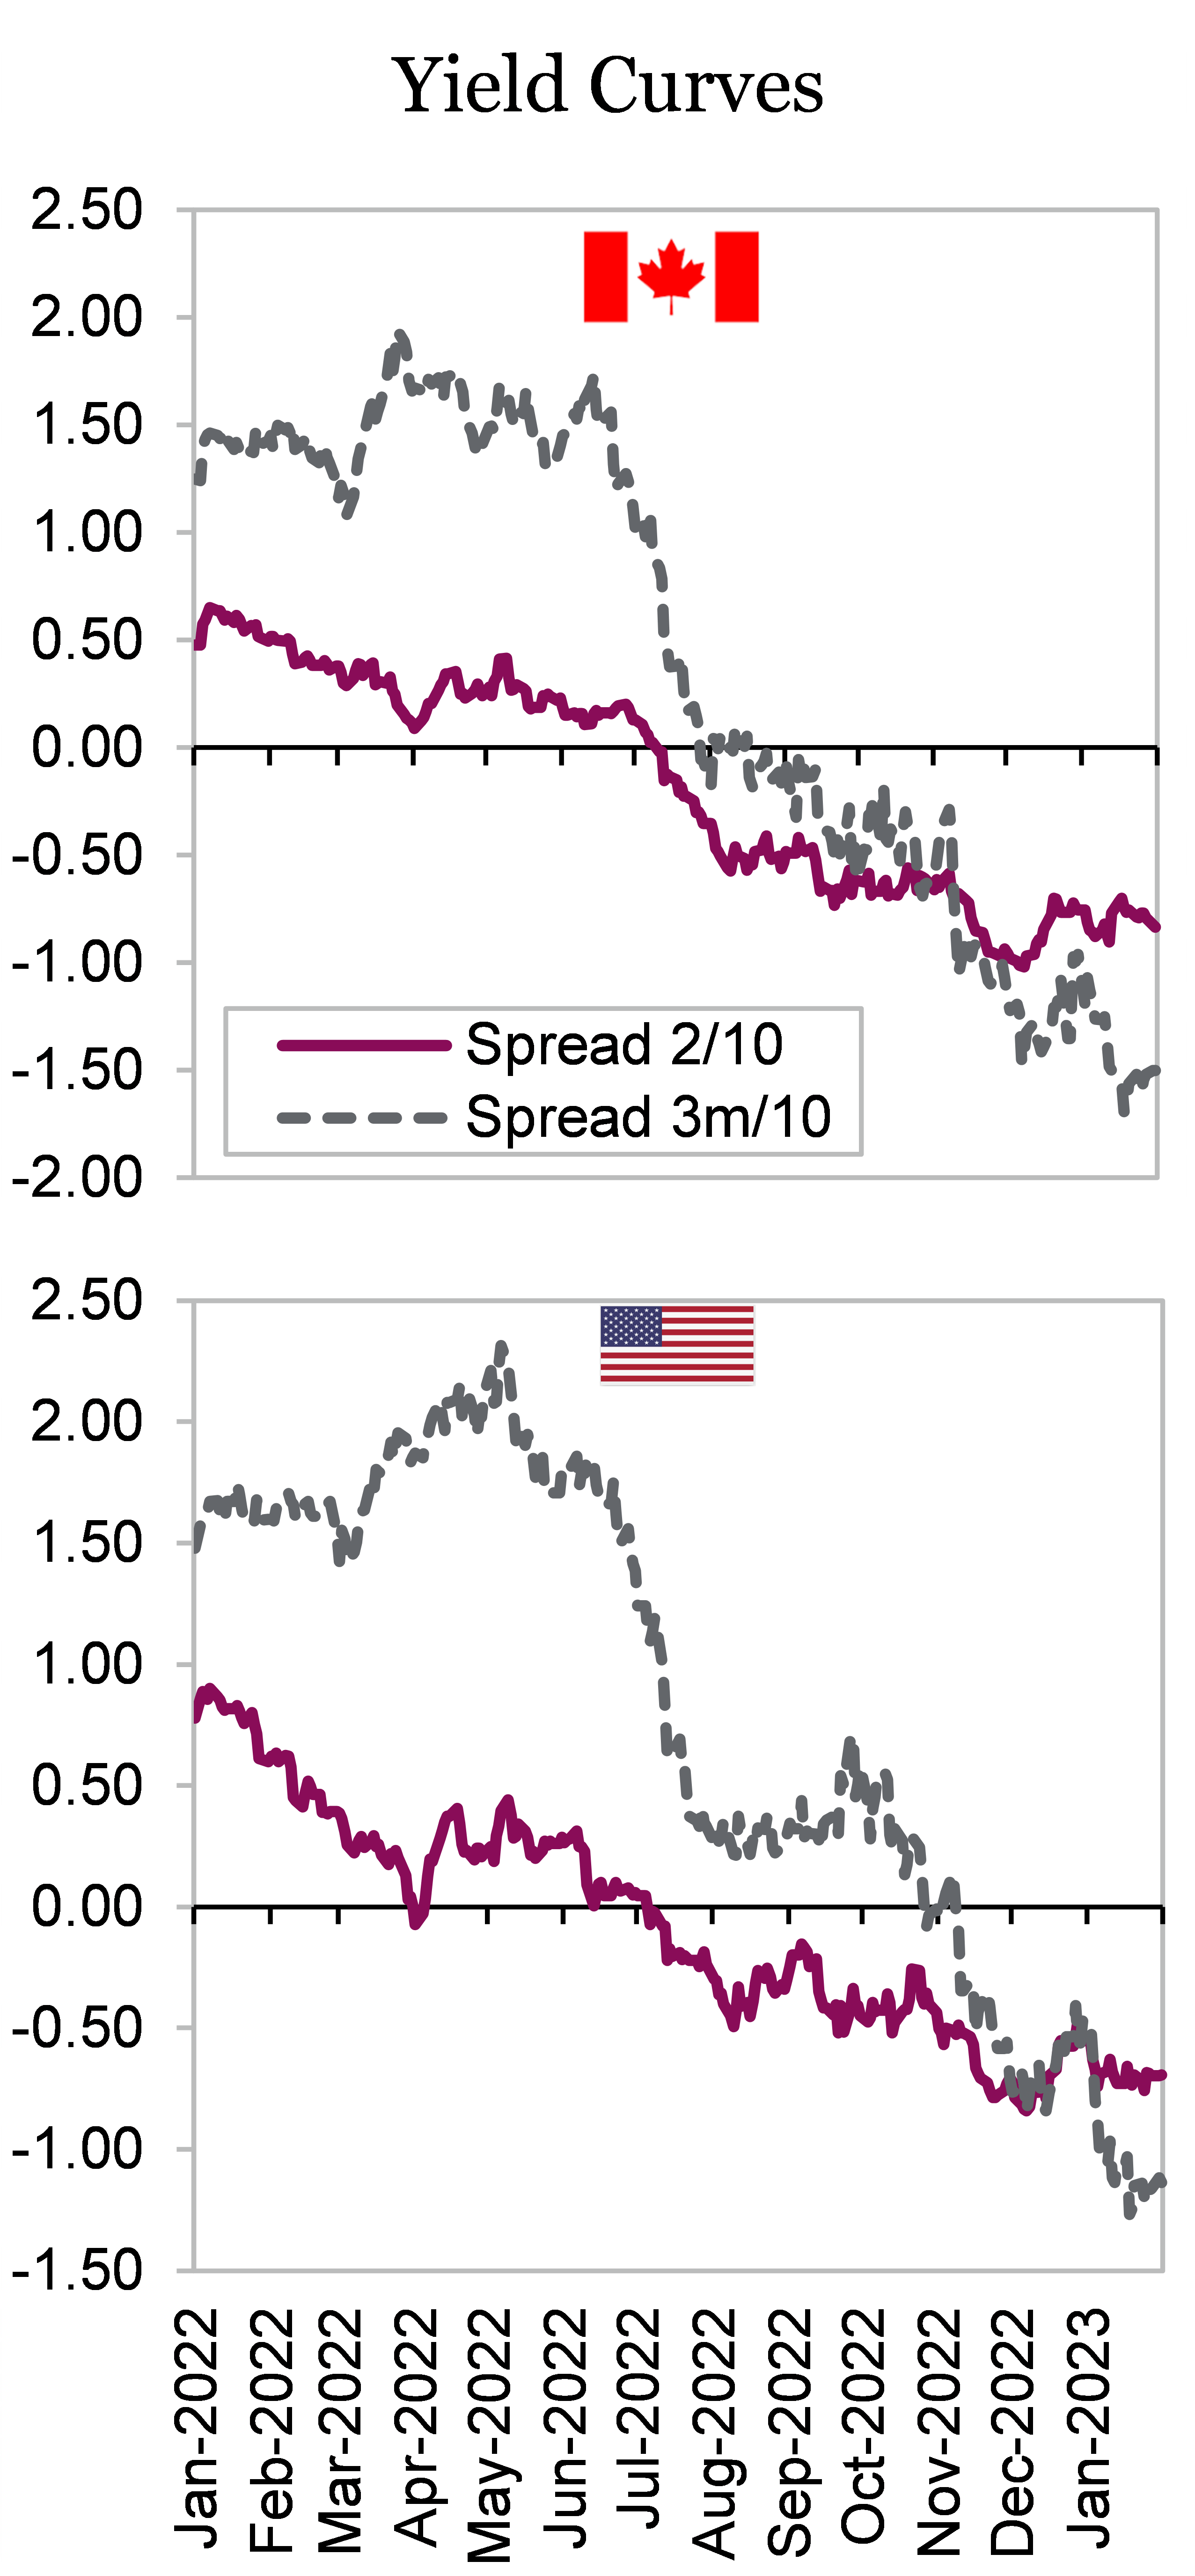
Investors have become encouraged by signs that inflation continues to decline, increasing speculation that central bank’s aggressive interest rate hike campaigns may soon be coming to an end. Policy meetings from major central banks did not come with any surprises, signaling the era of jumbo-sized rate hikes may soon be over. The Bank of Canada raised rates by 25 bps as expected and more importantly, added that it expects to hold the policy rate at its current level while it assesses the impact of its increases to date. The Fed also alluded that they are approaching an appropriate level at which to pause after raising rates by 25 bps. Following these dovish comments, bond yields fell, helping both the U.S. and Canada bond indexes, rising 3.1% for the month. Although the downward trajectories of the yield curve inversions have flattened out, they still remain deeply in the negative zone.
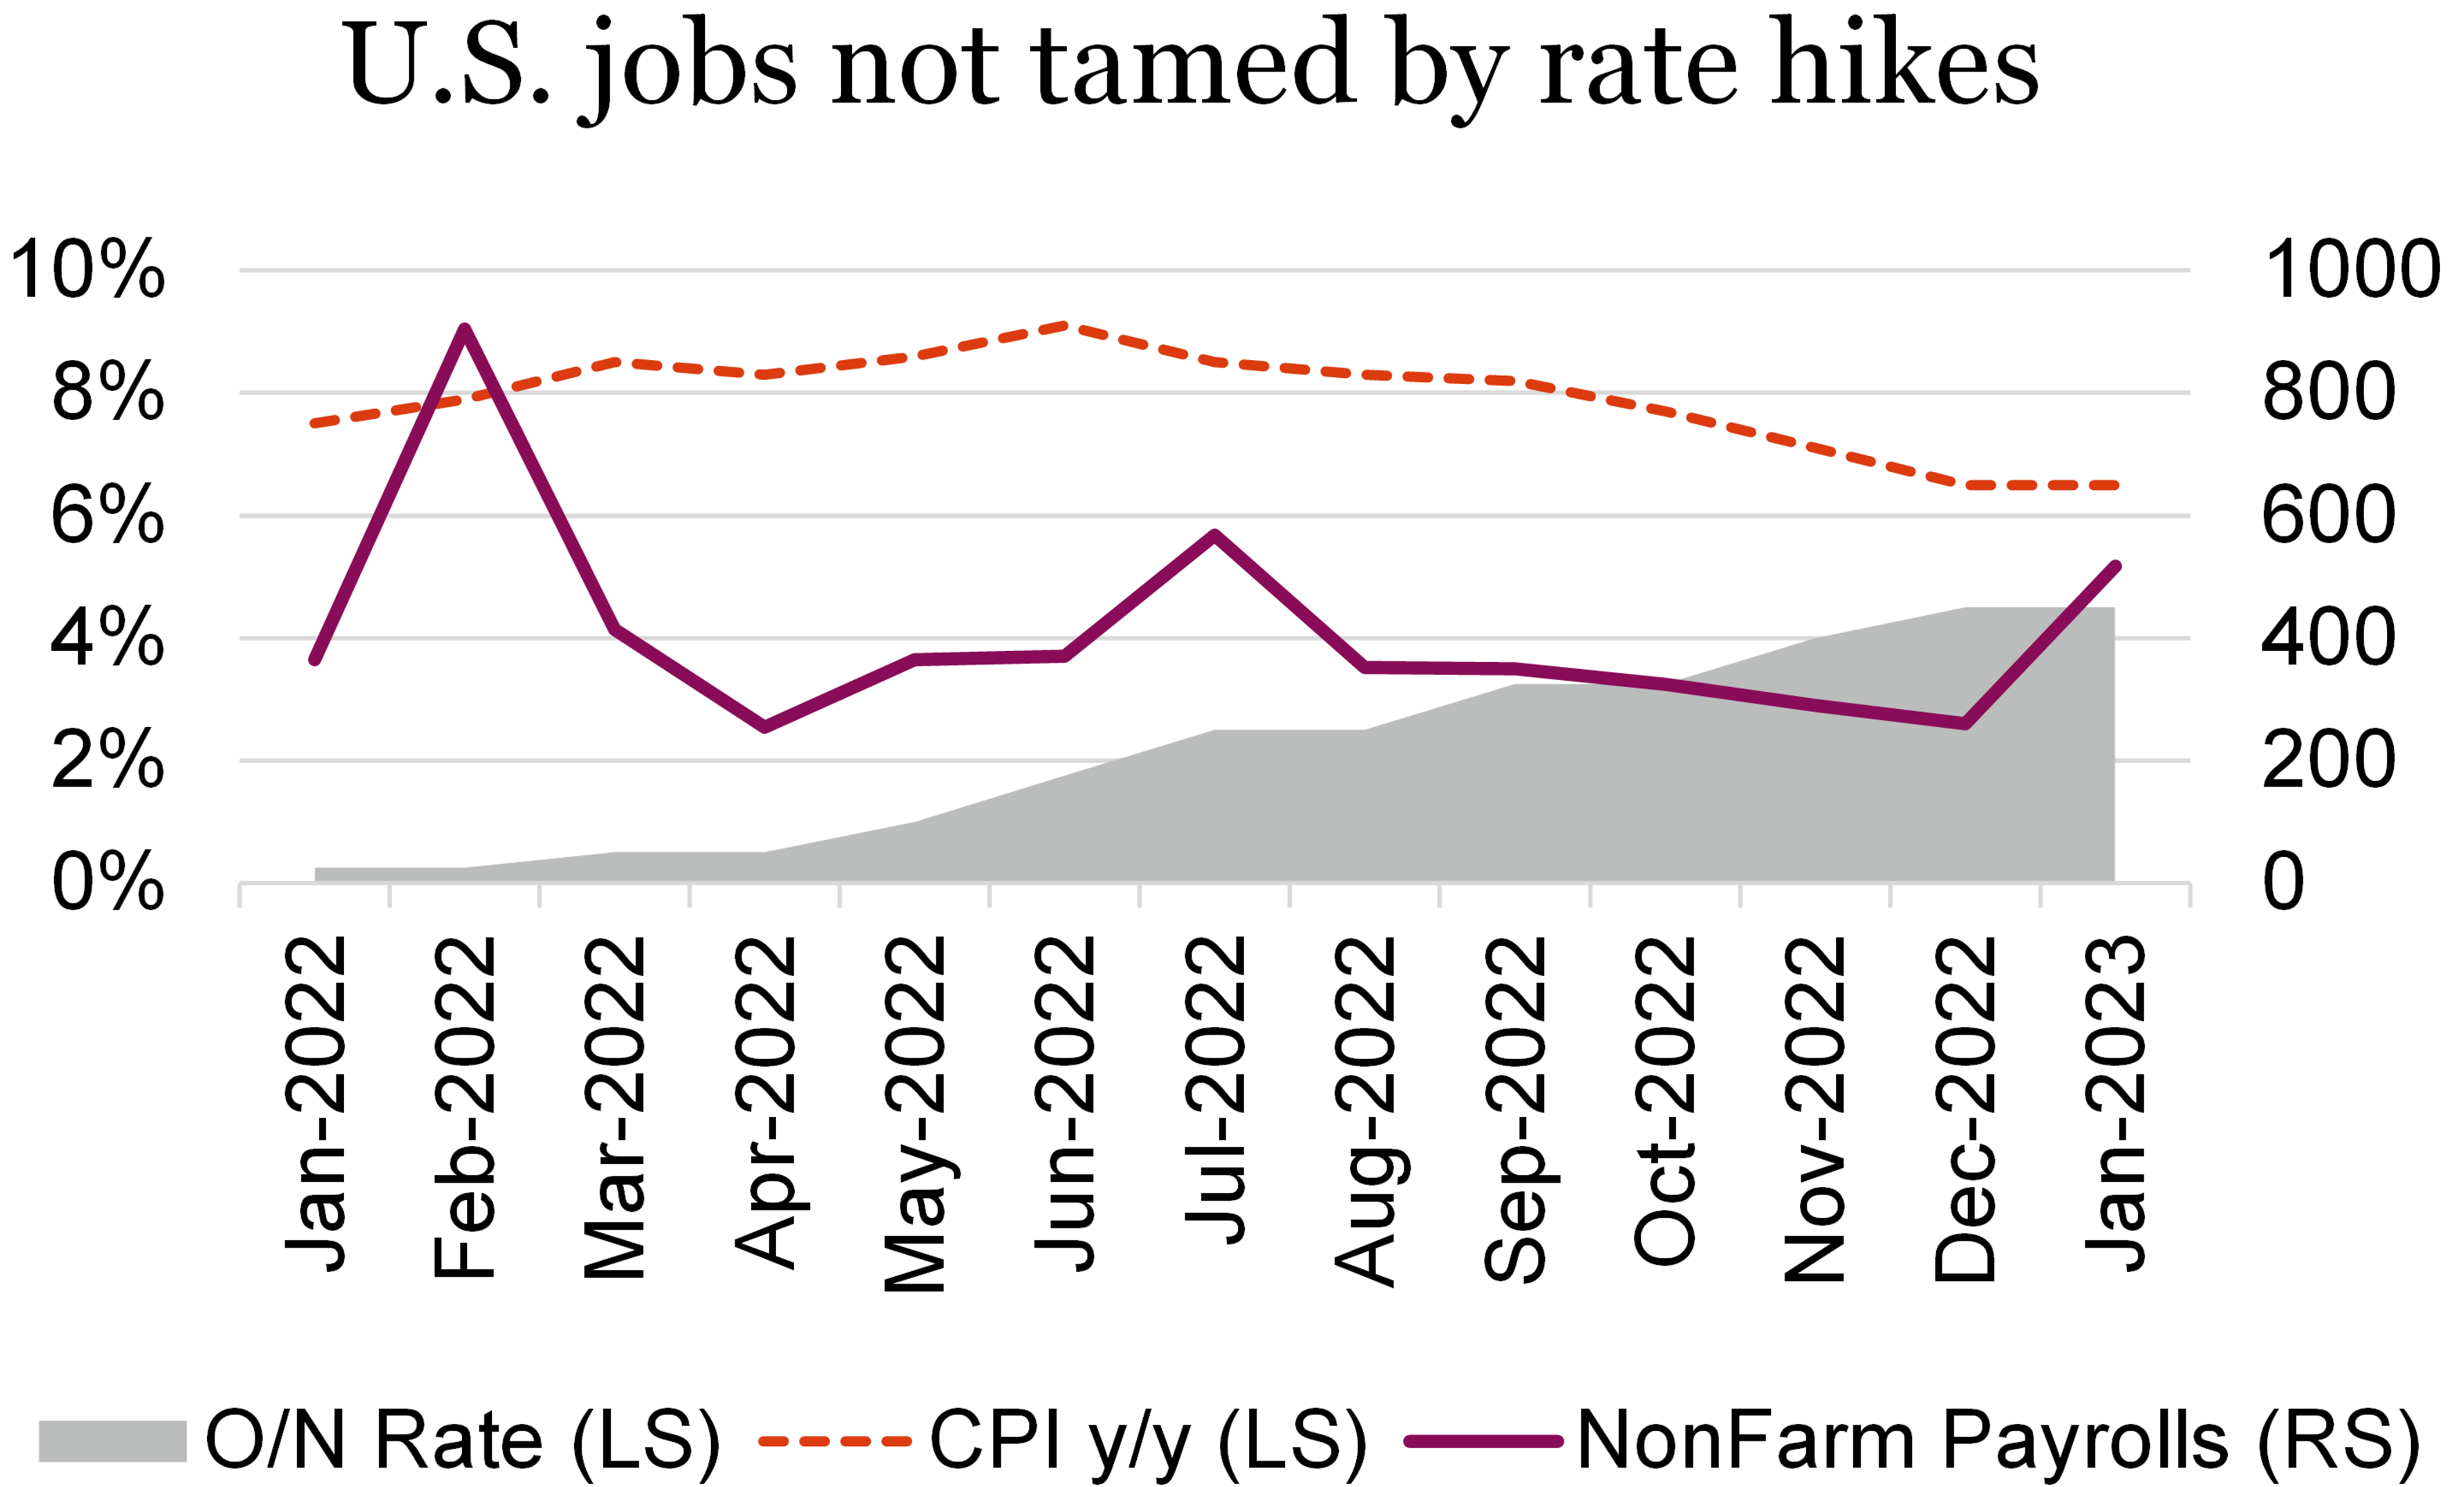
Data released this month showed real GDP in Canada rising 0.1% month over month in November, while preliminary estimate show no change in December’s GDP. The figures signal that momentum is slowing, and that the BoC may be able to achieve a soft landing. While progress has certainly been made to tamp inflation, the BoC and other central banks still appear to have some work to do to get inflation to fall back to target levels. Central banks will need to see labour demand and supply come into balance, which remains the biggest headwind. Job openings data, the unemployment rate, and wage growth in both Canada and the U.S. continue to signal that the labour market is too tight.
Despite the euphoric January market performance, we are not out of the woods yet. There was some optimism with central banks signaling a slowdown of rising rates or even a pause but there is still a good amount of time needed for those policy effects to take place. Some may call it a relief rally, as a result of poor performance in 2022, and others may call it January Effect, whatever the case, the rally is likely to be short-lived and we are not buying into it.
Rent this rally, don’t buy it
2023 has started off with a bang, a good bang that is. After a tough 2022 which saw most asset classes including stocks and bonds moving lower, 2023 has started off on the right foot with stocks jumping higher and bonds moving up too. This is the sweet spot. Inflation has started to cool, emboldening some central banks to arrest their interest rate hiking ways that dominated 2022. The Bank of Canada hiked in January and announced a pause. The omni important Fed may be nearing this point as well. At the moment, the market is pricing in one or two more 25 bps hikes for the Fed.
Meanwhile, Q4 earnings are coming in reasonably well despite cooling predictions. The widely forecast deceleration of earnings growth remain elusive, but it is coming. Inflation is positive for corporate sales, which is starting to slow but remains positive. And while the economy is starting to slow, it remains decent with lingering tailwinds. China re-opening is helping as is Europe’s managing of their tight energy situation during the winter months. Put it together, the narrative around a soft landing has gained some traction.
![Stocks bounce back to start 2023
bonds recover too [aka yields down a bit]](https://richardsonwealth.com/wp-content/uploads/2023/02/Stocks-bounce-back-to-start-2023-bonds-recover-too-aka-yields-down-a-bit.png)
From our outlook 2023, so far this year is going according to expectations:
2023 should start off decently as inflation comes down a bit more, partially alleviating the markets’ biggest fear. Plus, a little January effect could certainly help. However, less inflation will start to accelerate slowing corporate earnings. And the wealth effect of falling equity/bond markets over the past year, plus delayed economic impact of rate hikes and higher yields will cause economic growth to fall significantly. This could trigger the final leg down of the bear and create the better buying opportunity, hopefully sometime in the first half of 2023, as the market begins to look through the trough and rally back to be positive on the year.
Enjoy this sweet spot as it is unlikely to last. Taking a step back from the month-to-month gyrations, inflation got out of control in 2022 which elicited a very aggressive response from central banks. The speed of rate hikes and the magnitude was breathtaking. This solution to inflation, hiking rates, works because it slows economic activity, with a delayed impact. We are now seeing inflation begin to soften and next the slowing economic growth should become increasingly evident. While a soft landing is not impossible, given global economic growth is coming down from a 5.8% pace in 2021, to 3% in 2022 to ?% in 2023 combined with this magnitude of rate hikes, it may be a long shot. This may harken to bulls-eyeing womp rats in a T-16.
Don’t mistake our tone for bearishness. We remain constructive for 2023, as it should be a better year than 2022. But don’t get too excited about the markets strong upward move out of the gates. This ‘inflation relief rally’ may have more to go but January is often an odd month due to tax losses, rebalancing and the often renewed optimism a new year brings for investors. The road ahead still has many challenging twists and turns likely in store. And given the size of the bounce, a twist to the downside keeps becoming more likely. Rent this rally, don’t buy it.
Market Cycle
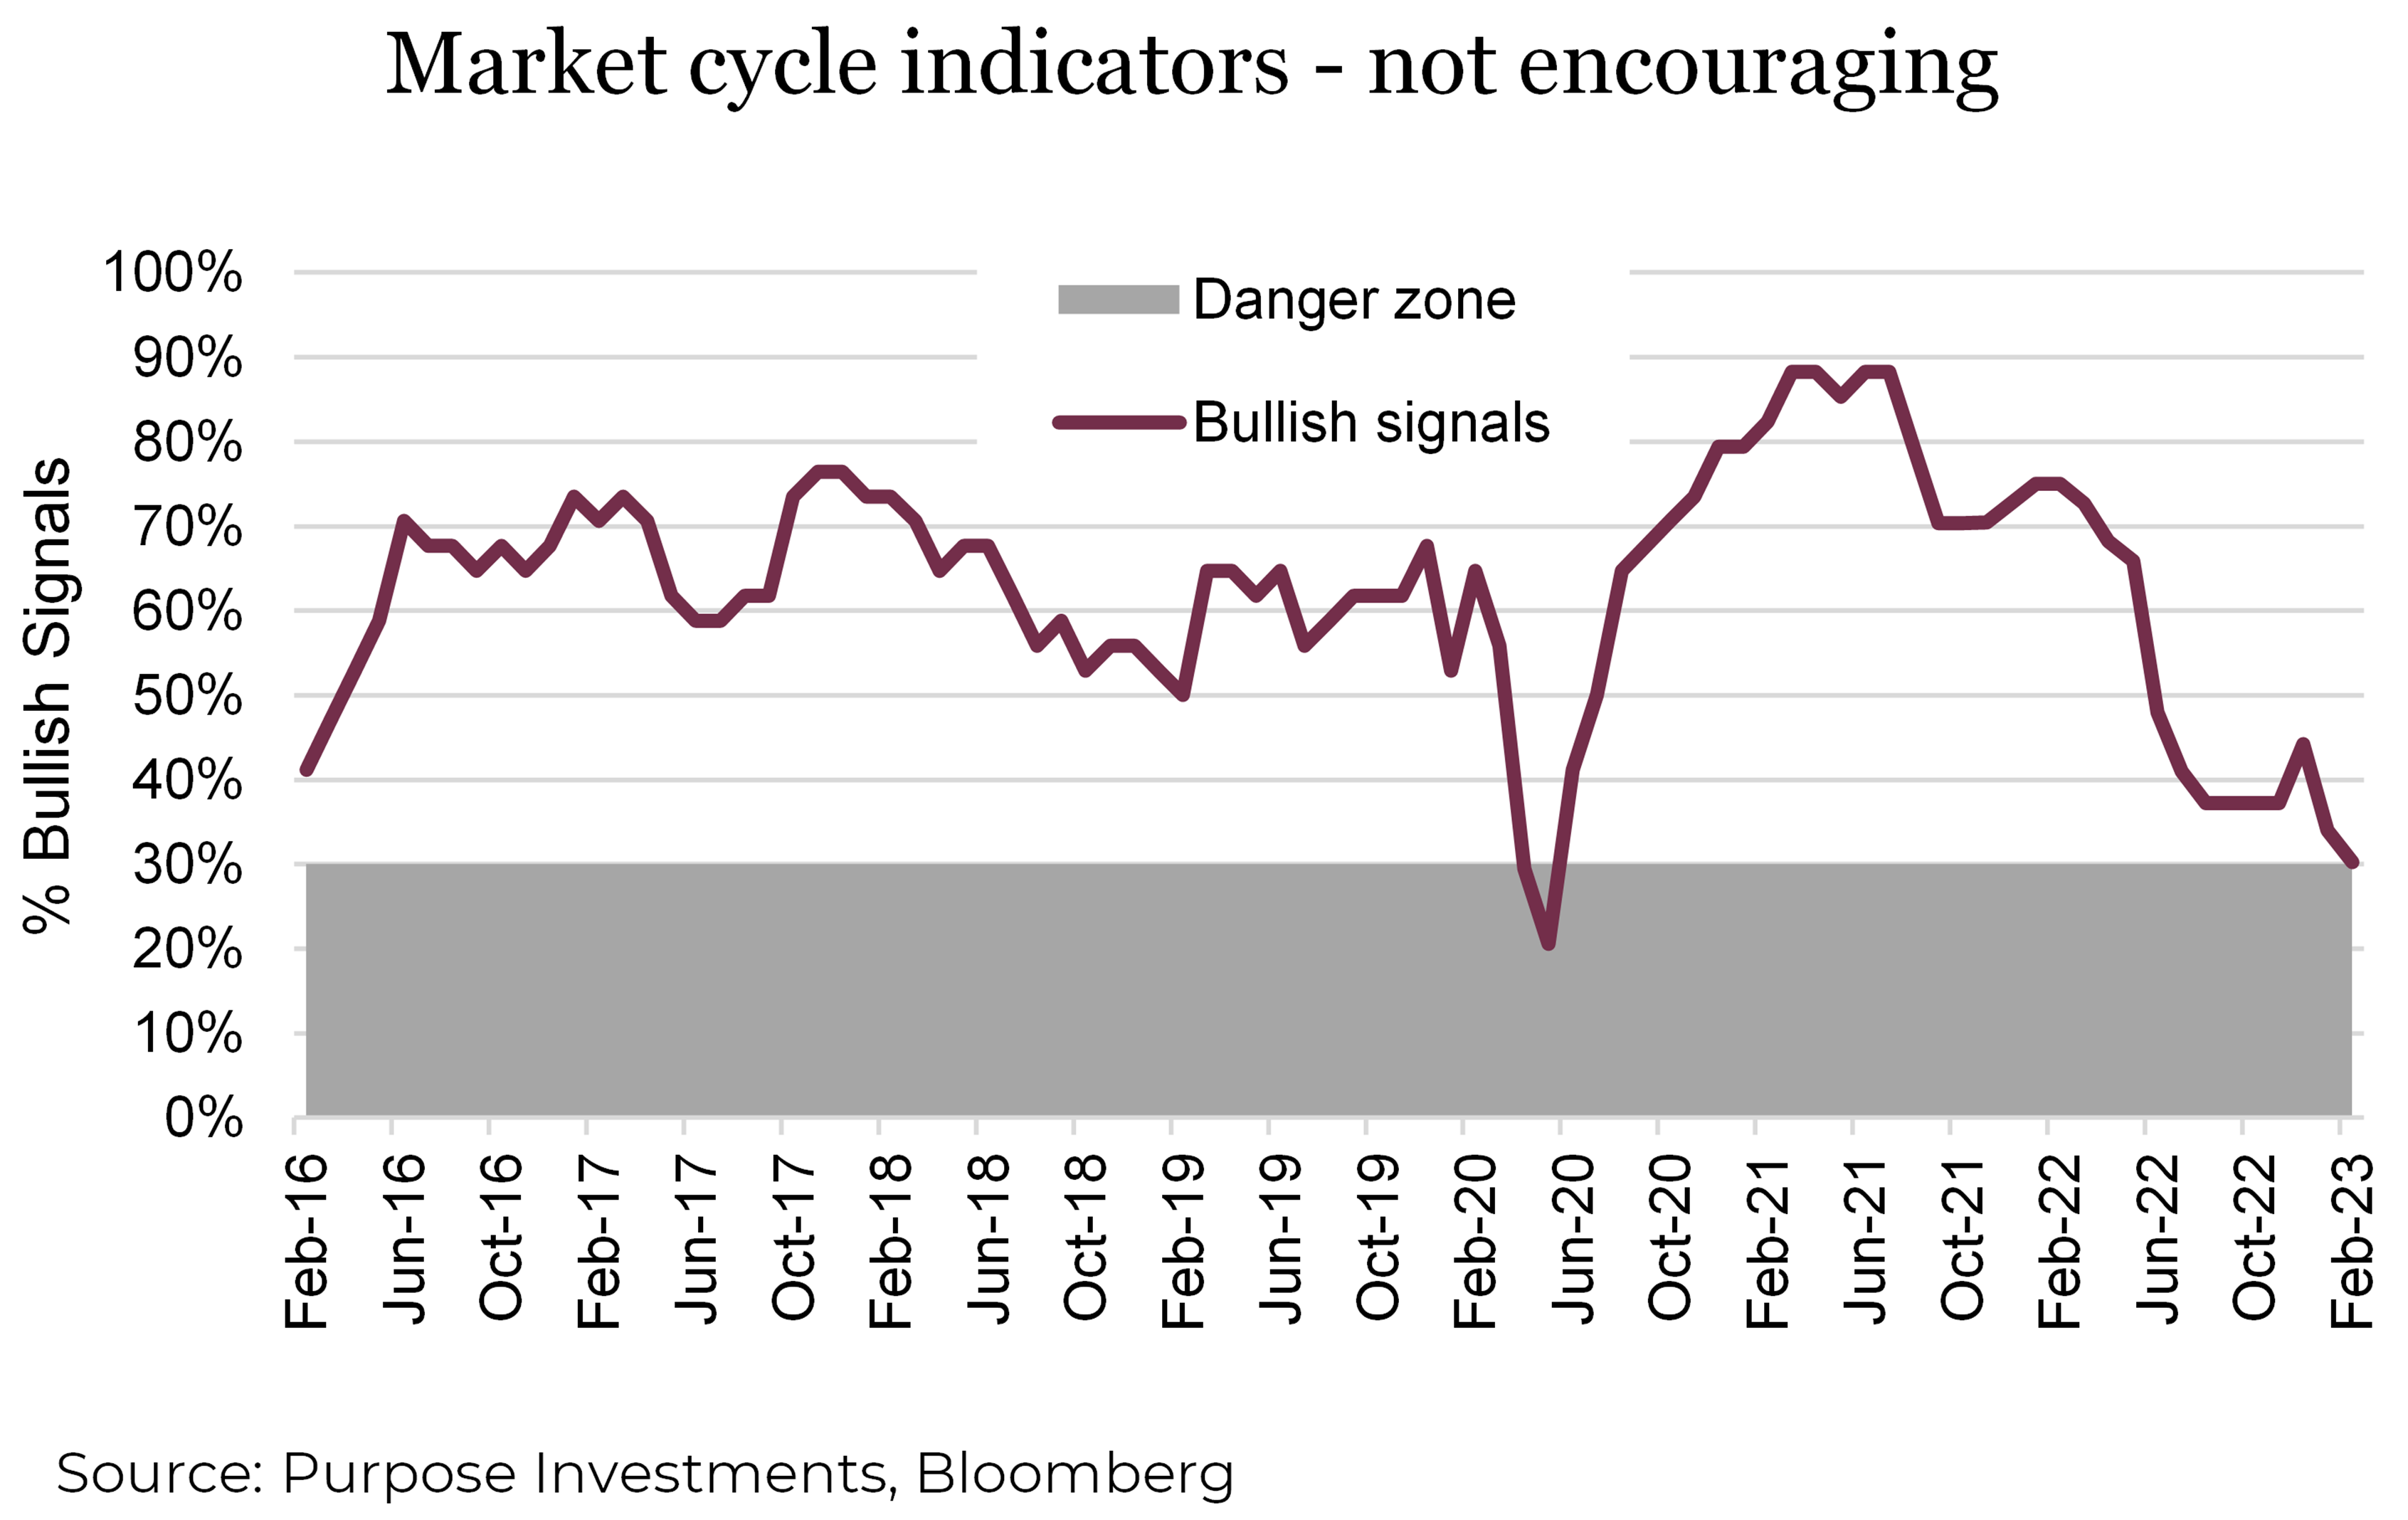
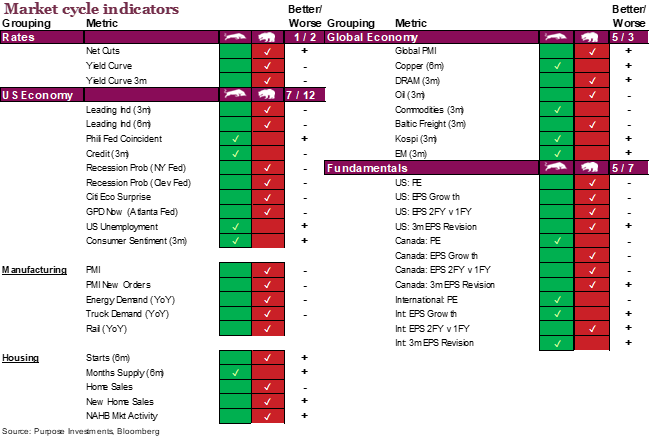
We have commented over the past few months that our Market Cycle indicators were hovering just above the danger zone and fully expected this metric to drop as fundamentals such as earnings and valuations weaken. That has started to come to fruition. Compared to last month one signal from both the U.S. economy and Global economy turned bearish. But the drop really came from ‘Fundamentals’ that dropped from a rating of 8 bullish out of a possible 12 to only 4 bullish. A rise in equity prices pushed some valuations from bullish to bearish. Meanwhile, earnings growth is slowing quickly in both Canada and the U.S. International fundamentals are still looking decent thanks to Europe managing the winter and China’s re-opening.
Earnings – unfounded worries
Fear of this earnings season has so far been misguided. So far, the current earnings season has not been as bad as feared, and markets have rallied in part because of this. We’re still seeing a solid number of companies reporting positive earnings surprises, yet we’d point out the decreasing magnitude compared to the past couple of years. To date, 251 S&P 500 companies have reported 4Q results. Reported sales growth has been 5.1% and earnings are down by -3.6% – surprising consensus estimates by +1.0% and +1.3% respectively. The average stock price rose +0.78% post-results.
Inflation helps with the top line, and companies have managed to control expenses thus far. Consumer Discretionary has been a recent outperformer with an average 12.2% earnings beat and an impressive average 2.2% move in the average stock price. Utilities have lagged, missing expectations on average and dropping over -2% post-results.
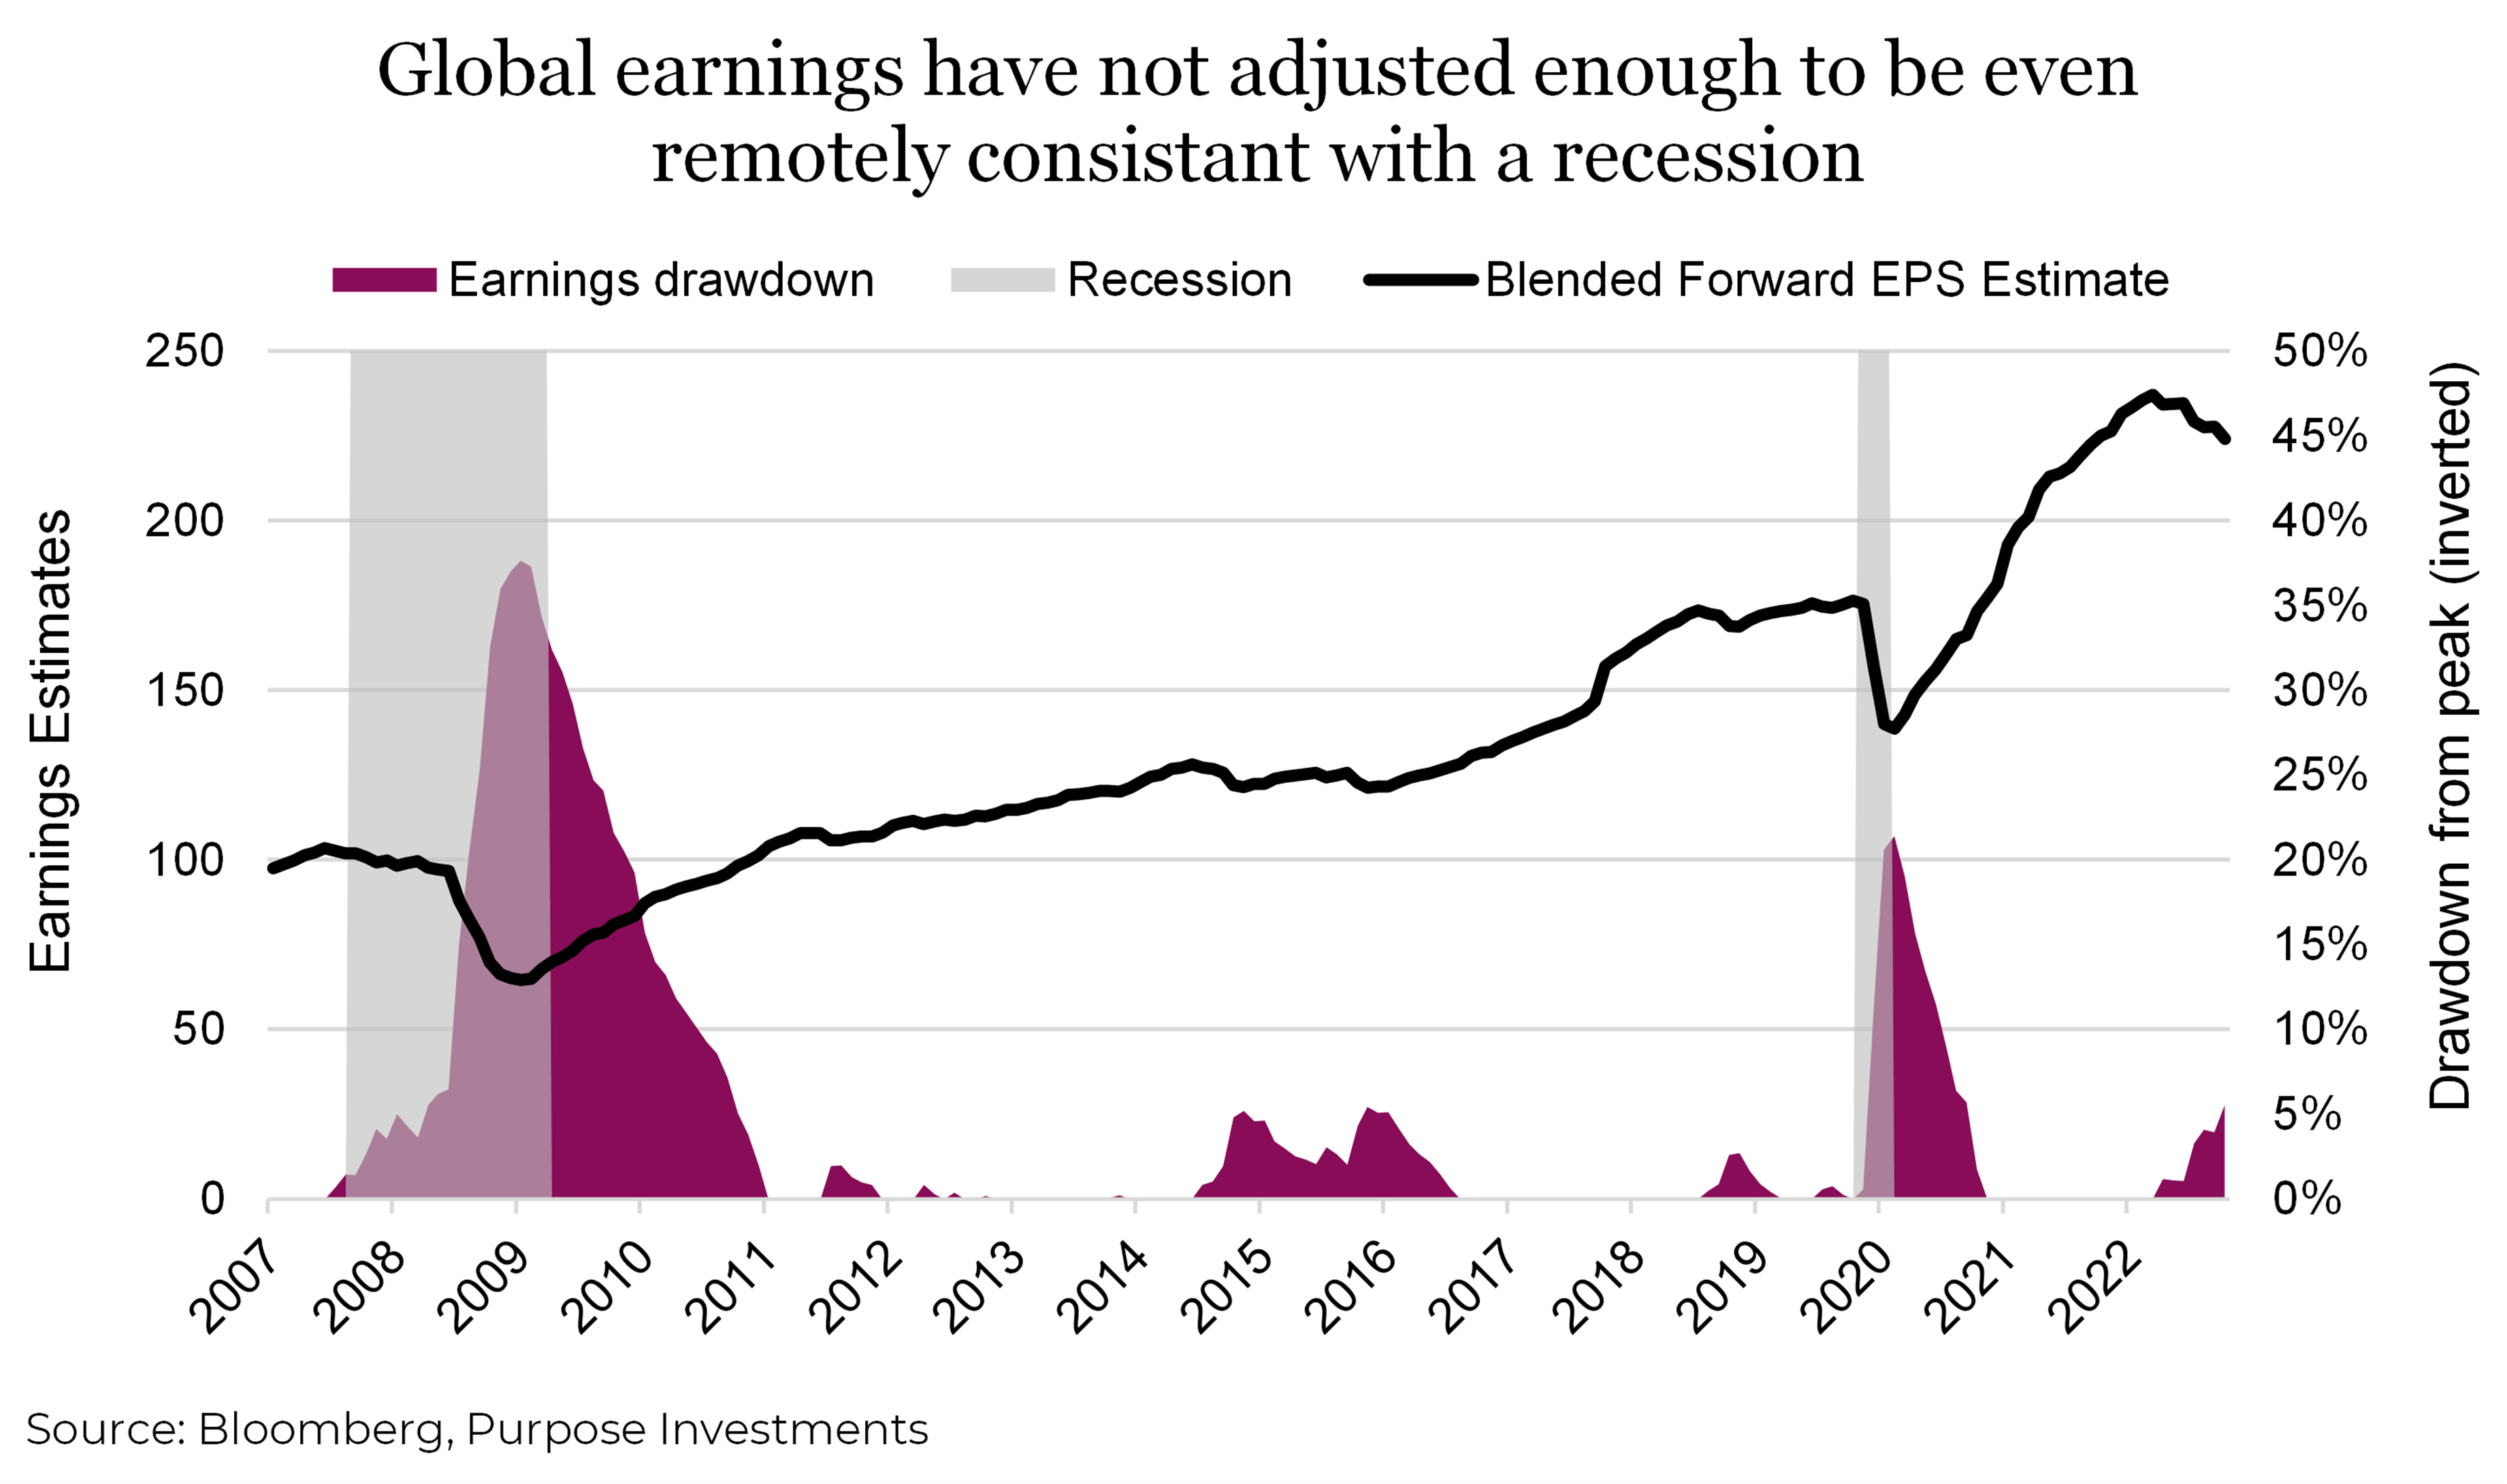
Nearly 30% of reported companies are reporting revenue declines and 35% have a decline in earnings. Those looking for a broad fundamental confirmation to drive the next leg higher for markets might have to look elsewhere. We continue to have concerns over the coming quarters for a continued deterioration in company fundaments. On the plus side, this earnings season has failed to give markets an excuse to resume their sell-off with companies mainly managing to moderately beat already lowered expectations. The chart below shows that the current expected earnings drawdown from the recent peak is around 6%. Not even remotely consistent with a recession scenario.
Looking ahead, analysts expect earnings declines for the first half of 2023, but earnings growth for the second half of 2023. For Q1 2023 and Q2 2023, analysts are projecting earnings declines of -5% and -4 %, respectively. In the back half of the year, projections are far more optimistic with Q3 2023 and Q4 2023, projected earnings growth of 3.93% and 8.2%, respectively.
Recessions are rarely reflected in forward estimates
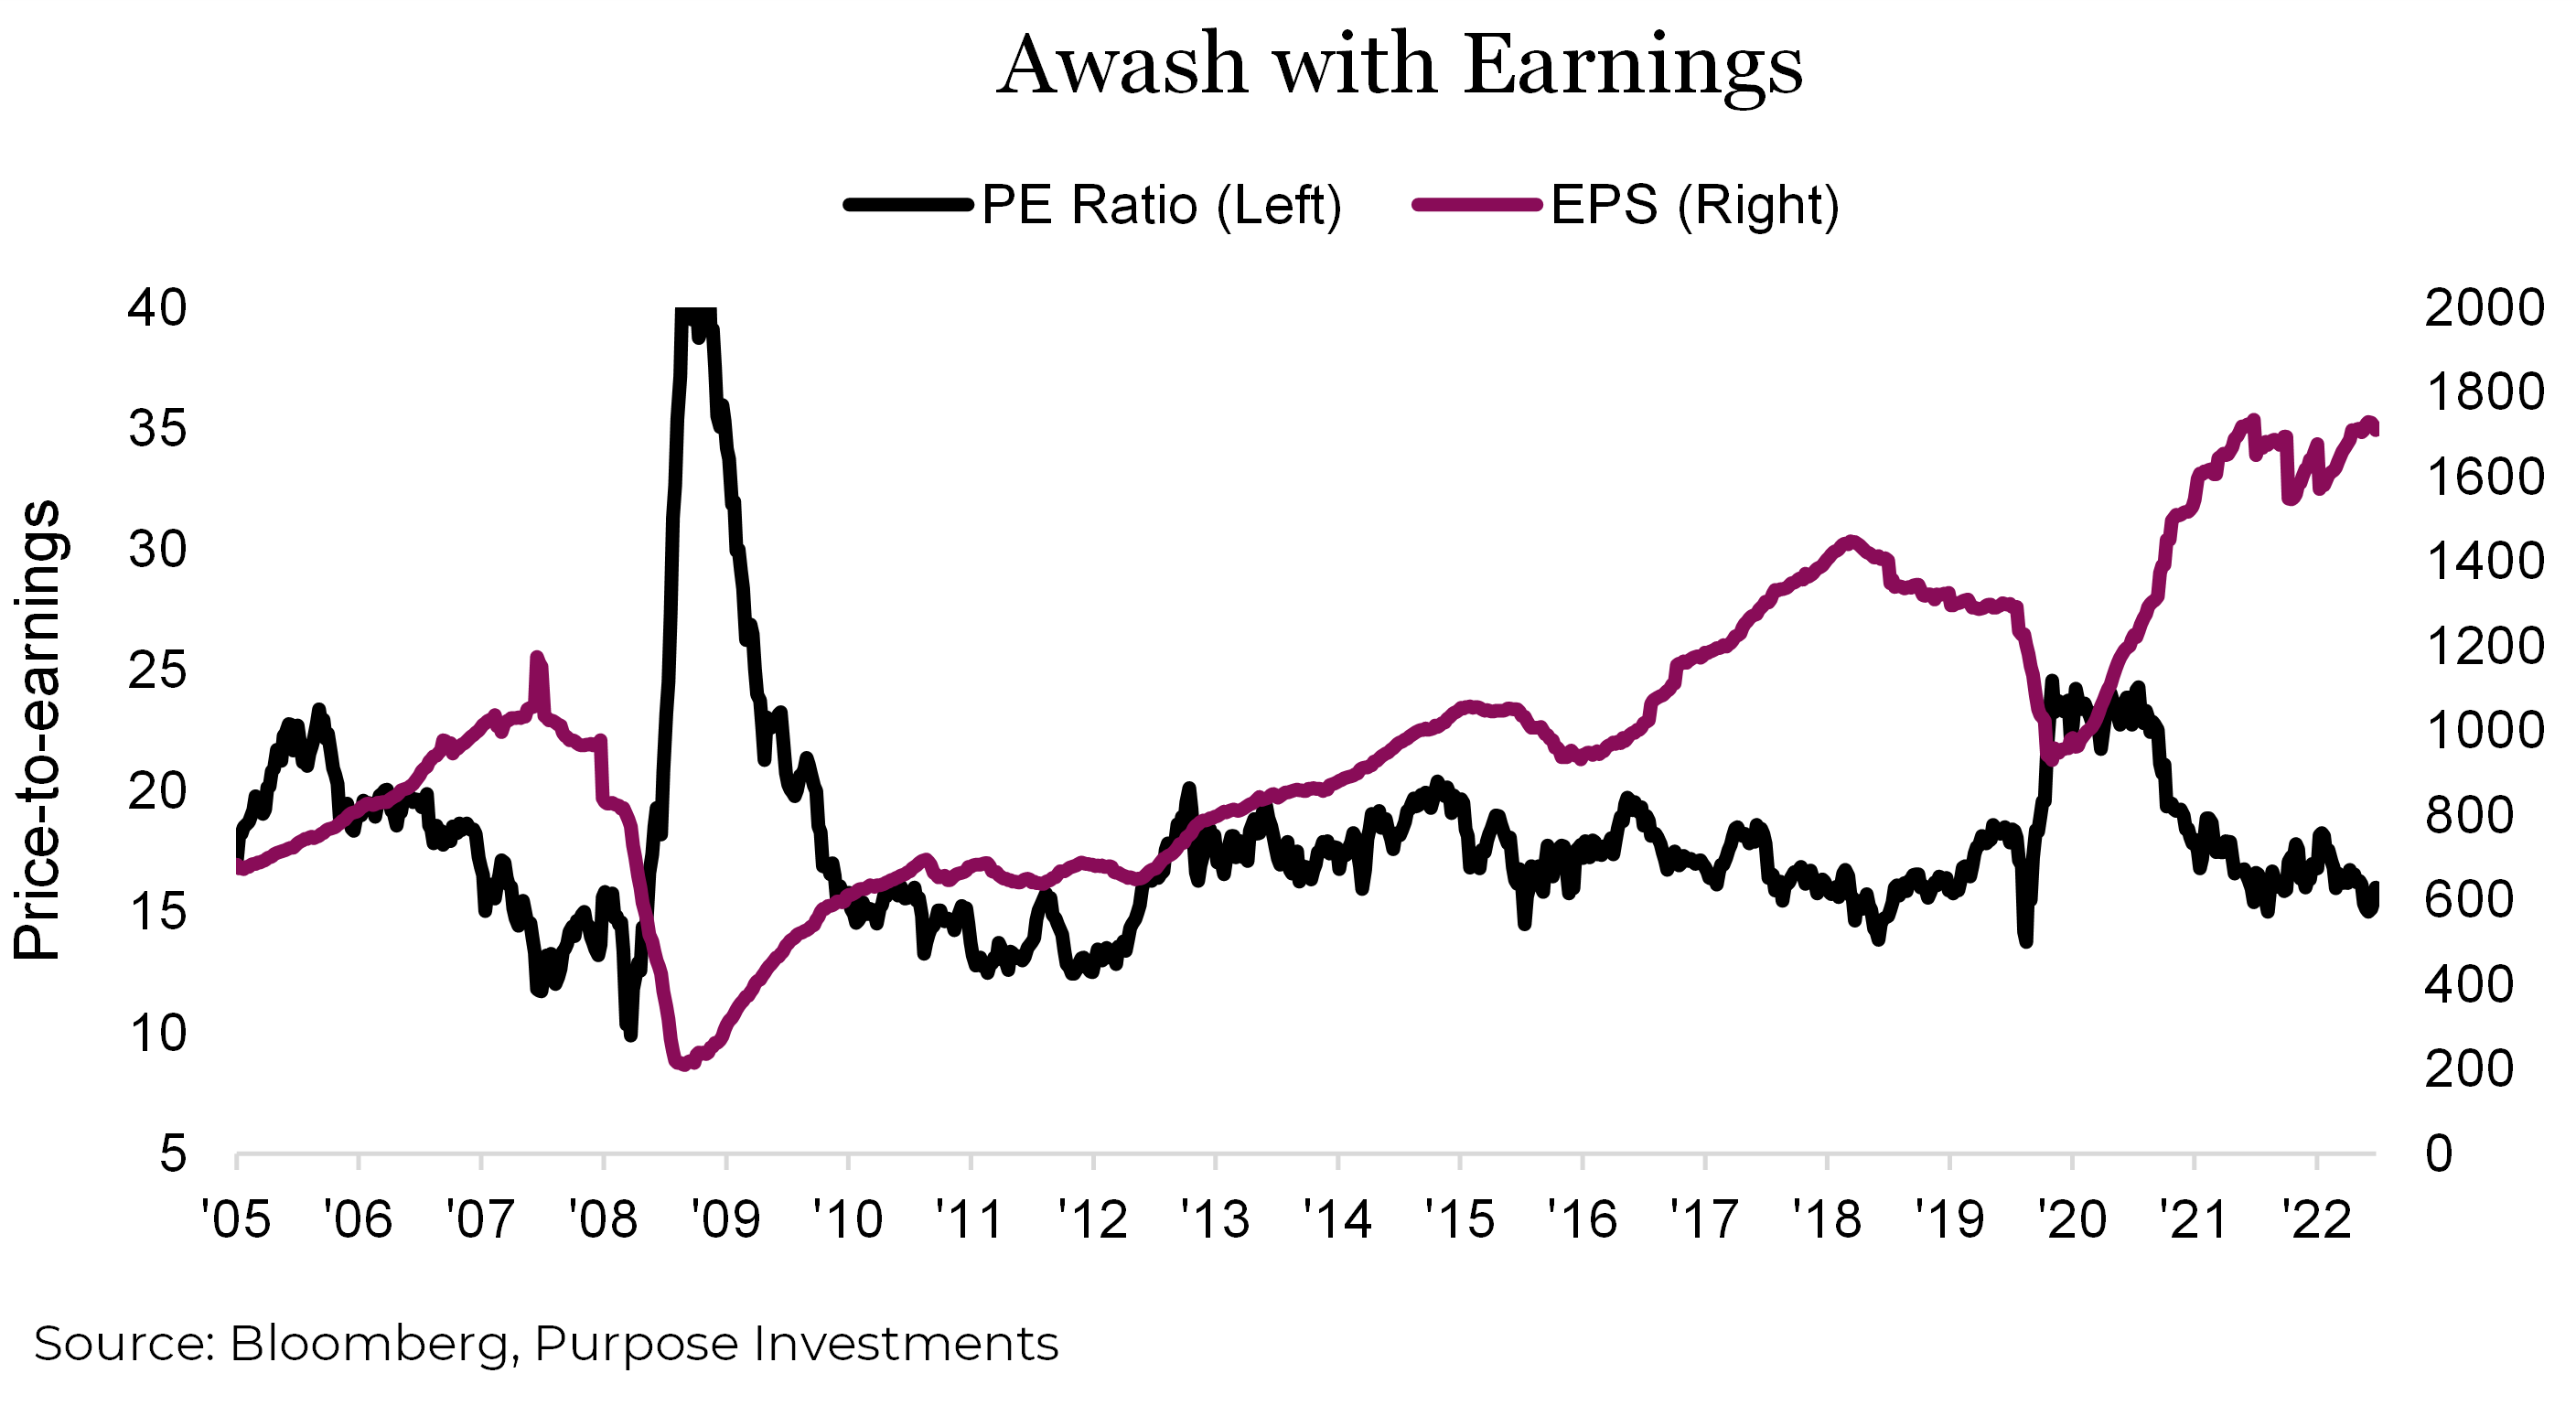
The forward price to earnings ratio for the S&P 500 stands at 18.6. It’s one of the most common valuation metrics to gauge how cheap or expensive the stock markets is. It’s based on consensus of forecasts from sell-side analysts for the coming 12 months. One of the big issues anytime you use consensus earnings forecasts is that they usually overstate expected earnings heading into a recession. Forward earnings estimates decline (-5% from peak currently) but underestimate the inevitable surprises that overwhelmingly tend to be negative. If as reported earnings for this year decline just 20% from 2022 levels (an average recession), then the PE ratio would be 22, hardly a bargain.
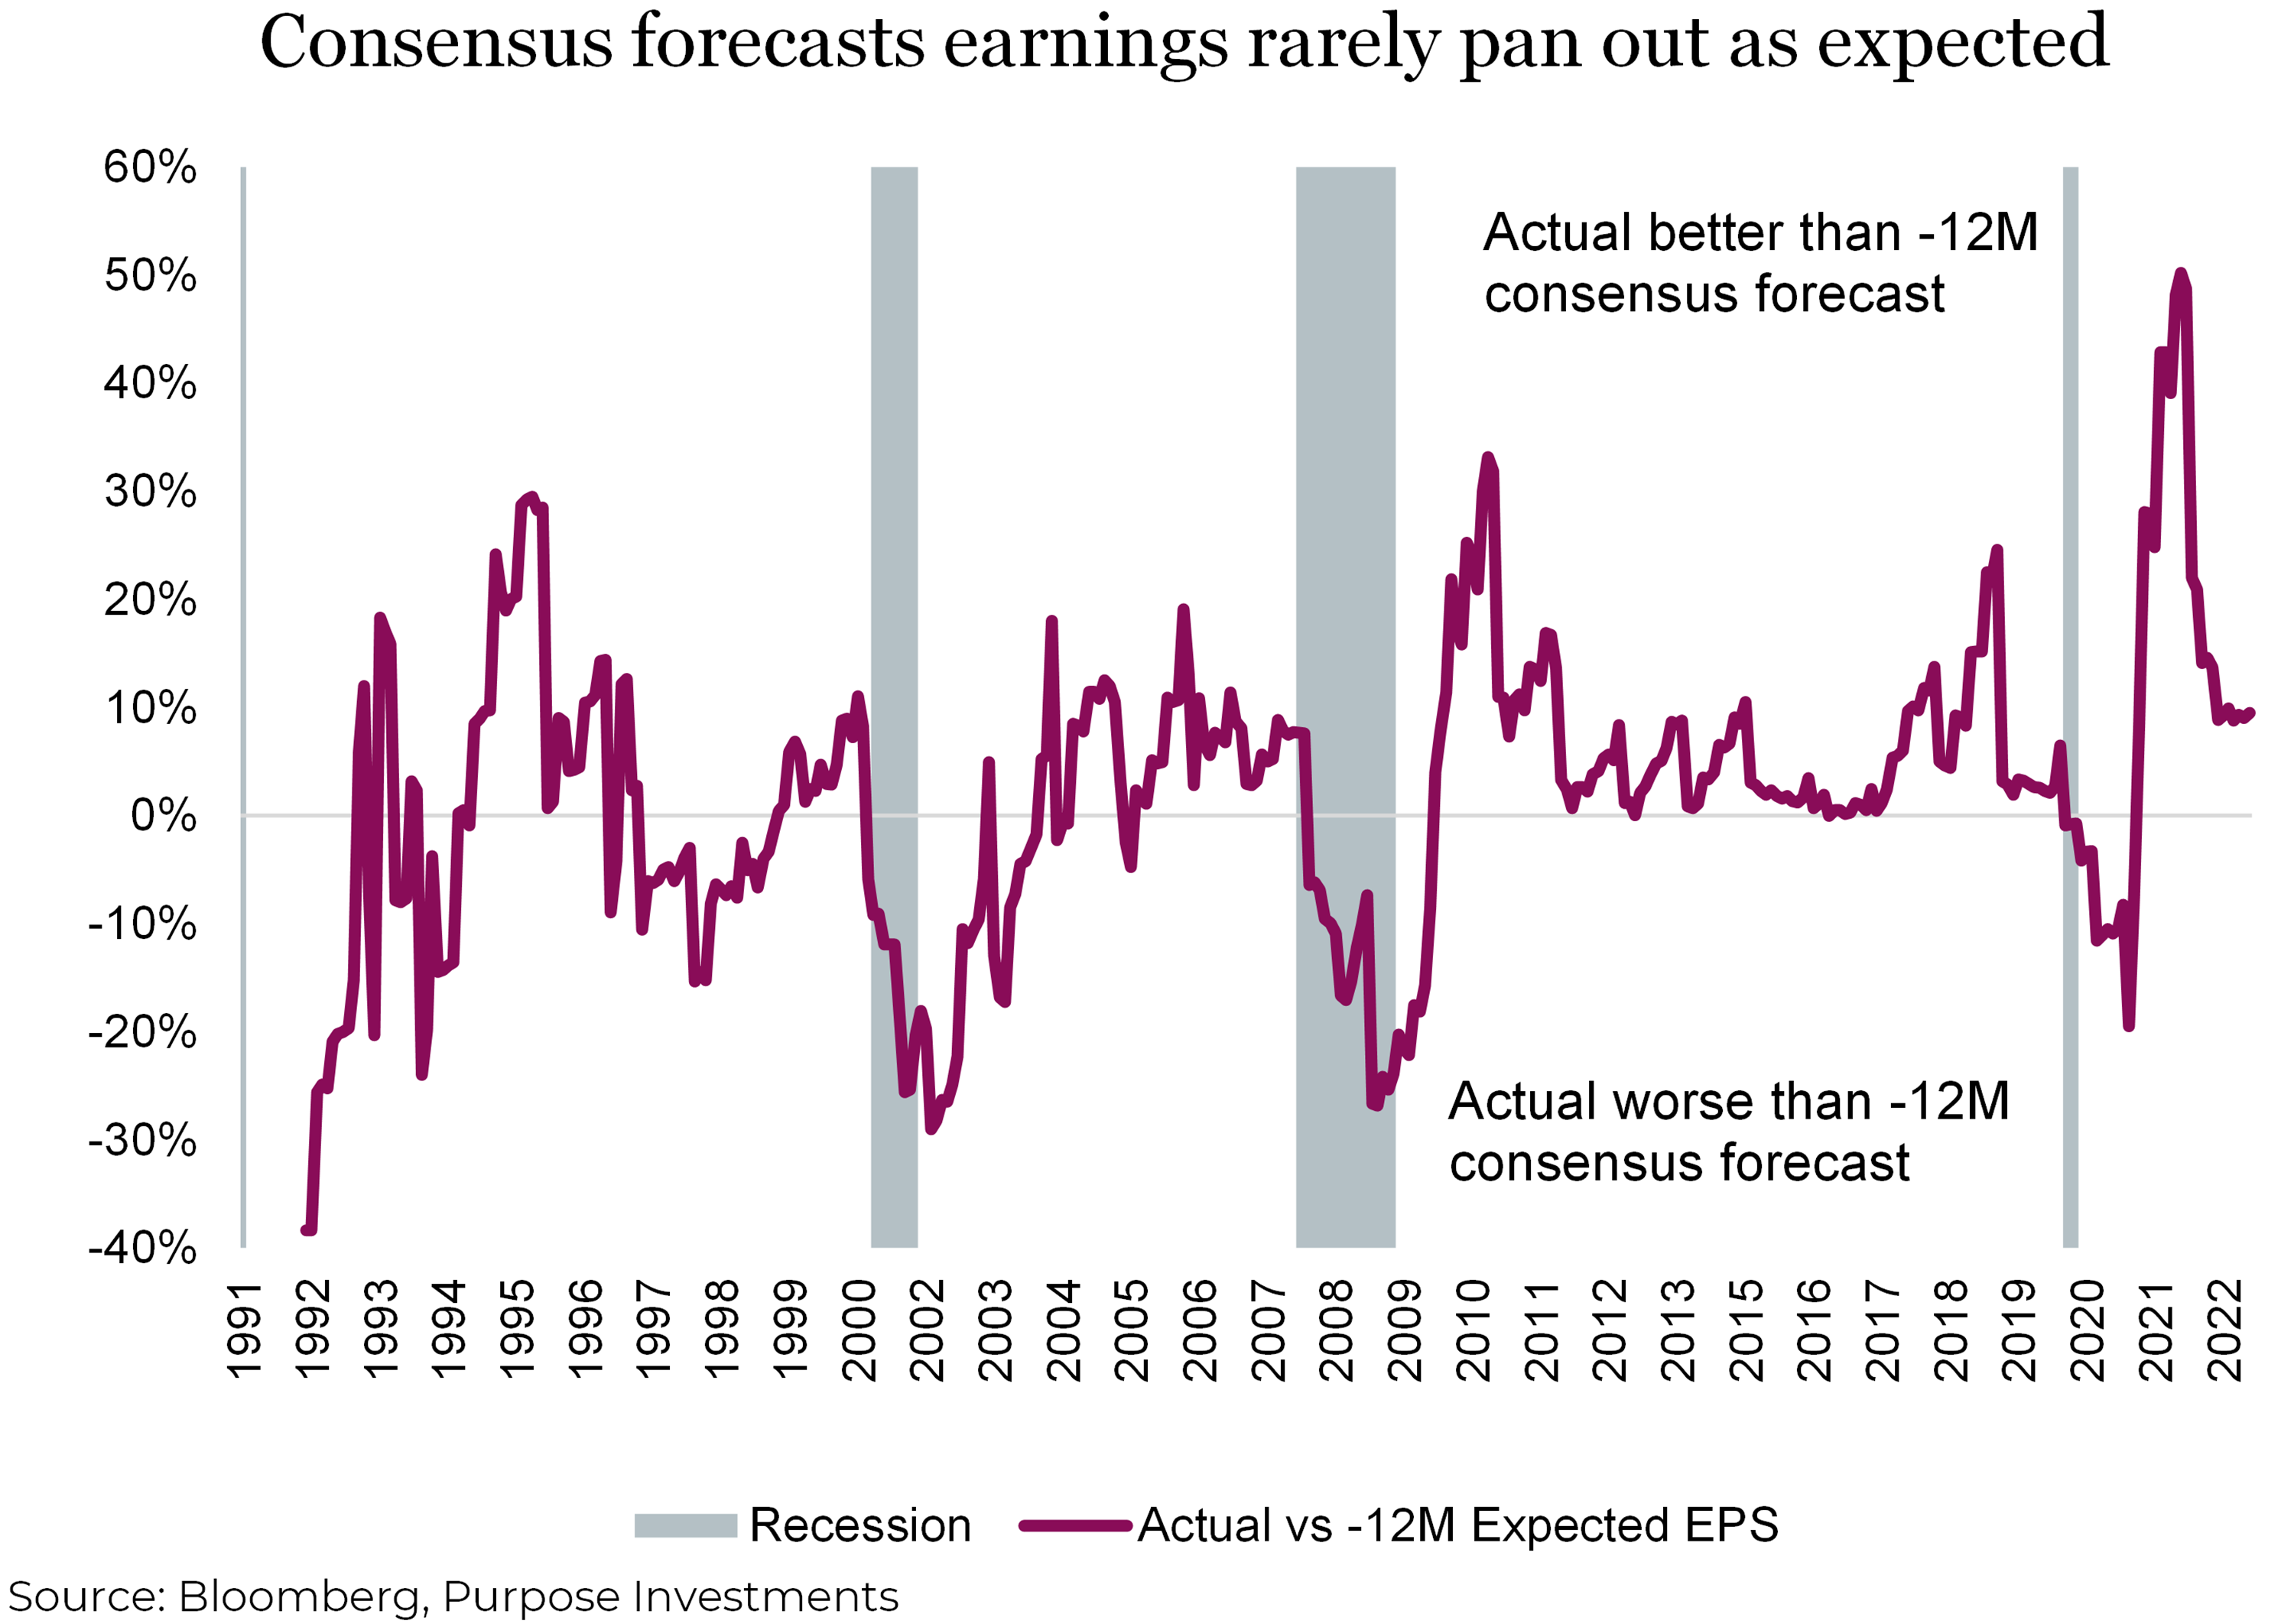
This chart plots actual earnings per share (EPS) compared to the EPS estimates from 12 months prior. During past reported recessions, earnings come in around 20%-30% below the estimates from 12 months prior. Presently, current earnings are still 10% above what was expected at the beginning of 2022, but the trend is falling. Keep in mind a year ago nobody was expecting a Fed Funds rate of 4.75% either and those increased borrowing costs will continue to crimp demand when the full effect of the hikes fully reveal themselves in the economy and consumer spending patterns.
While it’s our base case that there will be an economic slowdown and possibly even a recession later this year, yet the consensus has yet to fully price this change in the macro environment into their forecasts. As noted earlier, estimates have fallen just 6% from their peak.
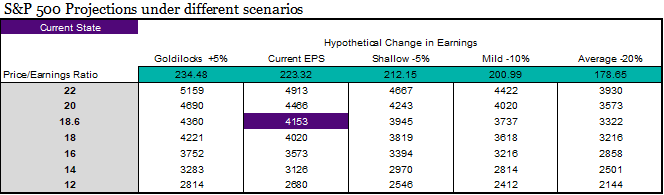
Where to from here?
Below is a matrix showing projected S&P 500 levels given a number of economic scenarios for earnings growth and what the market will pay for a $1 of earnings. From a very shallow recession with a 5% drop from current trailing earnings to an average recession with a decline of -20%. We’ve also included a ‘goldilocks scenario’ with earnings growing 5% from here. In the chart below, on the left-hand side are various PE multiples and within the matrix the corresponding S&P levels with the resulting percentage change from where we are now. It is a sobering exercise to go through it and realize that with a mild recession and multiples dropping down a few points to 16x earnings would bring the S&P 500 down to the 3,200 level. A sizeable drop given the rally up to recent levels.
Overall, the current and expected earnings drawdown for the S&P 500 is not consistent with any type of real recession scenario. Should a recession come, we would expect earnings to decline far more than the current estimates as they seem too optimistic in the 2H and underestimate two large negative forces facing corporate America. Continued rising cost (albeit at a slower rate) and deteriorating demand as higher borrowing costs crimp consumer spending. An expected after-effect of bear markets is a serious shift in investor psychology. Given the rampant low quality rebound year-to-date it would appear that the psychology of markets has NOT changed. The beginning of 2023 has so far felt very similar to 2021 just without the GameStop mania. Investors are still in that permanent QE mindset, despite a completely different state of affairs. There is and always will be a consequence to valuations and they currently appear overly confident. Central banks will not likely be able flip a switch and stimulate the economy with reckless abandon as it did in 2020. Our base case is that a recession remains on the horizon and current market conditions are not reflective of the ‘old normal’, instead the ‘new normal’ mentality from the preceding decade has taken hold once again.
Japan trip #2
After becoming positive on Japan last summer, it’s time for another visit as much has changed. Japanese Yield Curve Control continues to be a hot topic throughout the global markets. A few weeks ago, another opportunity rose for the BOJ to abandon yield curve control and attempt to reign in their 40+ year high inflation. However, the final decision was made to remain steadfast with the program. We hold strong in our beliefs as well, that this decision was made from a short-term viewpoint and the economic situation will encourage their hand into repairing the currency and reigning in their multi-decade high inflation.
There is good and bad news if the BOJ does decide to abandon yield curve control. The good news is that our unhedged exposure to the Yen should spike much higher, posting much stronger returns for us Canadians. The bad news is, abandoning their loose monetary policy could prove challenging for the Japanese stock market in what would be seen as a significant move towards fiscal tightening.
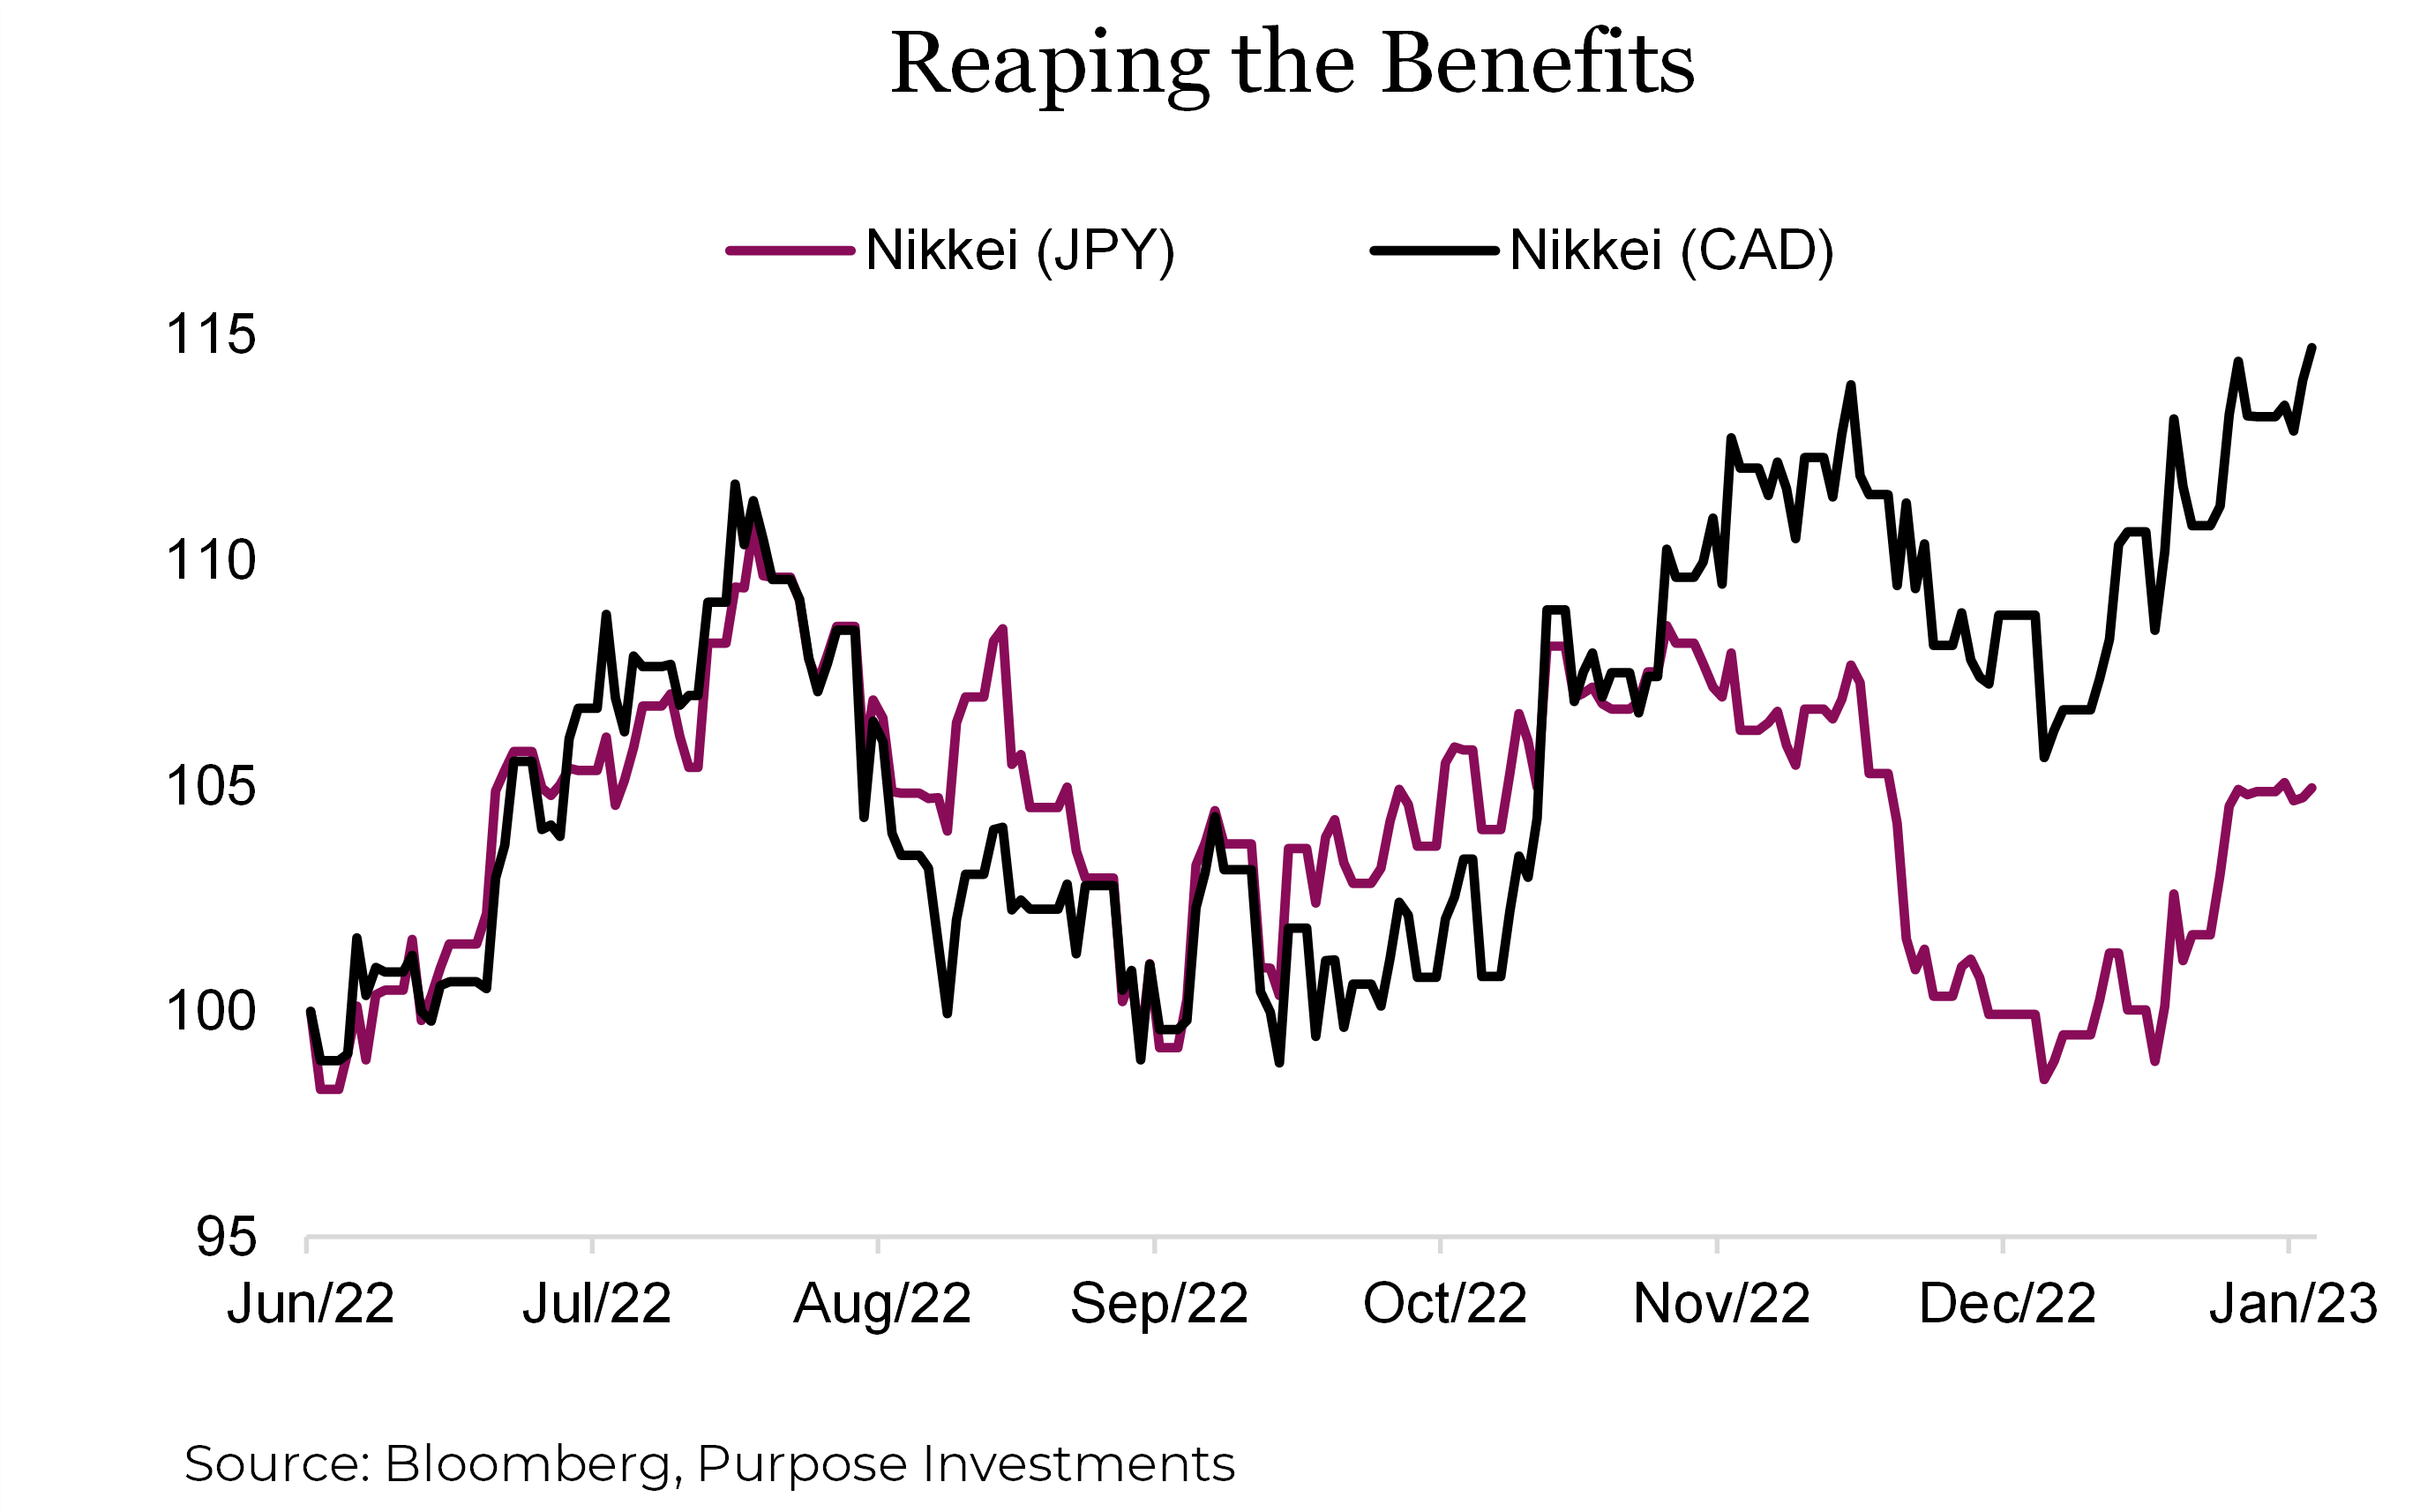
We saw the first sign of it back in December when the BOJ adjusted the policy slightly, allowing their 10-year bond yields to have a wider band of +/- 50 bps instead of 25. We watched the Japanese market fall while the Yen showed some strength. We expect a similar event if the BOJ decides to abandon the policy altogether, however, likely more impactful. In our view, the positive move in the yen for us as Canadians will outweigh the drop in the Japanese market resulting in a net positive return for multi-asset portfolios.

Over the last several months, the recovery of the Japanese Yen has started to form. Back in July when we initiated a position in Japan, you could get 35% more yen per loonie compared to a couple of years prior to that. With the strength in the yen over the last few months you can get about 21% more yen per loonie. That move came due to the expectation that the BOJ is going to have to step in to reverse the weakness. As we saw the first sign of this in December, one has to believe they cannot continue to buy bonds at this pace, inflating their balance sheet and crushing their currency.
As Japan holds loose and the rest of the world holds tight, global spreads against Japan have remained elevated. In our eyes, it does not matter who blinks first. Whether the world becomes a little more dovish due to a recession or Japan is more hawkish to catch up to the globe, the unhedged currency exposure to Japan will continue to prove rewarding.
The easing of lockdowns in Asian economies is another reason to be bullish in Japan. Emerging markets remain expensive and historically have underperformed during a recession. That brings cause for concern for portfolios that are perhaps loading up in China or other emerging economies. That leaves investors with a decision, to replicate a “U.S. pandemic recovery” type of event in Asia. How does one do so without too much exposure to those underdeveloped economies? Our answer remains to be overweight Japan, the second largest developed economy in the world. A line from our past Market Ethos sums up the situation perfectly:
As a developed economy, Japan would benefit from the reopening economic boost of the region while being less at risk from the emerging market headwinds.
The makeup of their current corporate landscape is another reason to feel comfortable with Japan. Earnings remain strong with valuations well below the average of the last 10 years. The lower currency has proved well for Japanese exports as their goods have been less expensive compared to goods priced in stronger currencies. Yields remain strong as companies in Japan continue to increase cash flow back to investors through dividends and share buybacks. From a market perspective, Japan is poised for strong growth barring any additional major economic setbacks.
The simple thesis moving forward comes down to inflation being elevated (from their standards) and the BOJ will likely have to step in and be more aggressive than they have been. When that will happen remains the question. The current term for Haruhiko Kuroda, the governor of the BOJ, will be up at the beginning of April. Perhaps the new governor will bring in a shift in policy that will prove to be more hawkish resulting in a reduction in inflation and strength to the Yen.
Over the last couple of months, we have really started to see some of the benefits bring our thesis to life. As the yen strengthened, the local currency index is up +5% while the Nikkei in Canadian dollars is up approximately +15%. The story has been playing out well to start but there are always risks to any investment decision in a portfolio. A prolonged recession, a mistake by the BOJ, or another spike in lockdowns are a few that could impact Japan. However, we continue to believe that the rewards outweigh the risks in this investment decision. Being international investors purchasing a currency at levels not seen since the early 2000s provides a substantial buffer against the risk.
Getting Real with Inflation
For years, inflation wasn’t given much thought and had been assumed to be around 2% in almost every investor’s financial plan. Just a simple input into the plan for the journey ahead. Well, the past couple years may challenge that benign assumption of 2%. We are in the camp that inflation will trend lower this year as changed pandemic behaviours normalize, supply issues resolve, maybe even peace. But looking farther downfield, we believe inflation will be more volatile and the average likely higher than decades past.
Inflation had remained low for decades thanks to a number of long term trends such as demographic, technology advancements, globalization of trade, peace and in the most recent decade a degree of deleveraging. Some of these trends appear to have either changed or softened. Demographic transition from savers giving way to more de-accumulators. Globalization is now facing onshoring. The world is less peaceful. Energy transition is also inflationary. And the disinflationary blanket that sat atop the global economy in the 2010s is clearly gone. Maybe 2% inflation assumption is a tad optimistic.
If inflation is going to be higher in the years ahead, this has portfolio construction implications [see Thought on the Next Cycle in our recent report entitled ‘Preparing for the next bull’. A higher allocation to investments that can keep up with inflation would help alleviate this new planning risk. Equities do well keeping up with inflation, primarily because earnings are nominal and enjoy a lift from inflation. Some markets more than others. Even better, real assets.
The term real assets has a rather wide interpretation in the investment world. Commodities, real estate, real return bonds, infrastructure, the list goes on. Among the many sub-categories of real assets, commodities and to a lesser degree real estate, have very strong long term historical relationships with inflation. Thus, allocations that include real assets, potentially with a commodity / real estate tilt, can help protect a portfolio and financial plan against inflation.
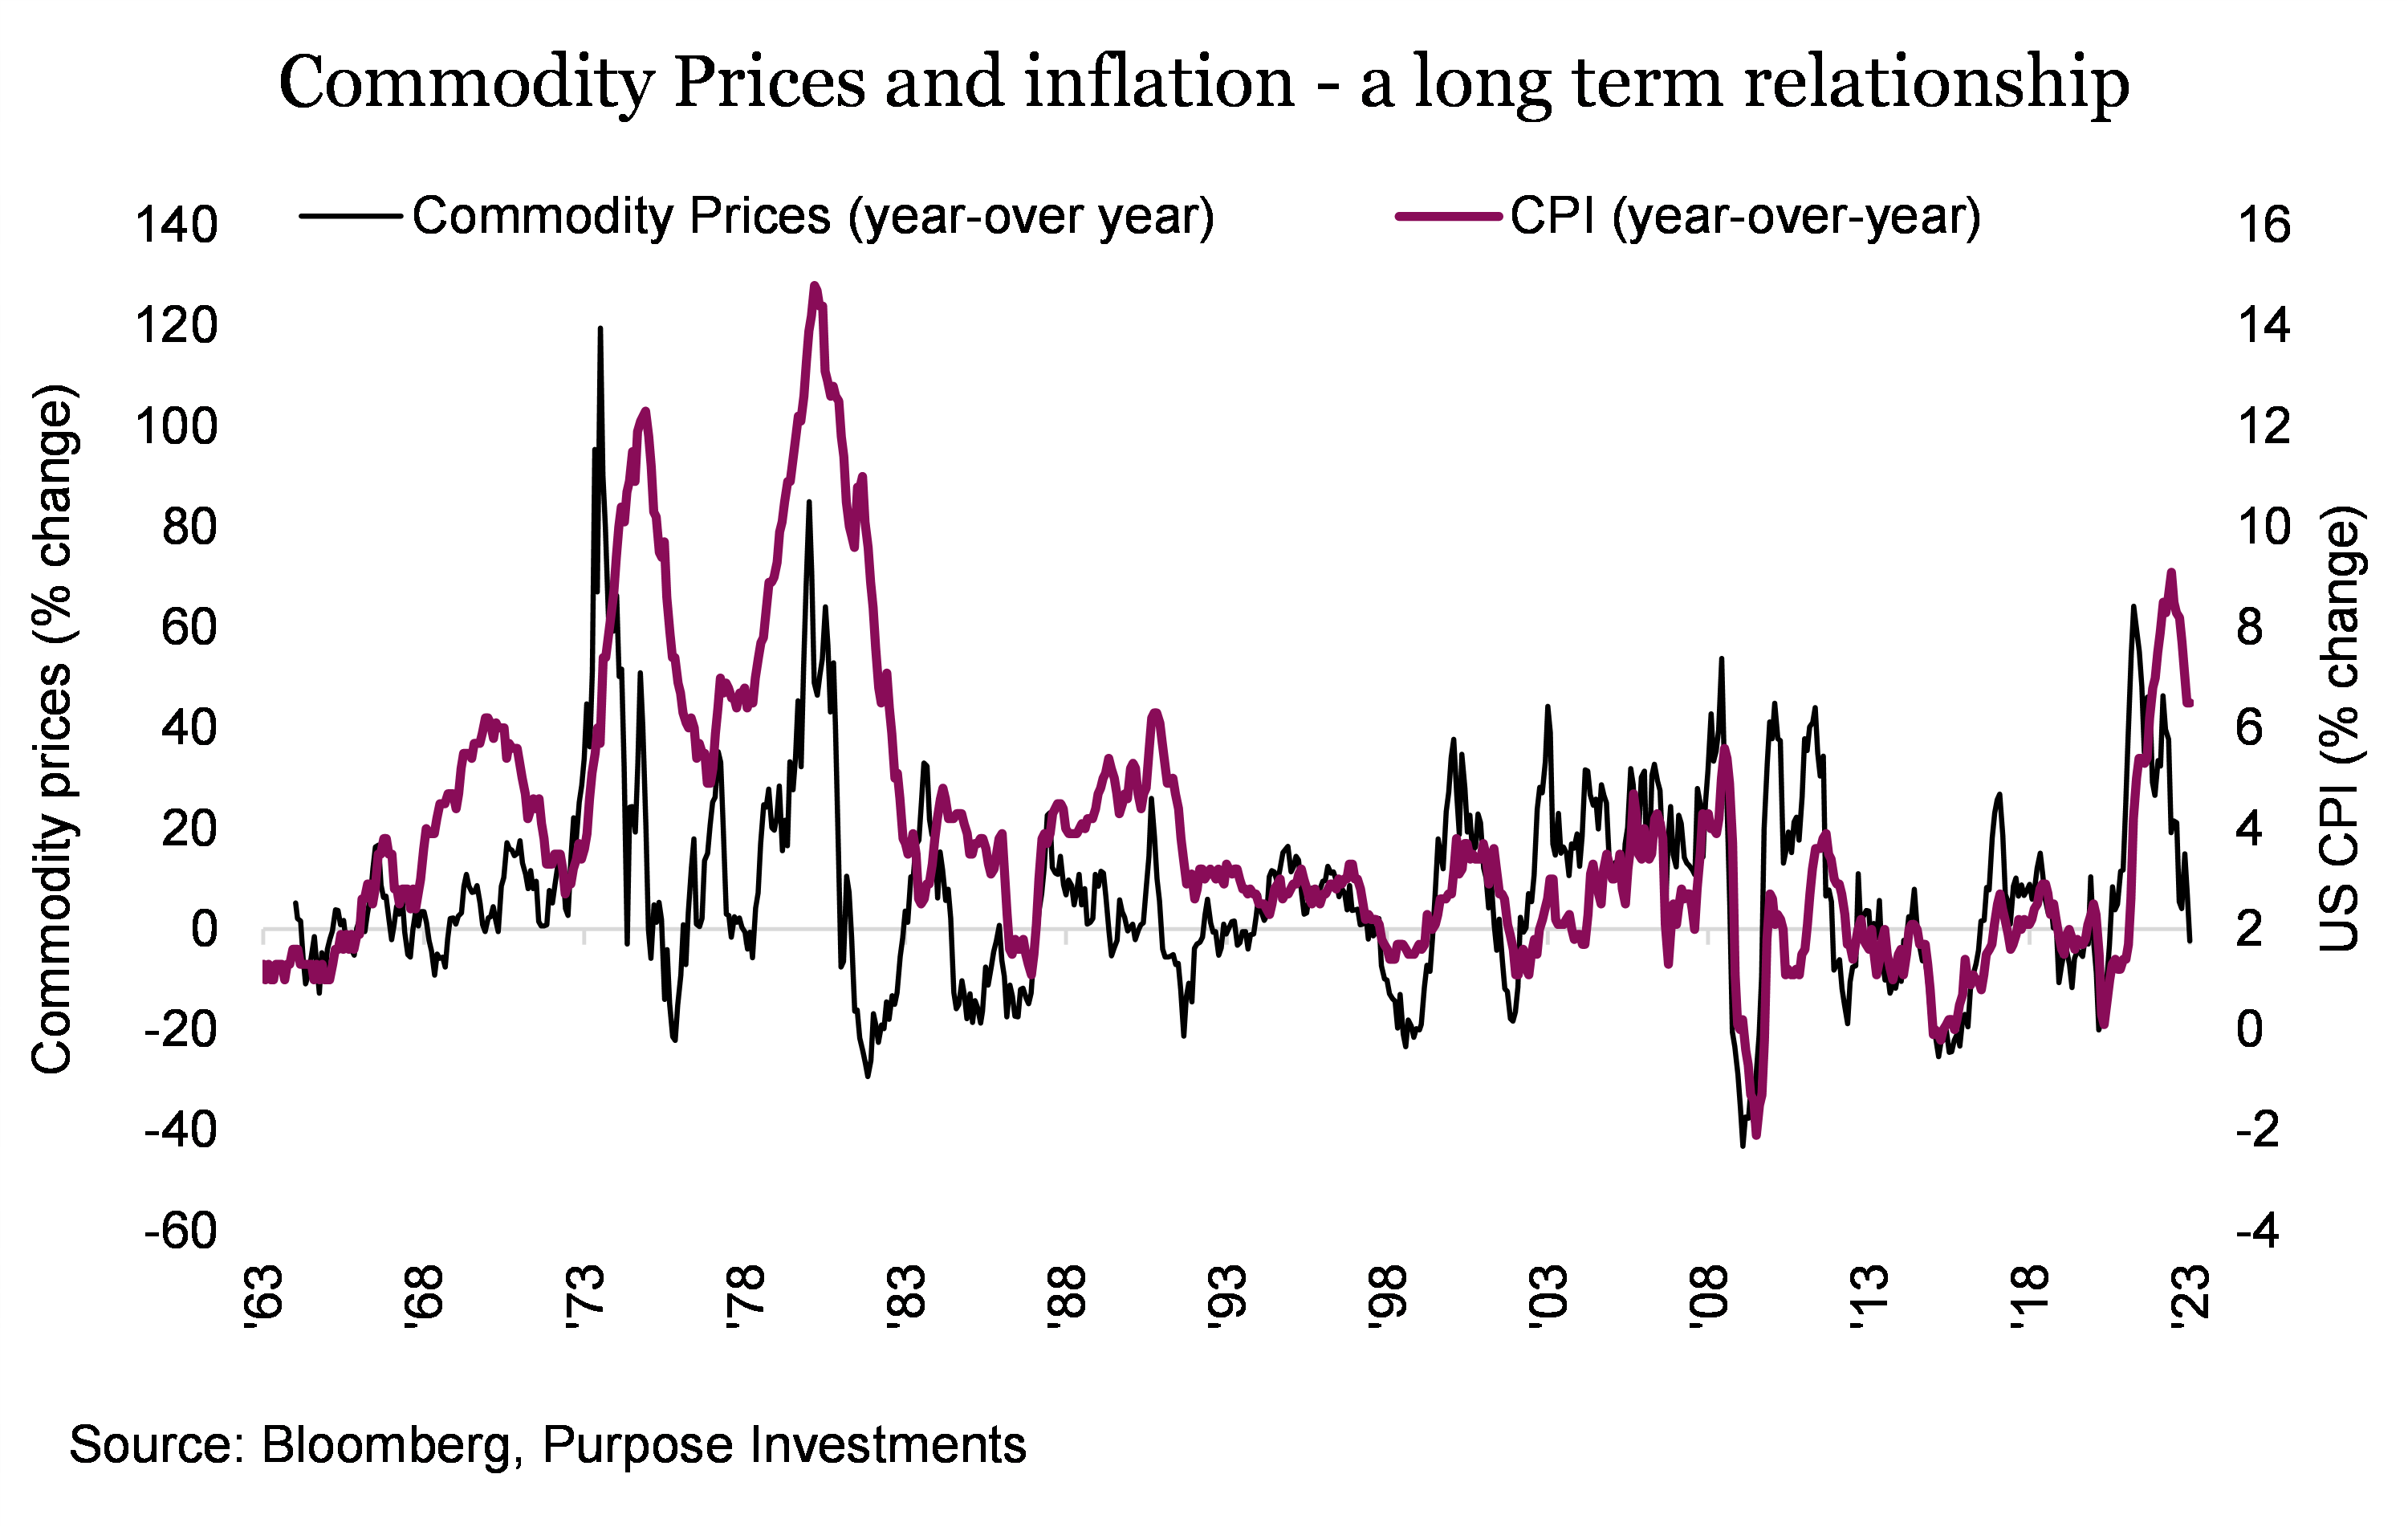
As recent evidence global markets declined in 2022 largely due to high inflation, while real assets held up very well somewhat offsetting higher inflation period.
Commodity Supply and Demand – One could argue there has been an underinvestment in supply capacity for many commodities that has been exacerbated by the conflict in Ukraine. This has also encouraged greater diversity in supply sources. Meanwhile on the demand side energy transition is changing which commodities are seeing greater changes in consumption. Creating a healthy supply demand situation.
However, with the FOMC raising the cost of capital over the past year from 0.25% – 4.75%, there is a rising risk of recession and/or slowing economic growth. This is a headwind for commodity prices on the demand side but worth noting that some economies around the world had already slowed and are now improving. China for instance which has suffered a multi-year contraction in housing and a zero covid policy, is now seeing growth rebound as both these headwinds dissipate. And when it comes to commodities, China and other emerging economies matter a lot more than whether or not the U.S. economy contracts.
Agricultural commodities have seen significant strength this year, particularly grains, due to the high demand and supply shortage due to disruption in Ukrainian exports. Russia’s invasion on Ukraine has been a key driver for commodity prices this year. Prices for many major crops are projected to decline in the near term as global production responds to high prices of recent years. Nonetheless, after these initial price declines, long-term growth in global demand for agricultural products, and continued biofuel demand hold prices for many crops above pre-2007 levels.
Infrastructure/Real Estate – Real estate valuations and cash flows held steady last year despite the market turmoil. The infrastructure market is expected to slow down with the higher interest rate environment pushing the forecast towards the downside in the short run. However, the consensus of consumer sentiment in the long run shows that people are majorly optimist in the long run and in turn, reflects the ongoing attractiveness of global real assets as a theme. inflation at its peak and central banks still hiking rates but at a slower pace, the largest headwind for those affected are now subsiding.
Precious Metals – Gold prices were hindered in 2022 by aggressive central banks hiking interest rates to combat the elevated levels of inflation and also dominated by the strong dollar. As we adventure further into 2023, expectations for inflation may have peaked, however, we must keep in mind that the only projection is modestly higher equilibrium inflation rates over the next decade. With this supporting the theme of underinvestment in real assets and higher strength in the asset class moving into the future, there are clear signs that the strength of gold is not its price rising in the short term but in fact the long-term stability of the asset that provides great value when added into an investment portfolio.
Investment Implications:
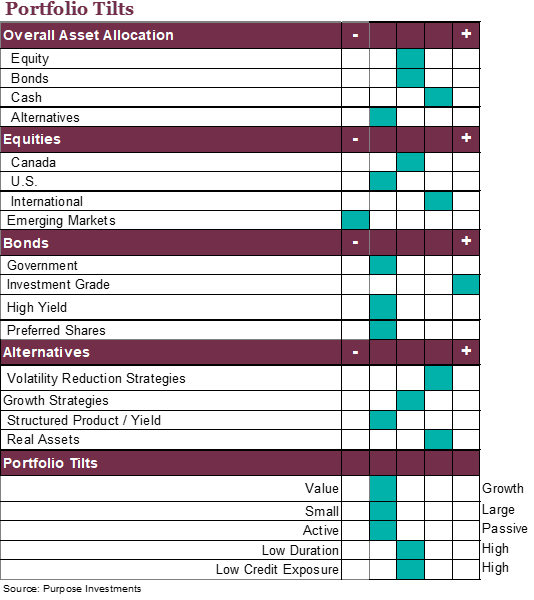
Adding real assets into an investment portfolio can help protect the portfolio and a financial plan from inflation risk, helping retain its value over time. Based on our current portfolio construction tilts, real assets has been an overweight for some time and will likely remain so. And while there are many strategies within the real asset spectrum, we believe those that focus on commodity and real estate exposure provide the biggest bang for the buck in terms of portfolio inflation protection.
Source: Charts are sourced to Bloomberg L.P., Purpose Investments Inc., and Richardson Wealth unless otherwise noted.
Disclaimers
Richardson Wealth Limited
The opinions expressed in this report are the opinions of the author and readers should not assume they reflect the opinions or recommendations of Richardson Wealth Limited or its affiliates. Assumptions, opinions and estimates constitute the author’s judgment as of the date of this material and are subject to change without notice. We do not warrant the completeness or accuracy of this material, and it should not be relied upon as such. Before acting on any recommendation, you should consider whether it is suitable for your particular circumstances and, if necessary, seek professional advice. Past performance is not indicative of future results. The comments contained herein are general in nature and are not intended to be, nor should be construed to be, legal or tax advice to any particular individual. Accordingly, individuals should consult their own legal or tax advisors for advice with respect to the tax consequences to them.
Richardson Wealth is a trademark of James Richardson & Sons, Limited used under license.
Purpose Investments Inc.
Purpose Investments Inc. is a registered securities entity. Commissions, trailing commissions, management fees and expenses all may be associated with investment funds. Please read the prospectus before investing. If the securities are purchased or sold on a stock exchange, you may pay more or receive less than the current net asset value. Investment funds are not guaranteed, their values change frequently and past performance may not be repeated.
Forward Looking Statements
Forward-looking statements are based on current expectations, estimates, forecasts and projections based on beliefs and assumptions made by author. These statements involve risks and uncertainties and are not guarantees of future performance or results and no assurance can be given that these estimates and expectations will prove to have been correct, and actual outcomes and results may differ materially from what is expressed, implied or projected in such forward-looking statements. Assumptions, opinions and estimates constitute the author’s judgment as of the date of this material and are subject to change without notice. Neither Purpose Investments nor Richardson Wealth warrant the completeness or accuracy of this material, and it should not be relied upon as such. Before acting on any recommendation, you should consider whether it is suitable for your particular circumstances and, if necessary, seek professional advice. Past performance is not indicative of future results. These estimates and expectations involve risks and uncertainties and are not guarantees of future performance or results and no assurance can be given that these estimates and expectations will prove to have been correct, and actual outcomes and results may differ materially from what is expressed, implied or projected in such forward-looking statements. Unless required by applicable law, it is not undertaken, and specifically disclaimed, that there is any intention or obligation to update or revise the forward-looking statements, whether as a result of new information, future events or otherwise.
Before acting on any recommendation, you should consider whether it is suitable for your particular circumstances and, if necessary, seek professional advice.
The particulars contained herein were obtained from sources which we believe are reliable, but are not guaranteed by us and may be incomplete. This is not an official publication or research report of either Richardson Wealth or Purpose Investments, and this is not to be used as a solicitation in any jurisdiction.
This document is not for public distribution, is for informational purposes only, and is not being delivered to you in the context of an offering of any securities, nor is it a recommendation or solicitation to buy, hold or sell any security.
Richardson Wealth Limited, Member Canadian Investor Protection Fund.
Richardson Wealth is a trademark of James Richardson & Sons, Limited used under license.