- Building blocks to support accelerated long-term value creation in place
- Growth momentum heading into 2022
- Announced Normal Course Issuer Bid and Share Consolidation
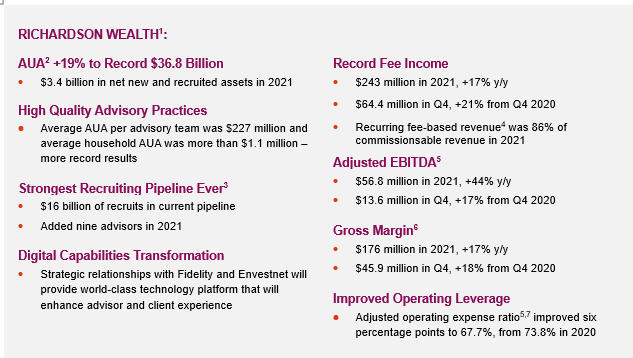
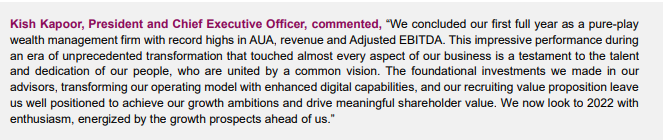
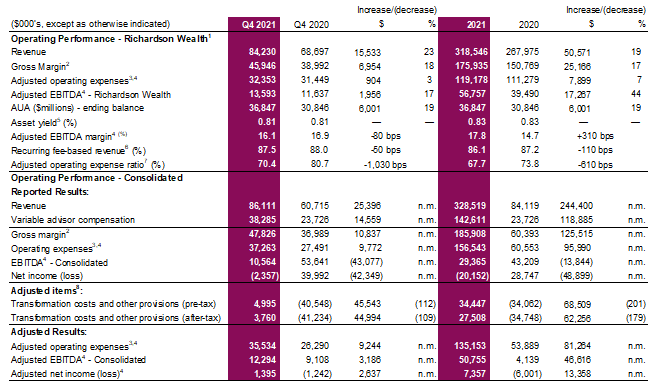
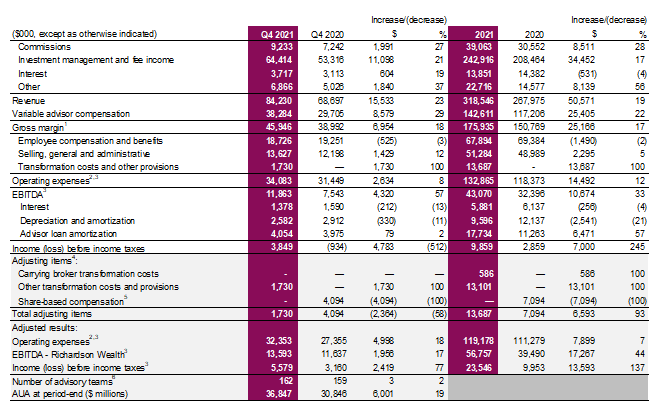
Toronto, March 4, 2022 – RF Capital Group Inc. (RF Capital or the Company) (TSX: RCG) today reported record revenue and tight expense management, which fuelled full year 2021 consolidated Adjusted EBITDA5 of $50.8 million. Total revenue grew to $329 million, driven largely by record recurring fee revenue. Assets under administration (AUA) ended the year at an all-time high of $36.8 billion. Adjusted EBITDA5 in the Wealth Management segment was $59.2 million in 2021 (including $56.8 million at Richardson Wealth). The Company’s performance benefited from the fact that its Richardson Wealth subsidiary registered an operating expense ratio5,7 of 67.7%, a six percentage point improvement from 2020. The Company’s full year reported net loss was $20.2 million, which included $34.4 million of pre-tax transformation charges and other provisions ($27.5 million after-tax).
Fourth quarter revenue of $86.1 million was up 42% from Q4 last year and 8% from Q3 of 2021. Consolidated Adjusted EBITDA5 was $12.3 million and reported net loss was $2.4 million in Q4 2021. Adjusted EBITDA5 in our Wealth Management segment was $14.4 million this quarter (including $13.6 million at Richardson Wealth). Excluding expenses related to compensation program changes in our private client capital markets group, as discussed in the Q4 and 2021 Items of Note section in this press release, consolidated Adjusted EBITDA4 would have been $13.7 million in Q4 and Adjusted EBITDA4 at Richardson Wealth would have been $15.0 million.
Q4 and Full Year 2021 – Select Financial Highlights
In late 2020, the Company began to fully consolidate Richardson Wealth’s financial results, reflecting the fact that it acquired 100% ownership of that business on October 20, 2020. Q1 2021 represented the first full quarter that the Company consolidated Richardson Wealth’s results. As a result, the comparability of results across periods is limited.
- Richardson Wealth’s operating results pre-October 20, 2020 are for reference purposes as they were not fully consolidated into RF Capital’s financial statements
- Gross margin is calculated as revenue less advisor variable compensation. The Company uses gross margin to measure operating profitability on the revenue that accrues to the Company
after making advisor payments that are directly linked to revenue. - Operating expenses include employee compensation and benefits, selling, general and administrative expenses, and transformation costs and other provisions. Adjusted operating
expenses are calculated as operating expenses less transformation costs and other provisions. - Considered to be a non-GAAP financial measure. Such measures do not have any standardized meaning prescribed by GAAP under IFRS and are therefore unlikely to be comparable to
similar measures presented by other issuers. For further information please read the “Presentation of Financial Information and Non-GAAP Measures” at the end of this press release. - Calculated as commission and fee income divided by average AUA
- Calculated as fee income divided by commission and fee income
- Calculated as adjusted operating expenses divided by gross margin
- For further information, please see Q4 and 2021 – Items of Note in this press release
Supplemental Financial Information – Richardson Wealth
Due to the lack of comparability of our consolidated financial results across the periods presented and to help readers understand the performance of our underlying wealth management business, we have included the standalone financial results of Richardson Wealth as a supplemental disclosure below. We will cease to provide this supplemental disclosure in 2022, since we will have comparable prior period results.
Due to the lack of comparability of our consolidated financial results across the periods presented and to help readers understand the performance of our underlying wealth management business, we have included the standalone financial results of Richardson Wealth as a supplemental disclosure below. We will cease to provide this supplemental disclosure in 2022, since we will have comparable prior period results.
The following table sets forth an overview of the consolidated financial results of Richardson Wealth for the periods indicated:
- Gross margin is calculated as revenue less advisor variable compensation. The Company uses gross margin to measure operating profitability on the revenue
that accrues to the Company after making advisor payments that are directly linked to revenue. - Operating expenses include employee compensation and benefits, selling, general and administrative expenses, and transformation costs and other provisions.
Adjusted operating expenses are calculated as operating expenses less transformation costs and other provisions. - Considered to be non-GAAP financial measures, which do not have any standardized meaning prescribed by GAAP under IFRS and are therefore unlikely to
be comparable to similar measures presented by other issuers. For further information, please see the “Presentation of Financial Information and Non-GAAP
Measures” section at the end of this press release. - For further information, please see Q4 and 2021 – Items of Note in this press release
- Represents share-based compensation expense related to the accelerated vesting of all Richardson Wealth’s outstanding RSUs and retention payments prior
to its acquisition by RF Capital. This amount excludes share-based compensation recorded in connection with private company shares awarded to employees
and advisors of Richardson Wealth prior to its acquisition by RF Capital. - Prior year has been revised to reflect the internal consolidation of certain teams
Normal Course Issuer Bid
The Company announced today that the Toronto Stock Exchange (TSX) has approved its notice of intention to make a normal course issuer bid (NCIB) for a portion of its common shares (Common Shares). The NCIB will be made in accordance with the requirements of the TSX.
RF Capital is implementing the NCIB because it believes that the market price of its Common Shares may not, from time to time, fully reflect their value. Accordingly, the purchase of its Common Shares may be an attractive and appropriate use of available funds, and in the best interest of its shareholders. The Company will still be able to sufficiently fund and pursue its growth ambitions if it deploys capital for the NCIB. The Company’s current net working capital, positive cash flow generation and its recently secured $200 million revolving credit facility provide ample capital to pursue strategic priorities as they may arise.
Pursuant to the notice, the Company is authorized to acquire up to a maximum of 5,485,719 of its Common Shares, or approximately 10% of the Company’s public float of approximately 54,857,193 Common Sharesas of February 22, 2022, or up to a maximum of 548,571 of its Common Shares or approximately 10% of the Company’s public float of approximately 5,485,719 Common Sharesfollowing the Consolidation (as defined below), for cancellation over the next 12 months. Purchases under the NCIB will be made through the facilities of the TSX or a Canadian alternative trading system and in accordance with applicable regulatory requirements at a price per Common Share equal to the market at the time of acquisition, or such other price as may be permitted by the TSX. The number of Common Shares that can be purchased pursuant to the NCIB is subject to a current daily maximum of 8,838 Common Shares or approximately 883 Common Shares, following the Consolidation, (which is equal to 25% of 35,353 Common Shares or approximately 3,535 Common Shares, following the Consolidation, being the average daily trading volume during the six months ended February 28, 2022), except where purchases are made in accordance with the “block purchase exception” of the TSX rules.
The Company may begin to purchase Common Shares on or about March 9, 2022 and the bid will terminate on or about March 8, 2023 or such earlier time as the Company completes its purchases pursuant to the bid or provides notice of termination. Any Common Shares purchased under the NCIB will be cancelled.
Share Consolidation
The Company also announced today that it intends to proceed with the consolidation of its Common Shares on the basis of one post-consolidation Common Share for every 10 pre-consolidation Common Share (the Consolidation). The Company’s shareholders previously approved the Consolidation at the annual general and special meeting held on May 26, 2021. The Consolidation will reduce the number of Common Shares issued and outstanding from approximately 158,714,254 to approximately 15,871,425.
The proposed Consolidation is part of the Company’s overall strategy to drive long term shareholder value and to increase its profile among investors. The board of directors (Board) believes that such share consolidation may increase investment interest for the Company’s Common Shares and enhance trading liquidity by broadening the pool of investors that may consider investing in the Company, including investors whose internal investment policies prohibit or discourage them from taking an equity position in any company whose shares are trading below a certain price.
No fractional Common Shares will be issued pursuant to the Consolidation. In lieu of any such fractional Common Shares, each registered shareholder otherwise entitled to a fractional Common Share following the implementation of the Consolidation will receive the nearest whole number of post-Consolidation Common Shares.
The TSX has conditionally approved the Consolidation. The Common Shares are expected to begin trading on a post-Consolidation basis when the market opens on or about March 22, 2022, subject to the TSX’s final approval.
The Company’s transfer agent, TSX Trust Company, intends to senda letter of transmittal to the registered holders of the Common Shares. The letter of transmittal will contain instructions on how to surrender Common Share certificates representing pre-Consolidation Common Shares to the transfer agent. Shareholders will be able to obtain a copy of the letter of transmittal at the Company’s website at www.rfcapgroup.com and under the Company’s SEDAR profile at www.sedar.com. The transfer agent will forward to each registered shareholder who has sent the required documents a new Common Share certificate representing the number of post-Consolidation Common Shares to which the registered shareholder is entitled. If shareholders hold their Common Shares through an intermediary and they have questions in this regard, they are encouraged to contact their intermediaries.
Following the Consolidation, the new CUSIP and ISIN numbers for the Common Shares are expected to be 74971G401 and CA74971G4016, respectively.
Preferred Share Dividend
On March 3, 2022, the Board approved a quarterly cash dividend of $0.233313 per Cumulative 5-Year Rate Reset Preferred Share, Series B, payable on March 31, 2022, to preferred shareholders of record on March 15, 2022.
Q4 2021 Conference Call
A conference call and live audio webcast to discuss RF Capital’s fourth quarter and fiscal 2021 results will be held today at 10:00 a.m. (EST). The call will be open to the public. Interested parties are invited to access the quarterly conference call on a listen-only basis by dialing 416-406-0743 or 1-800-898-3989 (toll free) and entering a participant passcode: 2556699#. The conference call will also be accessible as a live audio webcast through the Investor Relations section of the Company’s website at www.rfcapgroup.com/Investor-Relations/Quarterly-Information.
A recording of the conference call will be available until Monday, April 4, 2022, by dialing 905-694-9451 or
1-800-408-3053 (toll free) and entering access code 7889591#. The webcast will be archived at www.rfcapgroup.com/Investor-Relations/Quarterly-Information.
Q4 and 2021 – Items of Note
Pre-Tax Adjustments
The Company has been reporting a high number of items of note over the course of the past two years, which reflects its significant transformation journey. The Company expects these expenses to lead to significant EBITDA benefits in future periods. The adjusted financial results presented in this press release back out the impact of the Company’s transformation program to provide readers with a more representative view of its run-rate expenses and profitability. Transformation costs declined in Q4 of 2021 and the Company anticipates even fewer items of note in 2022. The material adjustment made for intangible asset amortization will continue through 2035.
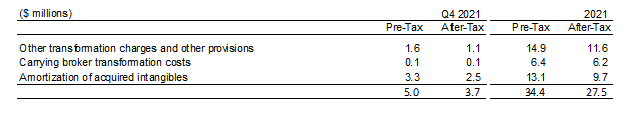
Q4 and 2021 included $5.0 million and $34.4 million of pre-tax adjusting items, respectively:
- charges related to the Company’s ongoing transformation, which are reported in both the Wealth Management and Corporate segments. This amount includes charges in connection with refining the Company’s organizational structure, professional fees paid related to developing and implementing our new strategy across the Company, charges in connection with the outsourcing of the Company’s carrying broker operations, and provisions for realigning parts of the Company’s real estate footprint. RF Capital does not expect transformational charges to be as significant in 2022.
- amortization of intangible assets reported in the Corporate segment. The amortization arises from intangible assets created on the acquisition of Richardson Wealth in Q4 2020.
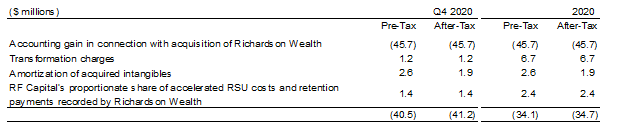
Q4 and 2020 included the following adjusting items:
- an accounting gain recorded in Q4 of 2020 in connection with RF Capital’s acquisition of Richardson Wealth, reported in the Corporate segment;
- charges related to the transformation of the business, reported in the Corporate segment;
- $2.6 million of pre-tax amortization of intangible assets ($1.9 million after-tax), reported in the Corporate segment; and
- RF Capital’s proportionate share of the $4.1 million and $7.1 million, in Q4 and 2020, respectively, in accelerated RSU costs and retention payments recorded by Richardson Wealth immediately prior to RF Capital’s acquisition of that business. This amount is included in the Share of loss of associate line item and reported in the Wealth Management segment.
In addition, while not an adjusting item, Q4 2021 included an incremental $1.4 million of compensation expenses related to the launch of a new compensation program for our private client capital markets team ($1.1 million after-tax). This change resulted in almost a full year of bonuses being recorded in Q4. These expenses were recorded in our Wealth Management segment.
Presentation of Financial Information and Non-GAAP Measures
Unless otherwise specified herein, financial results contained in this press release including related historical comparatives, are based on the Company’s 2021 Annual Financial Statements, which Management has prepared in accordance with International Financial Reporting Standards (IFRS).
Non-GAAP Measures
The Company uses a variety of measures to assess business performance. In addition to GAAP prescribed measures, it uses certain non-GAAP measures that it believes provides useful information to investors regarding its performance and results of operations. Readers are cautioned that non-GAAP measures (including non-GAAP ratios) often do not have any standardized meaning and therefore may not be comparable to similar measures presented by other issuers. Non-GAAP measures are reported in addition to, and should not be considered alternatives to, net income or comparable metrics determined according to IFRS as indicators of its performance, liquidity, cash flows, and profitability.
The primary non-GAAP financial measures used in this press release are:
EBITDA
The use of EBITDA is common in the wealth management industry. The Company believes it provides a more accurate measure of its core operating results, is a proxy for operating cash flow, and is a facilitator for enterprise valuation. EBITDA is used to evaluate core operating performance by adjusting net income to exclude:
- Interest expense, which the Company records primarily in connection with term debt
- Income tax expense/(benefit)
- Depreciation and amortization expense, which its records primarily in connection with intangible assets, leases, equipment, and leasehold improvements; and
- Amortization in connection with investment advisor transition and loan programs. The Company views these loans as an effective recruiting and retention tool for advisors, the cost of which is assessed by management upfront when the loan is provided rather than over its term.
Operating Expenses and Operating Expense Ratio
Operating expenses include:
- Employee compensation and benefits; and
- Selling, general, and administrative expenses
These are the expense categories that factor into the EBITDA calculation discussed above.
The operating expense ratio is determined by dividing adjusted operating expenses by gross margin. The Company uses this ratio to measure the efficiency of its operations.
Adjusted Results
In periods that the Company determines that specified items have a significant impact on a user’s assessment of ongoing business performance, it may present adjusted results in addition to reported results by removing these items from the reported results. Management considers the adjusting items to be outside of its core operating performance. The Company believes that adjusted results can to some extent enhance comparability between reporting periods or provide the reader with a better understanding of how management views core performance. Adjusted results are also intended to provide the user with results that have greater consistency and comparability to those of other issuers.
Adjusting items in this press release include the following, by reporting segment:
Wealth Management:
- Transformation costs and other provisions: charges in connection with the ongoing transformation of the business and other matters. These charges encompass a range of transformation initiatives, including refining its ongoing operating model, outsourcing its carrying broker operations, realigning parts of its real estate footprint, and rolling out its new strategy across the Company.
- Share-based compensation costs: adjustments for compensation recorded in connection with the accelerated vesting of all Richardson Wealth’s outstanding RSUs prior to its acquisition by RF Capital. This adjustment applies only to the 2020 comparative results at Richardson Wealth and is included in the Share of loss in associate line on the Company’s income statement.
Corporate:
- Transformation costs:incremental professional and advisory fees in connection with the acquisition of Richardson Wealth and the development of its go-forward strategy
- Amortization of acquired intangible assets:amortization of intangible assets created on the acquisition of Richardson Wealth
- Gain on investment in associate:accounting gain recorded in connection with RF Capital’s acquisition of Richardson Wealth
Other than the gain on investment in associate, all adjusting items affect reported expenses. The following table itemizes these adjustments and reconciles reported operating expenses to adjusted operating expenses:
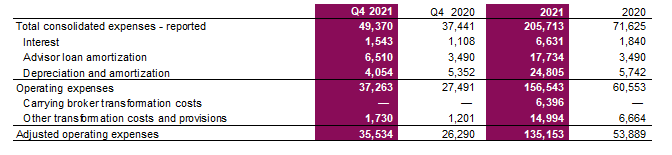
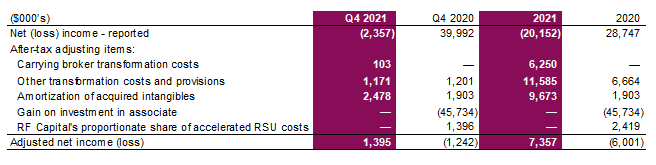
The following table overlays the adjusting expense items on reported net loss and provides a reconciliation of the Company’s reported results to adjusted net income/(loss):
Supplemental Financial Measures
Supplemental financial measures (SFM) are financial measures the Company may use on a periodic basis to depict its financial performance and financial condition. The Company’s key supplemental financial measures include AUA, recruiting pipeline, net new and recruited assets, AUA per advisory team, and household AUA. The composition of a SFM is included in this press release where the measure is first disclosed.
Forward-Looking Information
This press release contains forward-looking information as defined under applicable Canadian securities laws. This information includes, but is not limited to, statements concerning objectives and strategies to achieve those objectives, as well as statements made with respect to management’s beliefs, plans, estimates, projections and intentions and similar statements concerning anticipated future events, results, circumstances, performance, or expectations that are not historical facts. Forward-looking information generally can be identified by the use of forward-looking terminology such as “outlook”, “objective”, “may”, “will”, “expect”, “intend”, “estimate”, “anticipate”, “believe”, “should”, “plans” or “continue”, or similar expressions suggesting future outcomes or events. Such forward-looking information reflects management’s current beliefs and is based on information currently available to management. The forward-looking information contained herein is expressly qualified in its entirety by this cautionary statement.
The forward-looking statements included in this press release, including statements regarding the NCIB and Consolidation, the nature of our growth strategy going forward and execution of any of our potential plans, are not guarantees of future results and involve numerous risks and uncertainties that may cause actual results to differ materially from the potential results discussed or anticipated in the forward-looking statements, including those described in this press release, our 2021 Annual MD&A, and our latest Annual Information Form (AIF). Such risks and uncertainties include, but are not limited to, market, credit, liquidity, operational and legal and regulatory risks, and other risk factors, including variations in the market value of securities, dependence on key personnel and sustainability of fees. In addition, other factors, such as general economic conditions, including interest rate and exchange rate fluctuations, and natural disasters, or other unanticipated events (including the novel coronavirus and variants thereof (COVID-19) pandemic) may also influence our results of operations. For a description of additional risks that could cause actual results to differ materially from current expectations, see the “Risk Management” and “Risk Factors” sections in our 2021 Annual MD&A.
Although we attempted to identify important risk factors that could cause actual results to differ materially from those contained in forward-looking information, there may be other risk factors not presently known to us or that we presently believe are not material that could also cause actual results or future events to differ materially from those expressed in such forward-looking information.
Certain statements included in this press release may be considered a “financial outlook” for purposes of applicable Canadian securities laws. The financial outlook may not be appropriate for purposes other than this press release.
Forward-looking information contained in this press release is:
- based on management’s reliance on certain assumptions it considers reasonable; however, there can be no assurance that such expectations will prove correct. As such, readers should not place undue reliance on the forward-looking statements and information contained in this press release. When relying on forward-looking statements to make decisions, readers should carefully consider the foregoing factors, the list of which is not exhaustive;
- made as of the date of this press release and should not be relied upon as representing our view as of any date subsequent to the date of this press release. Except as required by applicable law, our management and Board undertake no obligation to update or revise any forward-looking information publicly, whether as a result of new information, future events or otherwise; and
- expressly qualified in its entirety by the foregoing cautionary statements
About RF Capital Group Inc.
RF Capital Group Inc. (RF Capital) is a TSX-listed (TSX: RCG) wealth management-focused company. Operating under the Richardson Wealth brand, the Company is one of Canada’s largest independent wealth management firms with $36.6 billion in assets under administration (as of February 28, 2022) and 20 offices across the country. The firm’s Advisor teams are focused exclusively on providing strategic wealth advice and innovative investment solutions customized for high-net worth or ultra-high-net worth families and entrepreneurs. The Company is committed to maintaining exceptional fiduciary standards and has earned certification – determined annually – from the Center for Fiduciary Excellence for its Separately Managed and Portfolio Management Account platforms. Richardson Wealth has also been recognized as a Great Place to Work™ for the past three years, a Best Workplace for Women, a Best Workplace in Canada and Ontario, Best Workplaces for Mental Wellness, in Financial Services and Insurance, and for Hybrid Work. For further information, please visit our corporate website at www.rfcapgroup.com and www.RichardsonWealth.com.
Media and Investor Contact:
RF Capital Group Inc.
Rocco Colella, Managing Director, Investor Relations
Tel: (416) 941-0894; [email protected]