
Sign up here to receive the Market Ethos by email.
January 2024.
Investor Strategy.
Executive summary
- A good start and finish
- Year of surprises
- Digging deeper into the numbers
- Two-year round trip
- Final thoughts
Despite the endpoint of the year being rather favourable, it certainly wasn’t a smooth line. Here is a brief walk down the investing memory lane of 2023.
A good start and finish
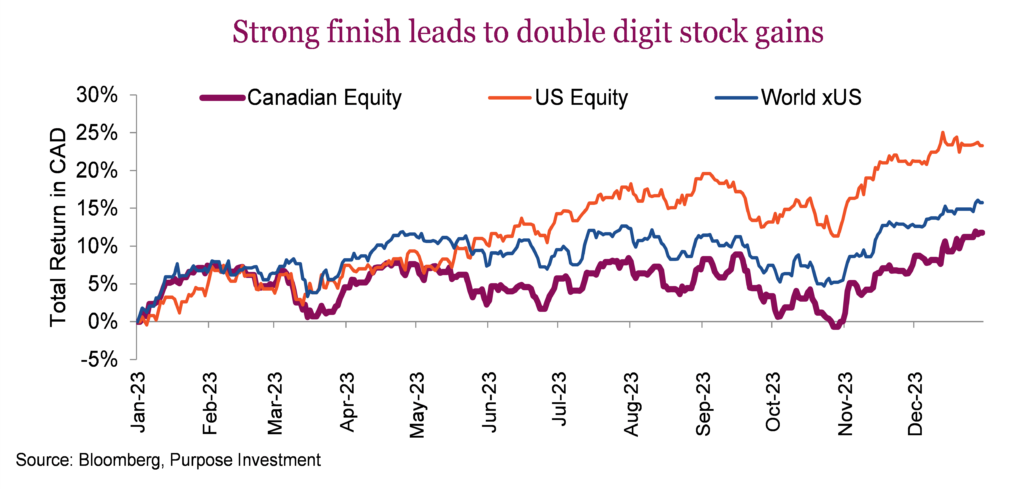
Let’s just say it: despite all the headlines, twists and surprises along the way, 2023 was a great year for investors. The S&P 500 was the star at +23% (all returns are total returns in CAD). Not to be left behind, Japan was up +19% and Europe +18%. Of course, we can shed a tear for our home market, up only +12%, but let’s not forget in 2022, the TSX suffered much less damage comparatively. When +12% has you trailing the pack, it has been a good year to be an investor.
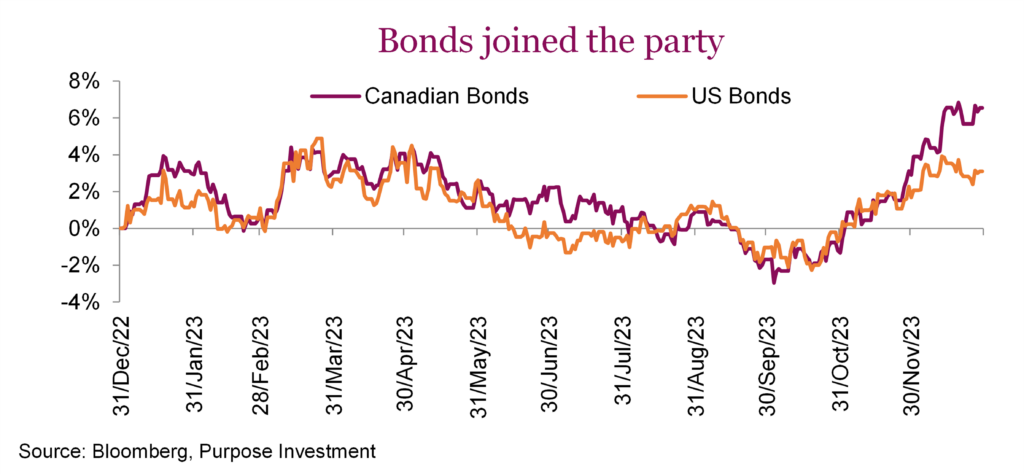
It wasn’t just stocks; bonds went up too, ending two consecutive down years. The Canadian aggregate finished up +6.5%, while the U.S. aggregate was up +3.1%. A strong Canadian dollar sapped a couple of points of performance for U.S.-denominated indices. Bonds were helped by inflation starting to subside and central banks hitting the pause button. Credit spreads also came down materially in the final weeks, driving even stronger returns in more credit-tilted parts of the bond market.
Despite the endpoint of the year being rather favourable, it certainly wasn’t a smooth line. Here is a brief walk down the investing memory lane of 2023:
Strong start – To say that people were bearish to begin 2023 is a bit of an understatement. Central banks were still hiking, inflation was still a problem, and investors were still licking their wounds from 2022. If you could encapsulate the general consensus, it was caution surrounding the U.S. market, abundant recession calls, and forecasts for yields coming down. However, despite all the bearishness, January proved to be the second-best month of the year as markets rallied and set a good precedent for the rest of the year.
With hindsight, 2023 had a decent setup for returns. Investor sentiment was already bearish, which is a contrarian indicator. VIX was elevated, and valuations were low or at least reasonable. This certainly does make 2024 look more challenging from a starting point.
| AAII Bulls minus Bears | VIX | S&P PE | TSX PE | 10-year US Yields | |
|---|---|---|---|---|---|
| January 2023 | -22 | 22 | 16.8 | 12.2 | 3.90% |
| January 2024 | 21 | 12 | 19.7 | 13.9 | 3.90% |
With total assets in excess of $500 billion, First Republic, Silicon Valley and Signature became among the biggest bank failures in U.S. history. Of course, there were many moving parts, including deposits being pulled in search of higher yields in money market vehicles and excess capital being invested in bonds, which sat in unrealized loss positions. Quick action by money center banks to provide loans and the Fed opening up a bank stability mechanism helped stabilize the situation. It’s amazing what throwing a few billion dollars at a problem can solve – or at least mitigate.
Artificial intelligence (AI) – As markets recovered from the bank scare, hype around AI really started to fuel the market rise. Opening up of large language models has increased accessibility and exposure from coders to the masses. Now, the race is on for firms to re-characterize revenue with an AI label; the familiar dance has begun. Still, the potential applications are considerable and largely unknown. It will be exciting.
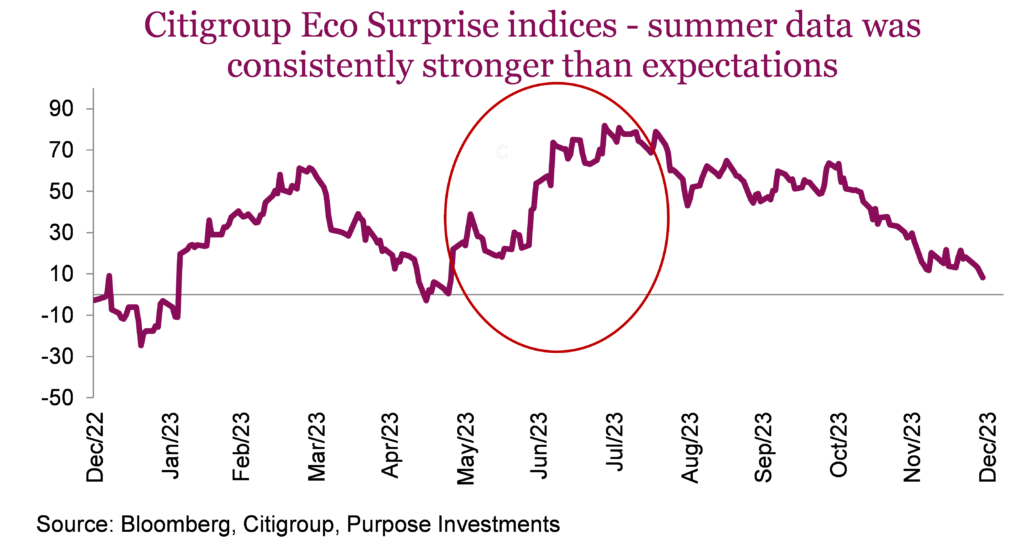
Barbie & Swifties save the economy – Of course, this is an exaggeration, but as the market advance entered the summer months the resilience of the economy was on full display. The recession talk that became louder during the bank failures gave way to a soft landing and then a no-landing narrative.
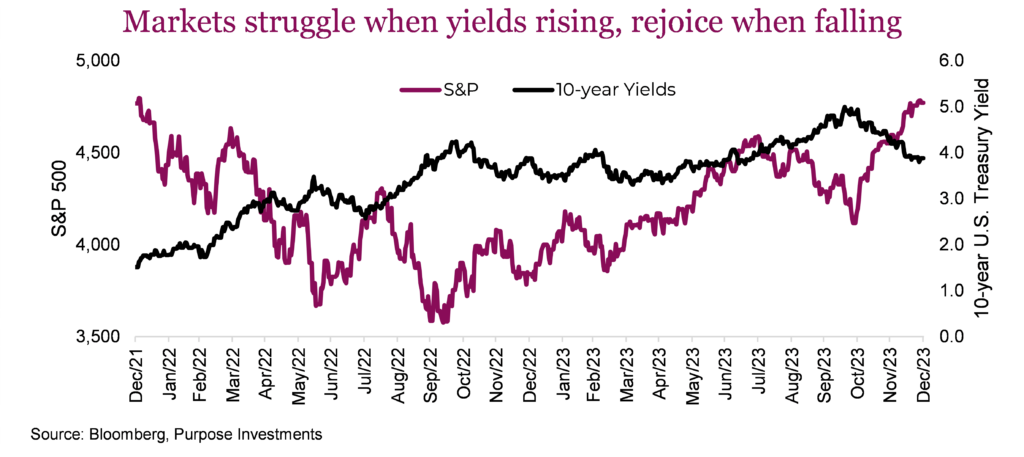
Too much good news – All this good economic news helped global equity markets rally into the middle of summer before the good news became bad for the markets. Bond yields were on the rise, and when the 10-year U.S. Treasury yield moved firmly above 4%, equity markets began to suffer. Yields didn’t stop rising around 4%; they marched up to 5% due to better economic conditions and a very heavy government issuance schedule following debt ceiling dances.
This led to three consecutive down months, dragging global equities down a bit over 10% from the high at the end of July. As it was primarily rising yields that were the culprit, this was especially painful for dividend-paying companies. More on that later.
But Santa delivered – Once yields started to come back down, thanks to softer economic data and cooling issuance of bonds, it was an “everything up” rally. Bonds moved higher, credit spreads fell, and equities rocketed higher. Let’s call it the cherry on top of a great year. Inflation data continued to improve, and central bankers backed off their rate-hiking ways. They were certainly late to start hiking to combat inflation; next year, we will learn if they were late to stop as well.
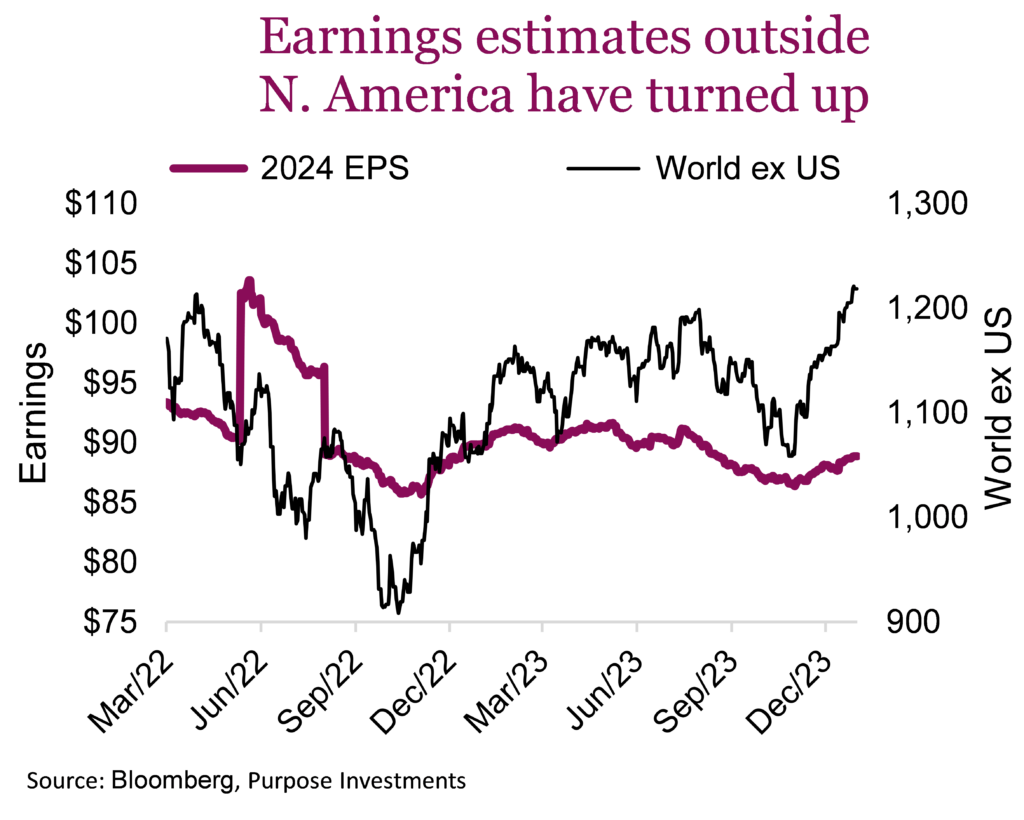
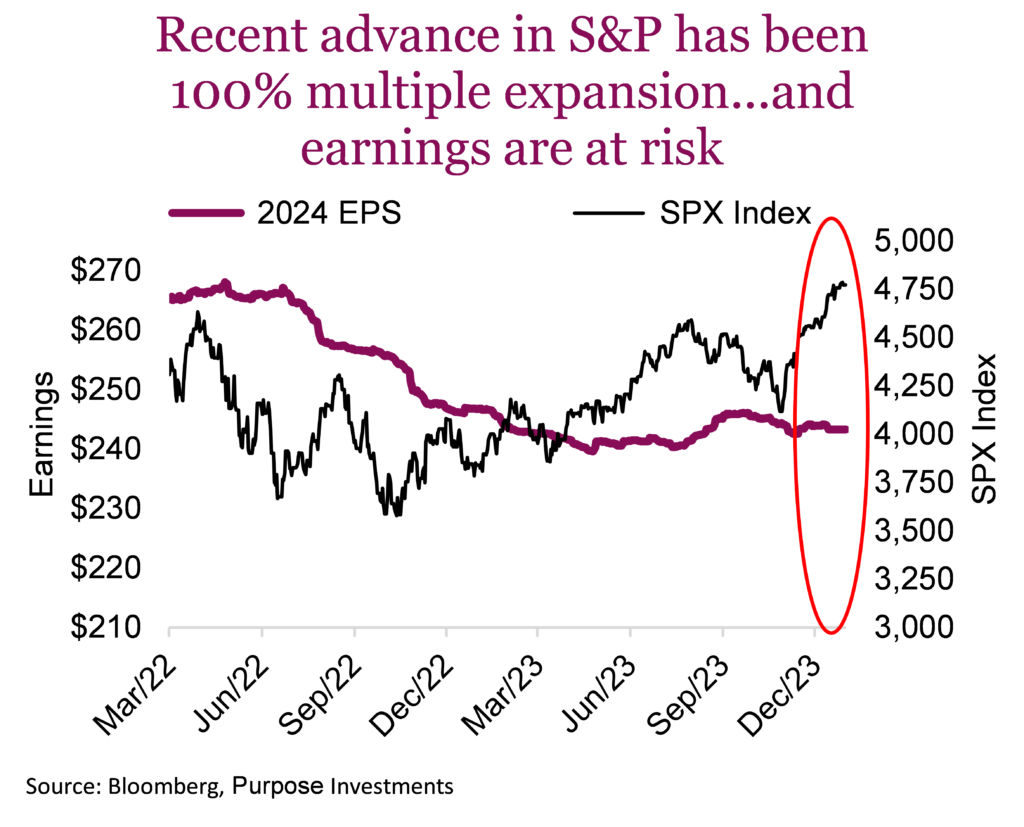
For North American equities, this rally into year-end has been 100% multiple expansion. Earnings estimates for the S&P 500 have not turned up at all and have actually been coming down for the TSX. Globally, things are a bit better with some positive earnings revisions, but nothing compared to the rally in the market.
Multiple expansion can be expected when yields come down, expectations for overnight rate cuts build and inflation becomes tamer. The challenge is multiple expansion is a zero sum game in the long run. In some periods it goes up and then in some it comes down. The market will need more positive earnings momentum to backfill this market advance, or it will remain at risk in 2024.
Year of surprises
It is challenging trying to look back and determine what was most surprising during the year. Below we have highlighted a few contenders:
War – Rising geopolitical risk was certainly a surprise in 2023. Equally surprising was the muted response by markets.
Economic resilience – The global economy proved to be more resilient to higher rates than most had expected. One would not expect to see mortgage rates where they are today paired with record home prices (U.S. prices; a little bit weaker here in Canada). Or consumer spending rising steadily despite higher rates and inflation.
Markets – Remember the adage “Don’t fight the Fed.” Well, since the Fed started raising rates in March of ’23, the S&P 500 has annualized 8% with global equities annualized at 6%. Perhaps the surprise of equity markets is greatest amongst those who attempt to forecast such things. The S&P 500 started 2023 at 3,840, and the average year-end target among strategists was a mere 4,078. Given the index finished at 4,770, that is a miss of about 700 points. Funnily enough, in 2022, they missed even more in the other direction with a year-end target of 4,950, which turned out to be over 1,000 points too optimistic. Bytheway, the consensus for 2024 year-end is 4,830 or only 50 points higher than current levels.
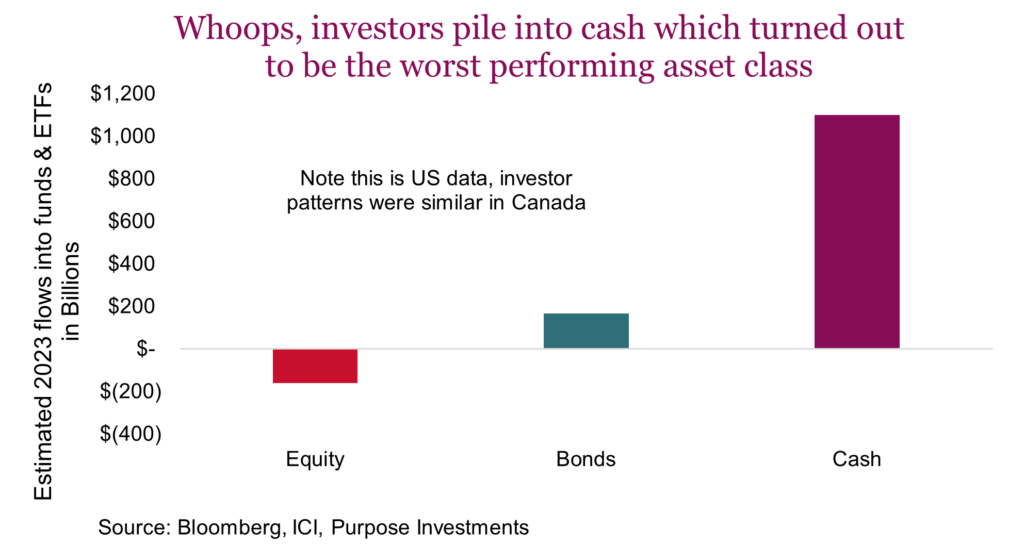
Whoops – No denying the destination of the majority of new money coming into the market in 2023 landed in the ‘cash’ bucket. Maybe it was just bank deposits moving to a higher-yielding vehicle, but there was a common theme of new money being diverted into cash products. The attractiveness of a 4-5% yield, with virtually no risk was appealing. “Getting paid to wait” was the common statement. As it turned out, you got paid a bit to watch other asset classes rise more.
Digging deeper into the numbers
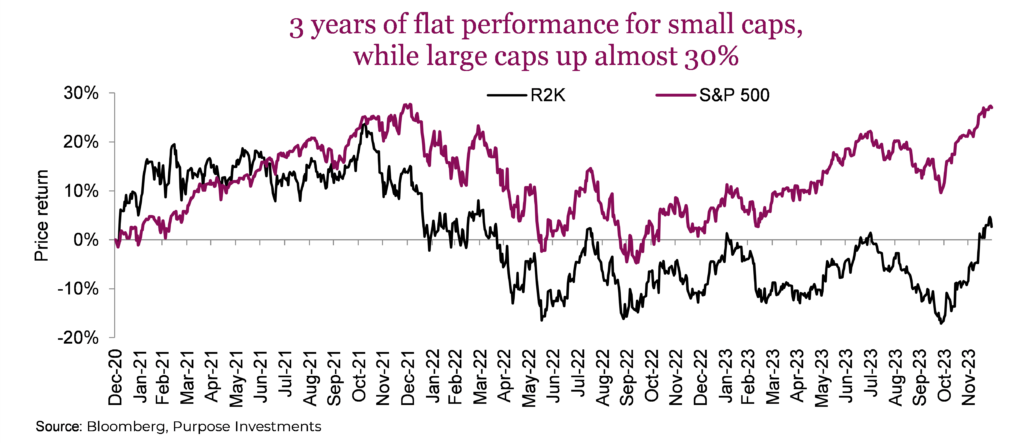
Let’s start with the leader, America. The S&P 500 posted a 26% return, but there are some interesting takeaways beneath the surface of the headline numbers. The S&P 500 is more concentrated today than arguably any point in its history, or at least rather close to its record. The top ten of the 500 carry a combined weight of 32% of the market capitalization-weighted index, with five of those companies carrying valuations north of a trillion. Even more impactful, the top 10 contributors to the S&P 500’s return this year represented 17.5% of the 26.3% gain, or about two thirds.
If you weren’t in the megacap names in the U.S., you didn’t enjoy nearly as pleasant a year. This can be seen, magnified, by comparing the S&P 500 vs the smaller cap Russell 2000 (R2K). The gap between these lines widened in 2023.
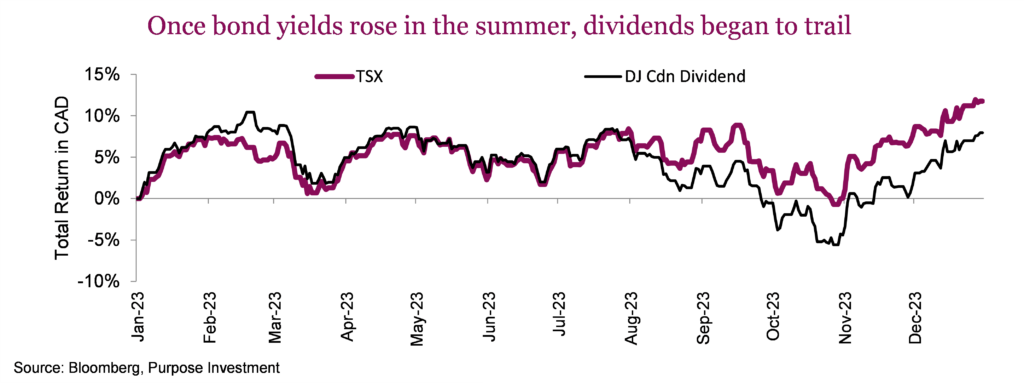
The TSX, which generally is less diversified than the S&P 500, also suffered from narrow leadership. The index returned 12% for 2023, and a little over 7% of that gain came from the top 10 contributors. The good news is that the top 10 were from a variety of different sectors, unlike the U.S., with a big technology name dominance. The bigger story in Canada was the dividend factor.
The Dow Jones Canada Select Dividend index and the broader TSX were lock-in step until bond yields began to rise in August. Higher yields weighed on dividend companies to a greater extent, leading to the divergence. The fall in yields during the past couple of months of the year saw this spread narrow a little, but not much. The dividend factor was a drag on performance in 2023.
Two-year round trip
We all naturally suffer from recency bias. This year, for all those with not enough U.S. equity market exposure (in the right part of the U.S. equity market, that is), it’s been a drag. Too many dividend-paying companies lagged in markets. Or how about bonds? Sure they were up in 2023, but down big in 2022. We don’t need to look back far to see a much different environment. In fact, 2023 turned out to be kind of a mirror of 2022.
Looking at index returns for U.S., Canadian, and International equities plus Canadian and U.S. bonds, the biggest losers in ’22 were often the biggest winners in ’23. The biggest drop in 2022 was U.S. equities, which took the top spot this year. Canadian equities suffered the least in ’22 and gained the least in ’23 (+12% is hardly something to cry about). Bonds, too, bounced back, albeit not totally offsetting the declines of 2022.
So, whether you were growth, balanced or conservative, you likely ended up at the same place after two years. The chart below is based on a range of asset allocations using index returns. Those numbers at the end of each line are the two-year annualized return for each … meh.
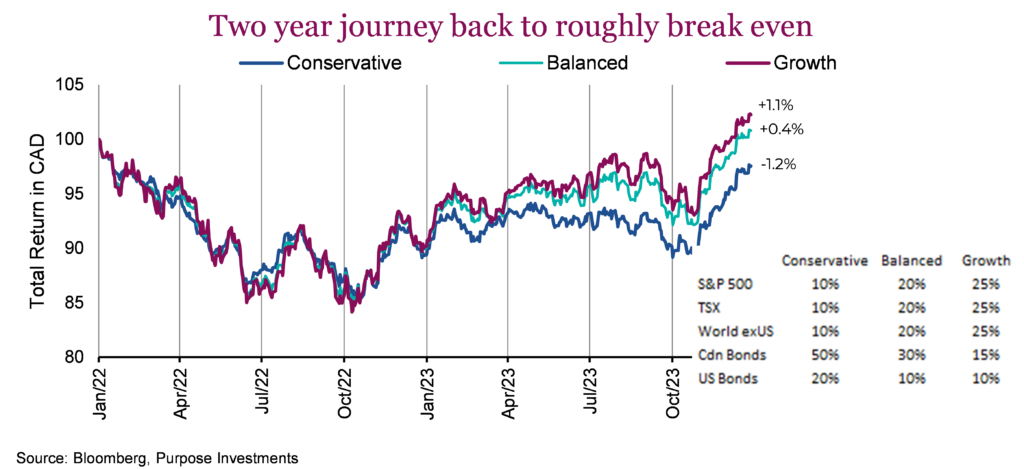
This is how markets work; sometimes returns are abundant, sometimes not so much. We should also point out one other way in which 2022 was rather unique, bond yields were resetting or, dare we say, normalizing. This made bonds and equities move together. As you can see, whether conservatively allocated or more growth allocated, the 2022 path was similar. The good news is in 2023, markets behaved more normally. Growth did better than balanced, which did better than conservative, with greater volatility for growth vs conservative. Asset allocation works, it may have taken a break in 2022, but it is back.
Final Thoughts
When the global neutral balanced fund/ETF category returns 9.8% (prelim), it’s a good year. The good surprises, such as inflation coming down, central banks pausing, and a resilient economy, were bigger than the negative surprises. Maybe 9.8% will be enough to lure some of that cash hoard sitting in money market funds into risk assets? Hopefully not, as the performance track record of investor flows is more of a contrarian indicator.
2024 will likely be another challenging year. Past rate hikes are still making their way through the economy, sentiment has turned overly bullish, and valuations are elevated. This does leave the lingering question: did the rally to finish 2023 steal returns from 2024? We will see.
Sign up here to receive the Market Ethos by email.
Source: Charts are sourced to Bloomberg L.P., Purpose Investments Inc., and Richardson Wealth unless otherwise noted.
The contents of this publication were researched, written and produced by Purpose Investments Inc. and are used by Richardson Wealth Limited for information purposes only.
*This report is authored by Craig Basinger, Chief Market Strategist at Purpose Investments Inc. Effective September 1, 2021, Craig Basinger has transitioned to Purpose Investments Inc.
Disclaimers
Richardson Wealth Limited
The opinions expressed in this report are the opinions of the author and readers should not assume they reflect the opinions or recommendations of Richardson Wealth Limited or its affiliates. Assumptions, opinions and estimates constitute the author’s judgment as of the date of this material and are subject to change without notice. We do not warrant the completeness or accuracy of this material, and it should not be relied upon as such. Before acting on any recommendation, you should consider whether it is suitable for your particular circumstances and, if necessary, seek professional advice. Past performance is not indicative of future results. The comments contained herein are general in nature and are not intended to be, nor should be construed to be, legal or tax advice to any particular individual. Accordingly, individuals should consult their own legal or tax advisors for advice with respect to the tax consequences to them.
Richardson Wealth is a trademark of James Richardson & Sons, Limited used under license.
Purpose Investments Inc.
Purpose Investments Inc. is a registered securities entity. Commissions, trailing commissions, management fees and expenses all may be associated with investment funds. Please read the prospectus before investing. If the securities are purchased or sold on a stock exchange, you may pay more or receive less than the current net asset value. Investment funds are not guaranteed, their values change frequently and past performance may not be repeated.
Forward Looking Statements
Forward-looking statements are based on current expectations, estimates, forecasts and projections based on beliefs and assumptions made by author. These statements involve risks and uncertainties and are not guarantees of future performance or results and no assurance can be given that these estimates and expectations will prove to have been correct, and actual outcomes and results may differ materially from what is expressed, implied or projected in such forward-looking statements. Assumptions, opinions and estimates constitute the author’s judgment as of the date of this material and are subject to change without notice. Neither Purpose Investments nor Richardson Wealth warrant the completeness or accuracy of this material, and it should not be relied upon as such. Before acting on any recommendation, you should consider whether it is suitable for your particular circumstances and, if necessary, seek professional advice. Past performance is not indicative of future results. These estimates and expectations involve risks and uncertainties and are not guarantees of future performance or results and no assurance can be given that these estimates and expectations will prove to have been correct, and actual outcomes and results may differ materially from what is expressed, implied or projected in such forward-looking statements. Unless required by applicable law, it is not undertaken, and specifically disclaimed, that there is any intention or obligation to update or revise the forward-looking statements, whether as a result of new information, future events or otherwise.
Before acting on any recommendation, you should consider whether it is suitable for your particular circumstances and, if necessary, seek professional advice.
The particulars contained herein were obtained from sources which we believe are reliable but are not guaranteed by us and may be incomplete. This is not an official publication or research report of either Richardson Wealth or Purpose Investments, and this is not to be used as a solicitation in any jurisdiction.
This document is not for public distribution, is for informational purposes only, and is not being delivered to you in the context of an offering of any securities, nor is it a recommendation or solicitation to buy, hold or sell any security. Richardson Wealth Limited, Member Canadian Investor Protection Fund.
Richardson Wealth is a trademark of James Richardson & Sons, Limited used under license.