
Sign up here to receive the Market Ethos by email.
September 2023.
Investor Strategy.
Executive summary
- Summer doldrums set in
- AI to the rescue (again)
- Why moderate overweight international equities
- Market cycle
- Portfolio positioning
- The final word
August was a difficult month for both stocks and bonds. Rising rates tightened financial conditions and sent both asset classes into the red. At one point, the S&P 500 was down nearly 6% from the July highs. August is just the second down month this year for the S&P 500, and yet again, we have AI to thank for the rescue.
Summer doldrums set in
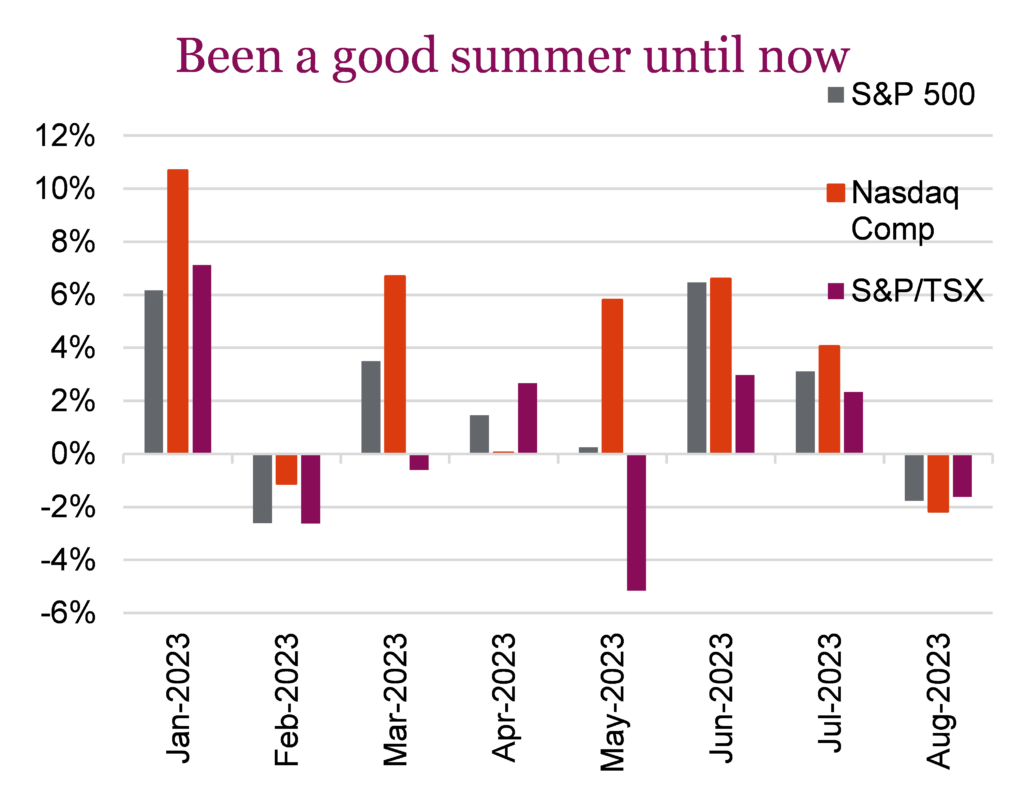
All major North American indexes finished lower for August, despite markets seeing a late-month rally buoyed by economic data that suggested central banks could soon end their tightening campaigns. In particular, the S&P 500 and the Nasdaq Composite finally had a losing month after five straight months in the green. On a total return basis, the S&P/TSX finished -1.4% lower for the month, with Consumer Discretionary, Utilities, and Financials the biggest drag on the index. Bank earnings weighed on the TSX, with many of the big banks failing to beat earnings estimates as they set aside more funds for bad loans. The one area that did not falter was the Energy sector which benefited from rising oil prices, with WTI up over 25% from a low earlier this year. Equities in the U.S. also declined in August, with the S&P 500, Nasdaq, and Dow all falling -1.6%, -2.1%, and -2.0 respectively on a total return basis. Bond investors also did not get the reprieve they were hoping for, with the FTSE TMX Universe Bond Index posting -0.18% and the U.S. Aggregate Bond Index at -0.64% for the month of August.
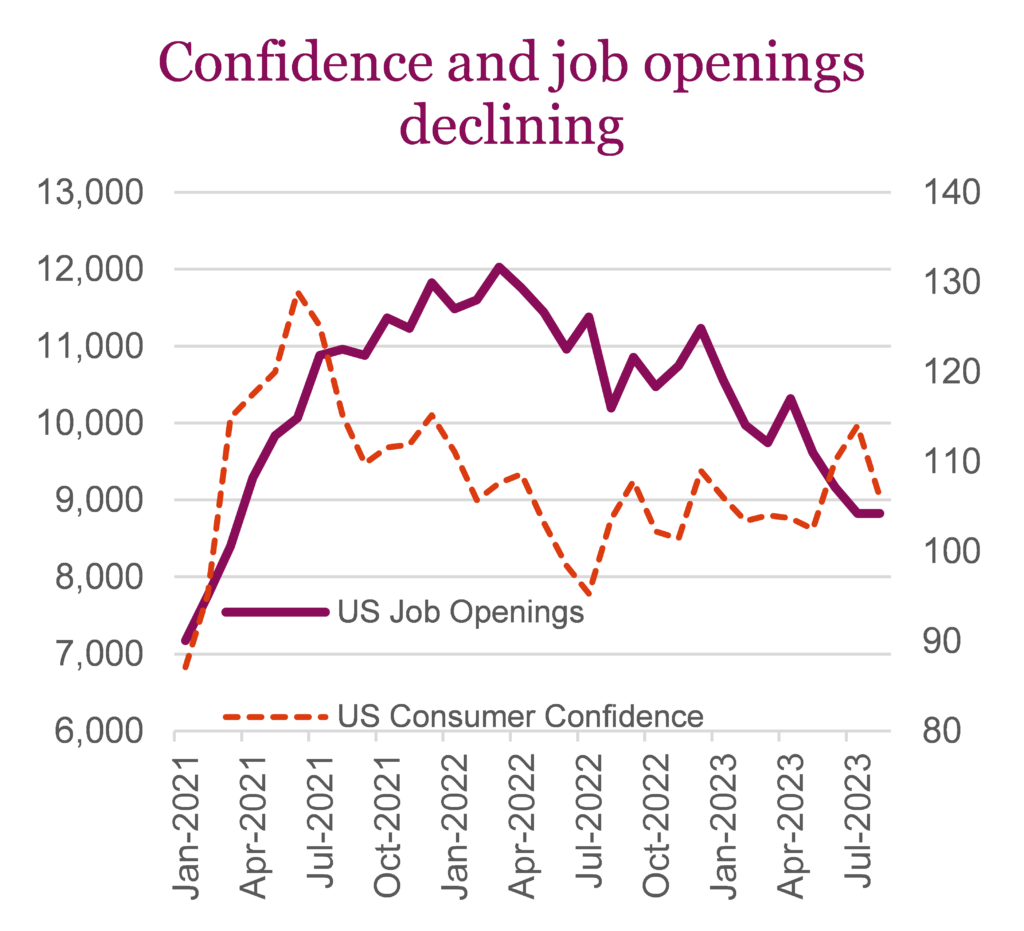
Still, the U.S. economy continues to display resilience, with slowing inflation and a softening labour market, emboldening markets to consider that a soft landing is indeed possible. Since peaking at 9.1% YoY in June 2022, the U.S. CPI fell to 3.2% in July. The number of U.S. job openings fell during July to the lowest level since early 2021, marking the sixth decline in the past seven months, as demand for workers continues to cool. American consumer confidence also dropped in August by the largest percentage in two years, pushed down by multiple factors including higher borrowing costs, elevated gasoline prices, and fewer job opportunities. The Fed has addressed these factors as major contributors to inflation, and with these declines, many believe that that Fed is nearing the end of their tightening campaign.
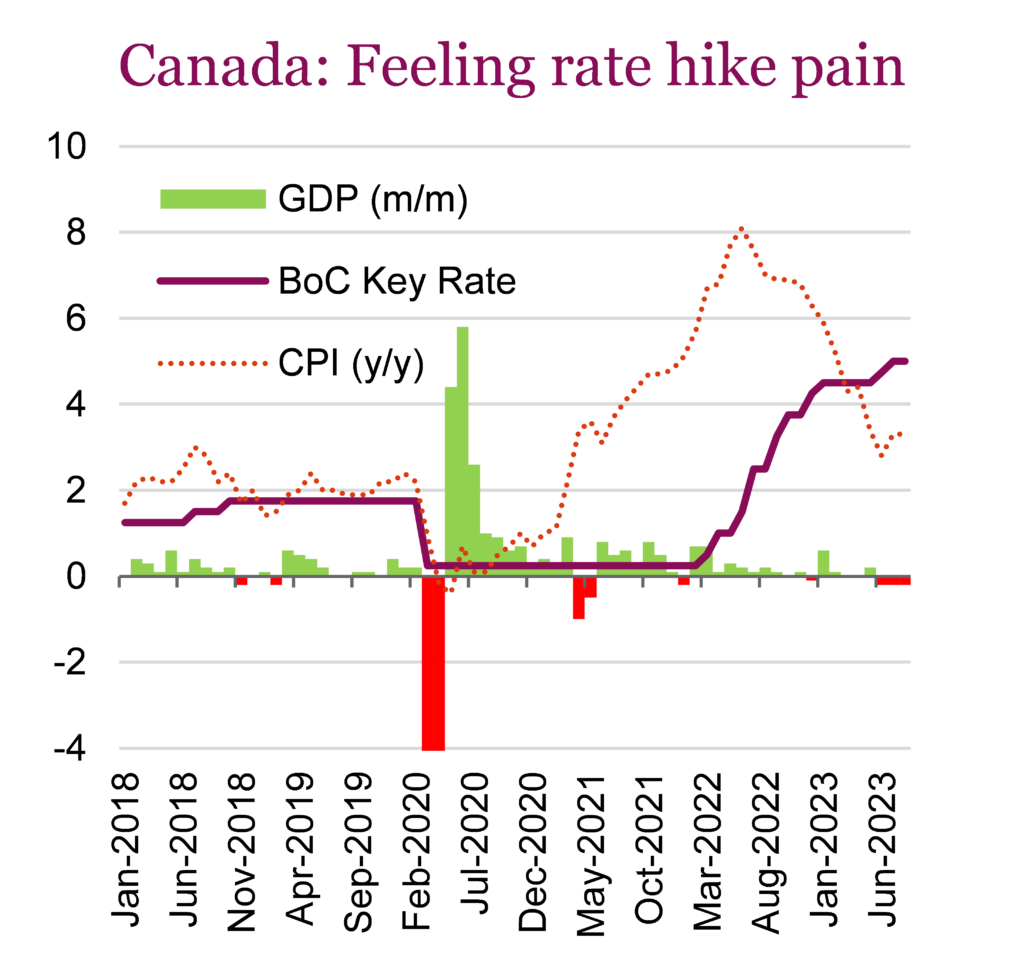
Investors in Canada are also remaining hopeful that the Bank of Canada (BoC) will soon end their aggressive rate hike campaign. Canada’s job market is showing signs of softening as job vacancies decreased by 1.2% to 753,400 in June, their lowest in over two years, while the job vacancy rate also eased to 4.2%. Canada’s GDP data is supporting the case for a BoC pause, after Stats Canada reported that the economy had a weak start to the second half of the year. Preliminary data indicates that GDP was flat in July, following a -0.2% contraction in June. Overall, the economy shrank at a -0.2% annualized pace in the second quarter. With the economy entering a softer patch, the central bank is expected to hold rates steady September 6, following 25 bps hikes in June and July that brought the overnight lending rate to 5.0%.
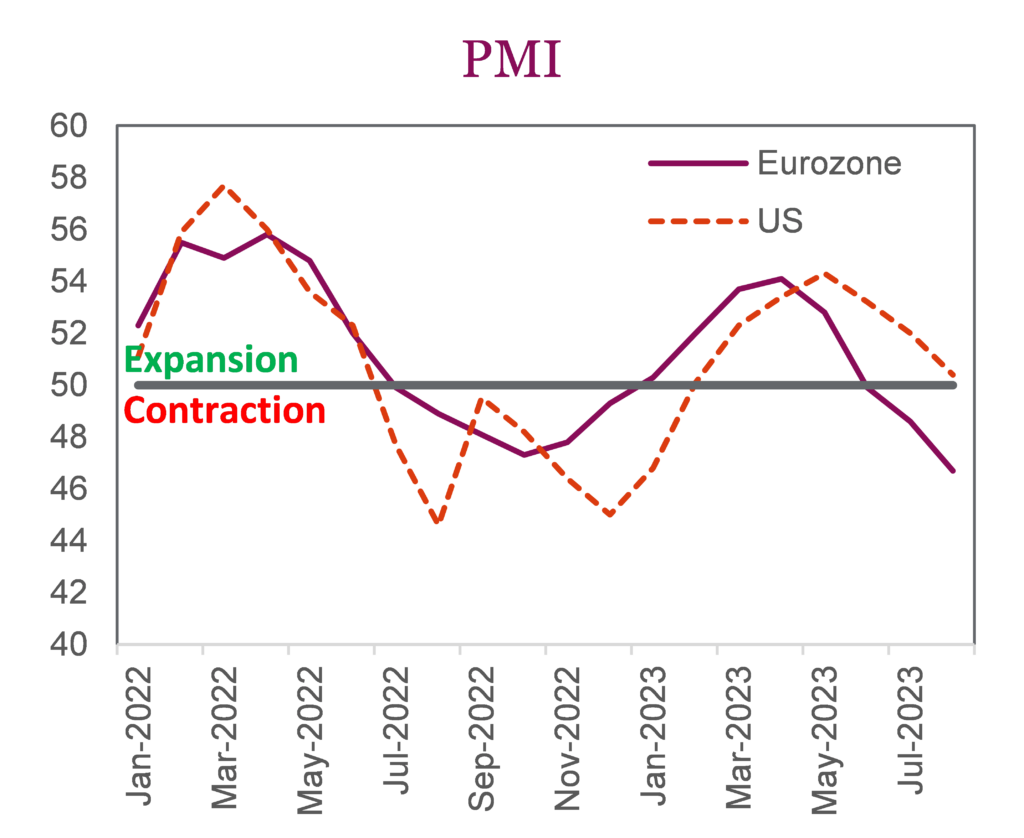
The eurozone is facing economic challenges as its economic activity has declined to the lowest levels since November 2020, with the Eurozone PMI falling to 47 in August, indicating a contraction in economic activity. This weak data suggests a possible pause by the European Central Bank (ECB) at its upcoming September meeting. However, the data also highlights rising sector input cost inflation due to wage pressures, which could prompt further tightening beyond the ECB’s current stance. In addition, mixed inflation readings across Euro-area countries add complexity to the ECB’s decision-making process, with some countries reporting high inflation rates while others see a slowdown in core inflation.
AI to the rescue (again)
August was a difficult month for both stocks and bonds. Rising rates tightened financial conditions and sent both asset classes into the red. At one point, the S&P 500 was down nearly 6% from the July highs. August is just the second down month this year for the S&P 500, and yet again, we have AI to thank for the rescue. In perhaps one of the most anticipated earnings announcements this quarter, Nvidia blew out street expectations. After an initial wobble, the stock went on to make a new all-time high. The monster quarter helped cap off yet another relatively positive earnings season.
Despite the beat, we’ve seen some discouraging market developments. For the first time since the beginning of the summer, sentiment shifted slightly in favour of the bears. We’ve also seen a slight increase in the number of 52-week lows, but nowhere near the degree seen last fall. Towards the end of August, new highs once again began to outpace new lows.
Increasingly, everyone appears to be piling into the same names, once again with the momentum trade becoming increasingly crowded. Hedge fund exposure to tech mega-cap hit a new high in August. Speculators remain net short of S&P 500 futures. The change in position over the past few weeks has been minor, but the current standing remains quite a shift from the extremely bearish positioning a handful of months ago.
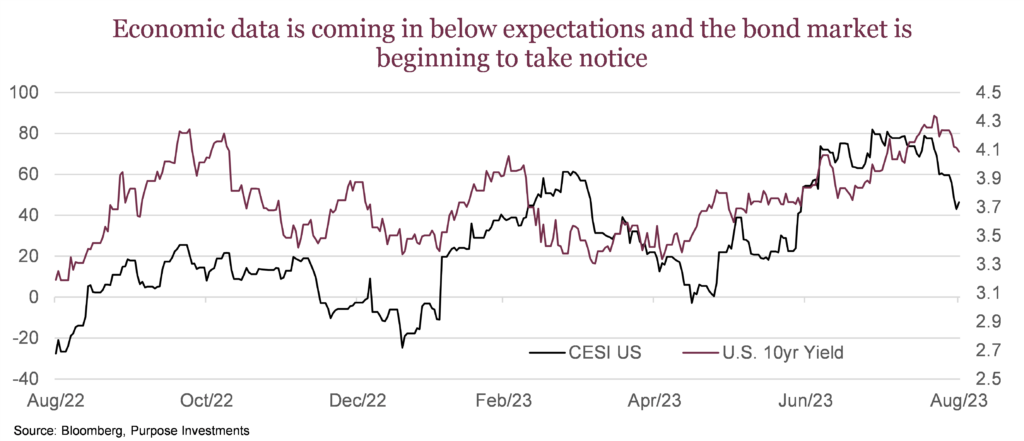
Bond yields in August rose to their highest level since 2007, with US 10-year bond yields hitting a high of 4.36%. They’ve now retreated into month-end, having almost completed the round trip after the anxiety spike following Fed Chair Jerome Powell’s Jackson Hole speech. Market expectations for yet another rate hike in September for the Fed and BoC rose in August, but with the odds for each around 35%, the market seems more convinced that central banks will be patient and let the current restrictive policy influence the economy, without tightening too much.
Over the past month, concerns that growth is too hot for the Fed already caused some pre-emptive tightening of financial conditions. This helps explain the recent underperformance of many cyclicals.
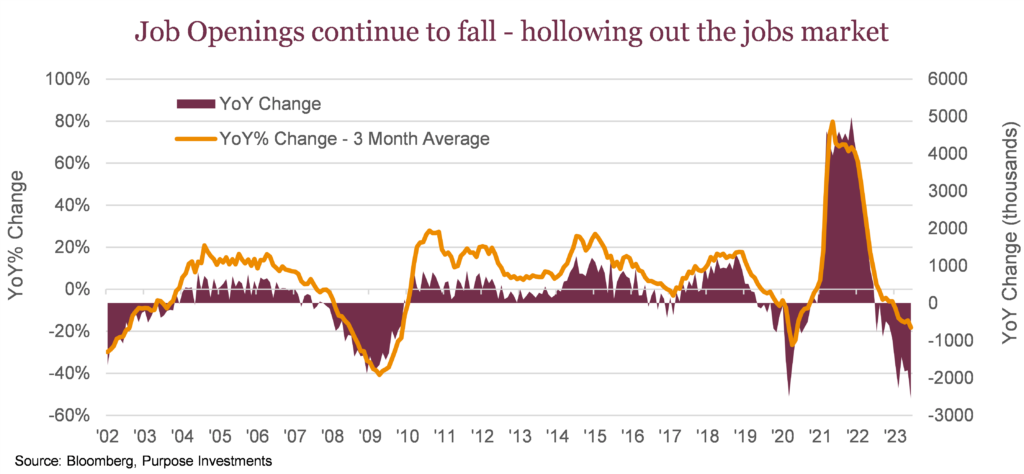
Expectations of a pivot next year are higher, with some interesting data from the jobs market coming out recently. While on the surface, jobs data appears solid, it is hollowing out cyclically. Job openings continue to decline, having reached their lowest level since early 2021. JOLTS Job Openings cratered to 8.8MM versus expectations of 9.5MM. Jobs data is inherently a lagging indicator, but looking at the trend in job openings is useful as it’s an earlier lever a company will pull to when budgets begin to tighten.
The economic surprise indicators are rolling over pretty quickly as expectations for accelerating growth likely got a little optimistic. Levels are important, but it’s where the data comes in relative to expectations that are often more significant. This divergence is worth paying attention to. As we head into the seasonally weak September, we have equities once again catching a bid on falling rates, weak JOLTs data, and consumer confidence. Reasonable in the short term, as bad news is still good news.
The Digital Revolution: AI will power a secular wave of enhanced productivity
Artificial intelligence has reached its “Taylor Swift Era’s Tour” moment – equal in popularity but slightly different in impact. While both will undoubtedly provide boons to the economy, we’ll attempt to make the case here that one might be slightly more productivity-enhancing, accessible, and enduring than the other (Sorry, Swifties …).
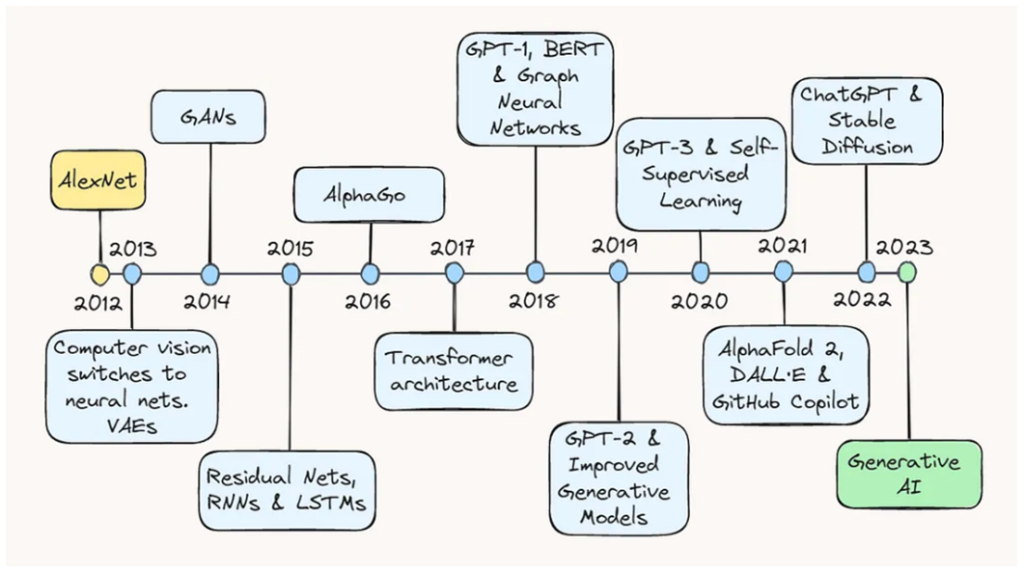
Much like whatever the startup du jour is, AI has been a decades-in-the-making overnight success. Critical researchers in the area of artificial intelligence have been working on this since the 1950s, mostly in the dark, during what insiders have coined the “AI winter.” This was a period where general interest had ebbed and flowed around breakthroughs and breakdowns. It’s tough to get funding when you can’t get people excited.
I’ll skip the full history lesson just to say that AI use cases were mostly isolated to a) Private research-focused organizations and b) Government bodies. There were few use cases of widespread commercial adoption and even fewer engineers working on problems in the field. Fast forward to the past decade, and rapid advancements in the underlying transformer infrastructure have spawned Generative AI and its commercialized application: ChatGPT.
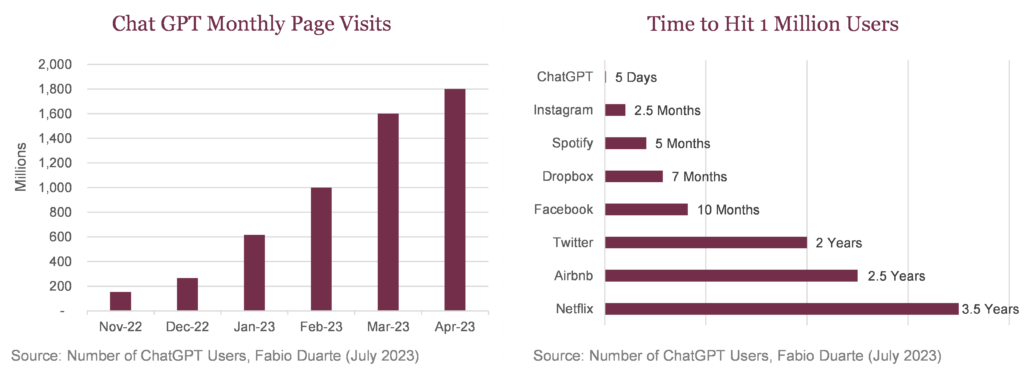
ChatGPT changed the game forever. Instead of AI happening behind closed doors, the general public could now physically touch and feel what artificial intelligence could do, all through a simple prompt box and a clean user interface. As OpenAI’s ChatGPT shattered every new user record, network effects took hold through “plug-ins” and massive amounts of data input. Increasing the volume of prompts strengthened the large language model, which then improved the output – a virtuous productivity-enhancing cycle. Need to write that anniversary card? ChatGPT. Need a shortcut for writing lines of code? ChatGPT.
Every technological leap forward needs two things: 1) A killer use case and 2) Product-market fit. While VR technology is a cool fad that Meta messed up betting most of the company on, it never had a killer use case. Useful applications, latency, and general dorkiness while wearing a headset have proved to be insurmountable hurdles. Some thought a form of augmented reality would be relevant to industrial applications like factory engineers, while others thought maybe this would be useful to medical experts in the operating room. Both are niche applications with small audiences, and they couldn’t even get that right. AI couldn’t be more of the opposite, where use cases have been born from mass digital transformation coalescing wonderfully with productivity-enhancing mass adoption.
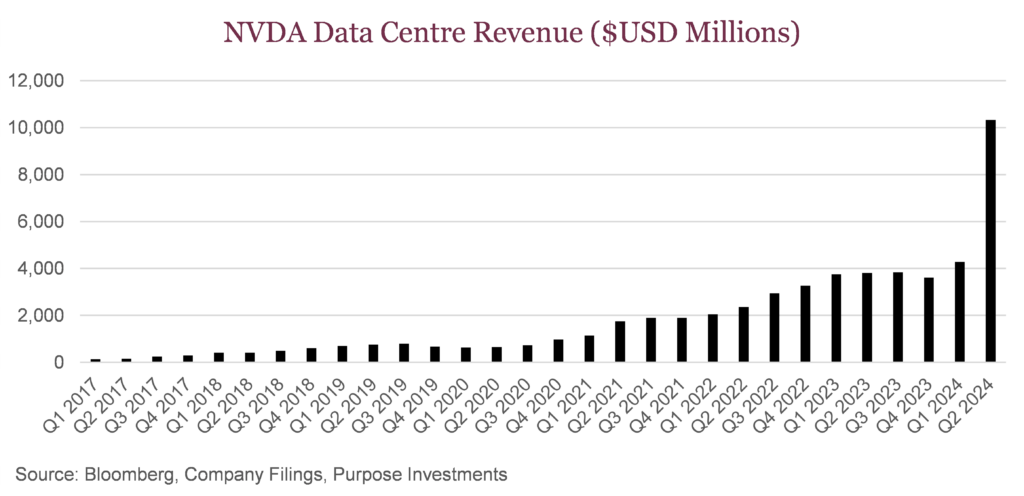
Product-market fit is one of those fancy terms that every venture capitalist says far too many times, but unfortunately, they’re correct. You need the product to come at the right time for the right audience. AI is coming to market in an era where the infrastructure has already been put in place. Cloud players like Amazon Web Services (AWS), Google Cloud Platform (GCP), and Microsoft Azure built the abacus that AI does the math on, and they’re all powered by NVDIA’s platform. Look no further than NVDIA’s most recent quarterly data center revenue to see the coming wave.
So now that we know that this is AI’s time to shine, we need to go back to a critical component of product-market fit. The product. There has to be something to sell. The blog post wars continue to debate whether AI is a feature or a product. It can be “sold” as a feature in terms of increasing the efficiency of an already existing product line, or it can be sold as a product through a standalone SKU.
Microsoft skipped the debate and instead just told everyone that it’s a product (called Copilot), and it is going to cost you 30 bucks a seat per month. There are currently 345 million paid seats using Office 365, and just like that, a product TAM of $120B+ in annualized revenue is born.
Products also need distribution. Right now, software seems like the most viable option for the distribution layer of artificial intelligence. Organizationally, there are already research & development as well as sales & marketing teams in place that are up for the task.
The easiest way to play this theme in the early days will be the large-cap proprietary data companies like Microsoft, Google, Amazon, ServiceNow, and Adobe. These companies have unique data sources that can unlock specific productivity enhancements. But there are also more direct plays in the space that focus on powering and protecting data infrastructure networks through companies like MongoDB, Snowflake, Zscaler, Crowdstrike, and Datadog.
At the end of the day, AI is a tool for productivity enhancement. It will be pervasive across every industry, with the most disruption over the short term to knowledge-based work. While previous revolutions have been industrial, based on physical machine tooling, this era of boosted productivity will be digital. As open-source models become more available to the public, the impacts of AI will ripple throughout the economy.
While you can’t get tickets for the Eras Tour, everyone is welcome to the AI party.
Why moderate overweight international equities?
If your recent memory is dominated by the past decade, nobody would blame investors for shying away from international equities and paying homage to the almighty S&P 500. No denying that in the 2010s, US equities dominated the equity asset class, and the US dollar also did well. We would point out that equity leadership among international markets does tend to oscillate from one decade to the next. In the 80s, it was international; in the 90s, America, the 00s international again, and the 10s America. Does that mean the 2020s are lining up for international? Perhaps. There are certainly a few factors that favour international equities, in addition to it simply being its turn to outperform.
Valuations – Valuations are a common reason used to argue for more global diversification. However, it has become even more stretched over the past few years. Today, the price-to-earnings ratio (PE Ratio) of global equities sits at about 14.6, which is neither overly cheap nor expensive. However, Europe, Asia, and the TSX are 2-4 points below this average, while the US market is 3 points above average.
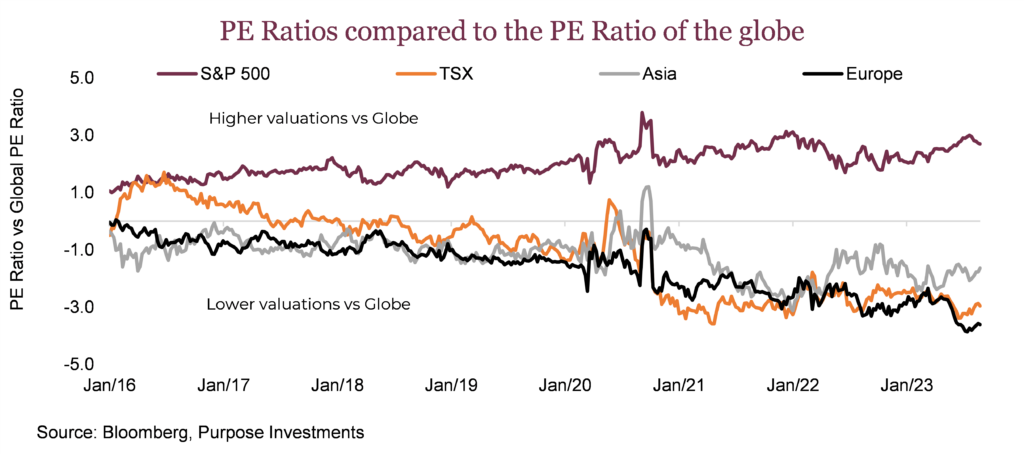
It is fair to point out that the valuations in one market are not always comparable to those in another market. Different composition often leads to sustained differences, like more tech or more value in other markets. But even if you look at regional valuations compared to their multi-decade histories, it paints a similar picture. The US S&P 500 is in the 87th percentile valuation over the past twenty years. The 100th percentile would be the most expensive during the analysis period. Meanwhile, the TSX at 13x is in the 15th percentile, Asia at 14.4x is at the 42nd percentile, and Europe at 12.4x is way down in the basement at its 10th percentile.
Valuations provided a good argument for international diversification in the 2015-2020 time period. Today, this argument is a number of earnings multiples stronger.
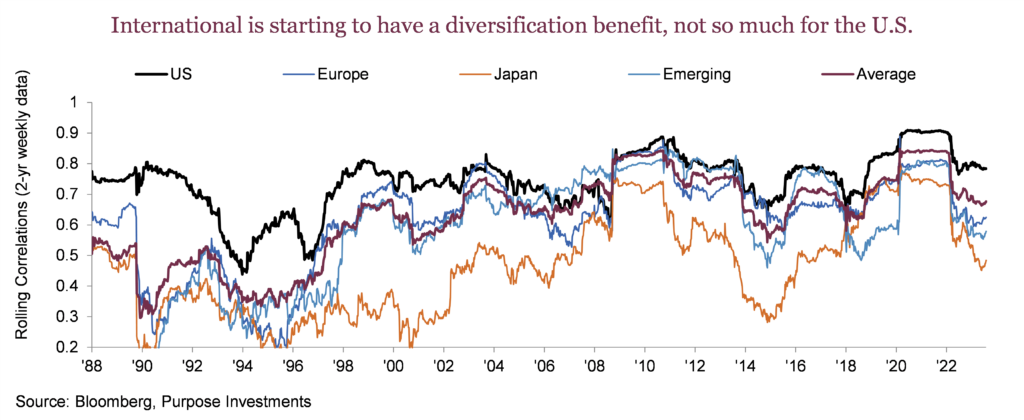
Correlations – Geographic diversification has always been a core tenant of portfolio construction. Unfortunately, it’s been more like geographic ‘diworsification’ over the past cycle. A simple overweight US equities has been the no-brainer portfolio allocation move, as seen in the chart below (hindsight being 20/20 and all). US mega-cap tech has been the global cycle leader, driving US returns over the past cycle to outperform Canadian and international allocations significantly.
Besides the outright dominance of US markets, the past cycle has been characterized by a sustained period of synchronized global growth, which has caused global correlations to rise, decreasing the benefits of international diversification. Higher correlations reduced the benefits of diversifying, but as the chart below shows, correlations have dropped from historically elevated levels. And if global growth is going to become less synchronized and more variable, the benefits of international diversification should continue to rise.
The risk – One aspect that may be counter to this view is if we are heading into a global recession of some sort. While European valuations are certainly priced for a tougher go, that region is more sensitive to variances in global economic growth, given its trade profile. The same holds for Japan, given a large portion of sales for the Nikkei are export related. The truth is, the stars never completely line up, and when they do, it is often too late to do anything because the market has already moved on.
Taken all together, we feel more comfortable having a moderate overweight in international developed markets. If all goes according to plan, we could increase this weighting should better entry points arise due to slowing economic activity. In the meantime, we think the valuations offer a good safety buffer and believe falling correlations with the TSX provide an added benefit.
Market cycle
Market cycle indicators were flat the past month and remain close to a more neutral stance. The yield curve became much less inverted mid-month but retraced some of that gain by month end. US economic indicators remained stable as manufacturing and housing saw no changes. However, we are seeing encouraging signs in the underlying trends for our signals. Fewer of them are getting worse, which is a positive. Recession probability has decreased, and leading indicators are beginning to improve ever so slightly.
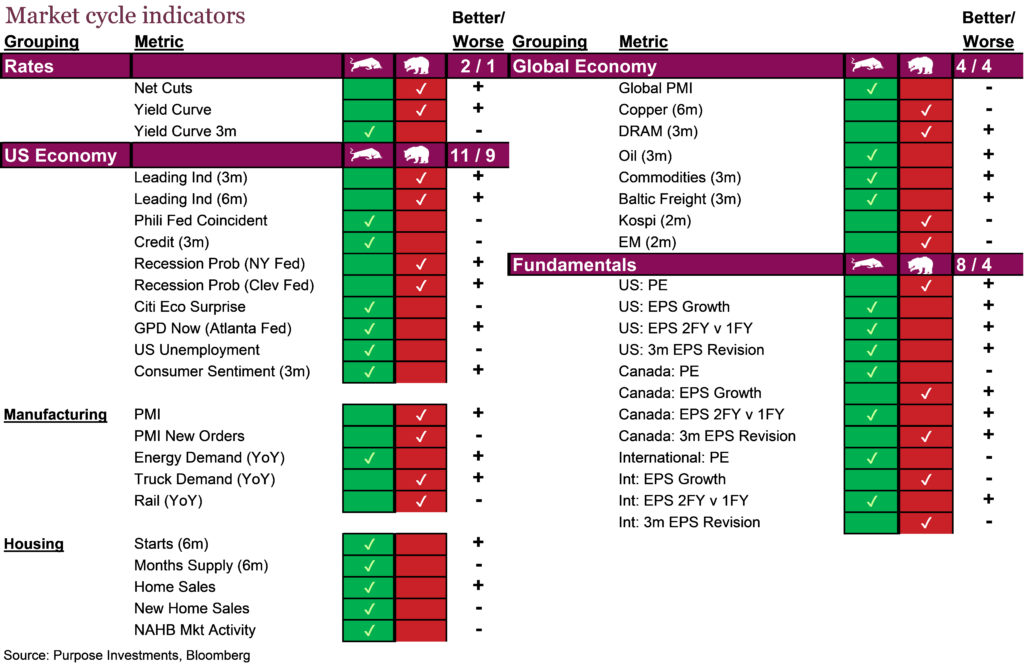
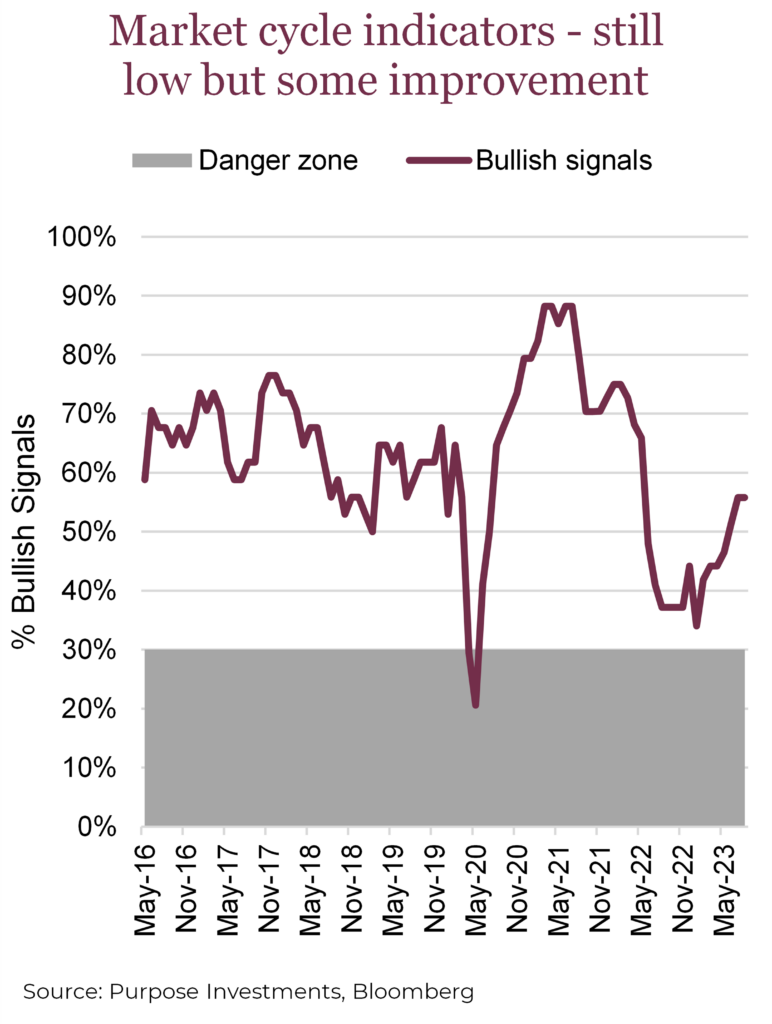
While the overall market cycle is steady, the lone area where we see continued degradation is in the global economy. We’re seeing quite the dichotomy. Oil has moved into the bullish camp along with the broad commodity complex, and we’re seeing some positive trends for copper. However, both the Kospi and emerging markets moved into bear territory. It’s easy to peg the blame on China for the emerging market wobble. The debt risk across Chinese property developers is material and could give way to a wave of defaults. Unfortunately, there is no easy solution for the government. China property developers are too big to fail, yet also too big for an easy fix.
We’re also seeing some overall improvement across our fundamental metrics. Though earnings per share (EPS) revisions moved negative, the tail end of earnings season continued to impress, with EPS growth going positive in both Canada and the US. Despite the market weakness in August, the fundamentals have not further deteriorated, and the backdrop on balance is positive.
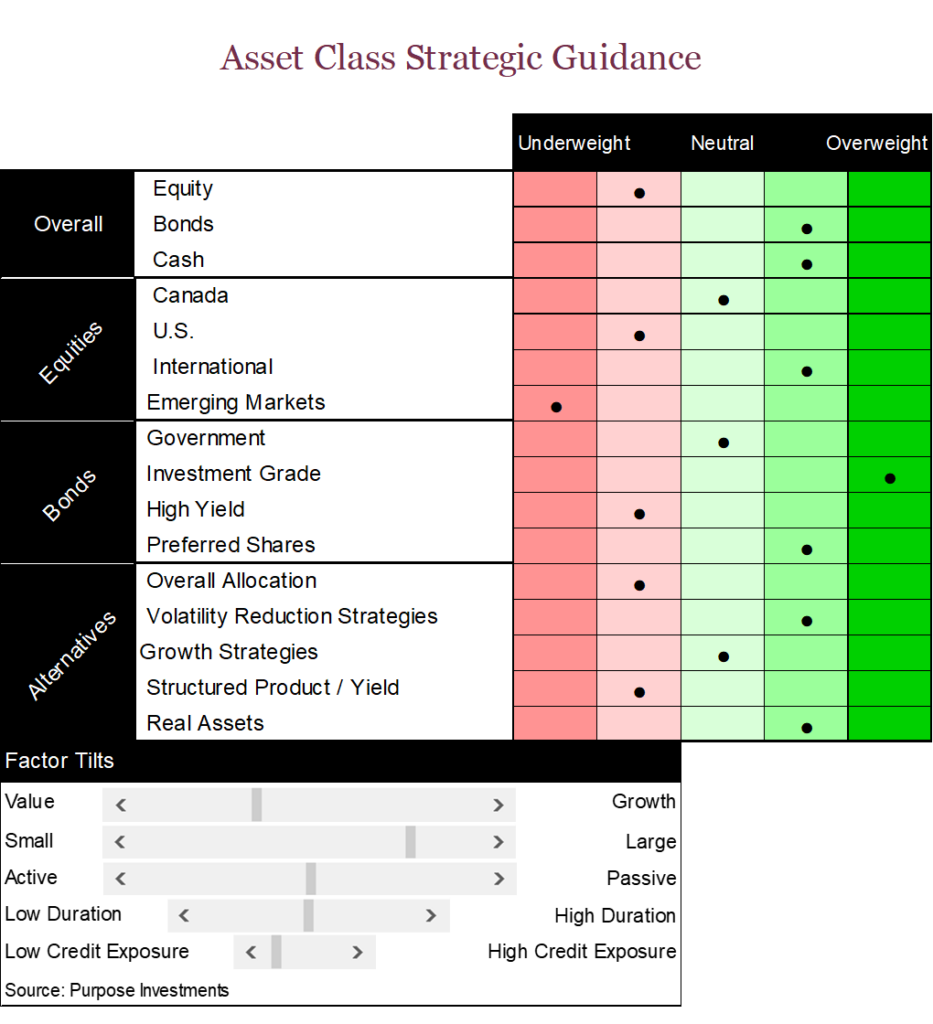
Portfolio positioning
In terms of portfolio positioning, we’ve made no changes this month. After becoming more positive on preferred shares last month, our portfolio position remains unchanged. We remain slightly defensive in equities, preferring safer vehicles with an affinity toward dividend-yielding shares. We remain overweight international share, as you have seen in the section above. Within the fixed income space, we prefer the safety of investment grade bonds and government debt, believing the risk/reward trade-off in the high yield space is not yet tilted in the investor’s favour. Despite the continued sell-off in emerging market shares, we’ve yet to even dip our toe into this asset class. Within alternatives, we prefer real assets and defensive strategies.
The final word
Can defensives work if yields are going up? Rate-sensitive assets managed to resist the downward force of rising yields earlier in the summer, but north of 4% yields once again exerted too much pressure on stocks. We still believe bond yields are likely lower in the medium term, but the current trend has been resilient.
After a mid-month mini spike, the VIX has tumbled back down to its recent lows, with the summer lull back in full effect. However, September has historically been the most volatile and weakest month, so we’d be surprised if this lasts. As we head into the seasonally weak fall months, we prefer to remain defensively positioned across our portfolios. AI came to the rescue in August and reinvigorated the bulls; however, this song, even if AI-generated, can only keep people on the dance floor for so long.
Sign up here to receive the Market Ethos by email.
Source: Charts are sourced to Bloomberg L.P., Purpose Investments Inc., and Richardson Wealth unless otherwise noted.
*Authors:
Purpose Investments: Craig Basinger, Chief Market Strategist; Derek Benedet, Portfolio Manager
Richardson Wealth: Andrew Innis, Analyst; Phil Kwon, Head of Portfolio Analytics; Mark Letchumanan, Research; An Nguyen, VP Investment Services
Disclaimers
Richardson Wealth Limited
The opinions expressed in this report are the opinions of the author and readers should not assume they reflect the opinions or recommendations of Richardson Wealth Limited or its affiliates. Assumptions, opinions and estimates constitute the author’s judgment as of the date of this material and are subject to change without notice. We do not warrant the completeness or accuracy of this material, and it should not be relied upon as such. Before acting on any recommendation, you should consider whether it is suitable for your particular circumstances and, if necessary, seek professional advice. Past performance is not indicative of future results. The comments contained herein are general in nature and are not intended to be, nor should be construed to be, legal or tax advice to any particular individual. Accordingly, individuals should consult their own legal or tax advisors for advice with respect to the tax consequences to them.
Richardson Wealth is a trademark of James Richardson & Sons, Limited used under license.
Purpose Investments Inc.
Purpose Investments Inc. is a registered securities entity. Commissions, trailing commissions, management fees and expenses all may be associated with investment funds. Please read the prospectus before investing. If the securities are purchased or sold on a stock exchange, you may pay more or receive less than the current net asset value. Investment funds are not guaranteed, their values change frequently and past performance may not be repeated.
Forward Looking Statements
Forward-looking statements are based on current expectations, estimates, forecasts and projections based on beliefs and assumptions made by author. These statements involve risks and uncertainties and are not guarantees of future performance or results and no assurance can be given that these estimates and expectations will prove to have been correct, and actual outcomes and results may differ materially from what is expressed, implied or projected in such forward-looking statements. Assumptions, opinions and estimates constitute the author’s judgment as of the date of this material and are subject to change without notice. Neither Purpose Investments nor Richardson Wealth warrant the completeness or accuracy of this material, and it should not be relied upon as such. Before acting on any recommendation, you should consider whether it is suitable for your particular circumstances and, if necessary, seek professional advice. Past performance is not indicative of future results. These estimates and expectations involve risks and uncertainties and are not guarantees of future performance or results and no assurance can be given that these estimates and expectations will prove to have been correct, and actual outcomes and results may differ materially from what is expressed, implied or projected in such forward-looking statements. Unless required by applicable law, it is not undertaken, and specifically disclaimed, that there is any intention or obligation to update or revise the forward-looking statements, whether as a result of new information, future events or otherwise.
Before acting on any recommendation, you should consider whether it is suitable for your particular circumstances and, if necessary, seek professional advice.
The particulars contained herein were obtained from sources which we believe are reliable, but are not guaranteed by us and may be incomplete. This is not an official publication or research report of either Richardson Wealth or Purpose Investments, and this is not to be used as a solicitation in any jurisdiction.
This document is not for public distribution, is for informational purposes only, and is not being delivered to you in the context of an offering of any securities, nor is it a recommendation or solicitation to buy, hold or sell any security.
Richardson Wealth Limited, Member Canadian Investor Protection Fund.
Richardson Wealth is a trademark of James Richardson & Sons, Limited used under license.