
Investor Strategy
September 3, 2024
Don’t go down
Sign up here to receive the Market Ethos by email.
Executive summary
- Rollercoaster August
- Rocky
- Commodities talking, is anyone listening?
- Adapting to a more correlated world
- Market cycle
- Final thoughts
Could the market be running out of levers to help it move higher? Maybe. But one thing is for sure: the amount of money parked in money markets is huge, certainly encouraging the ‘buy the dip’ mentality. This has not been a sleepy summer, so either the seasonal volatility of Sept/Oct came early, or we are just getting warmed up for a wild finish to the year. This is not the time to be chasing, in our view.
Rollercoaster August
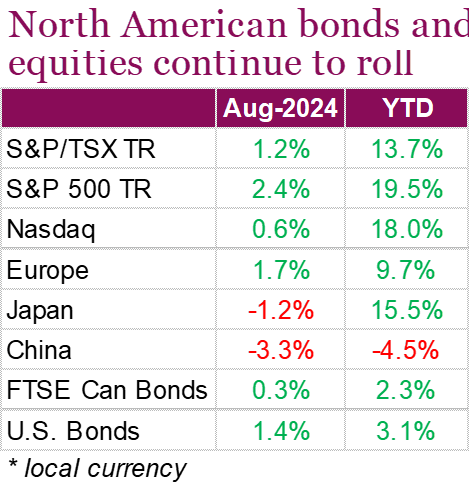
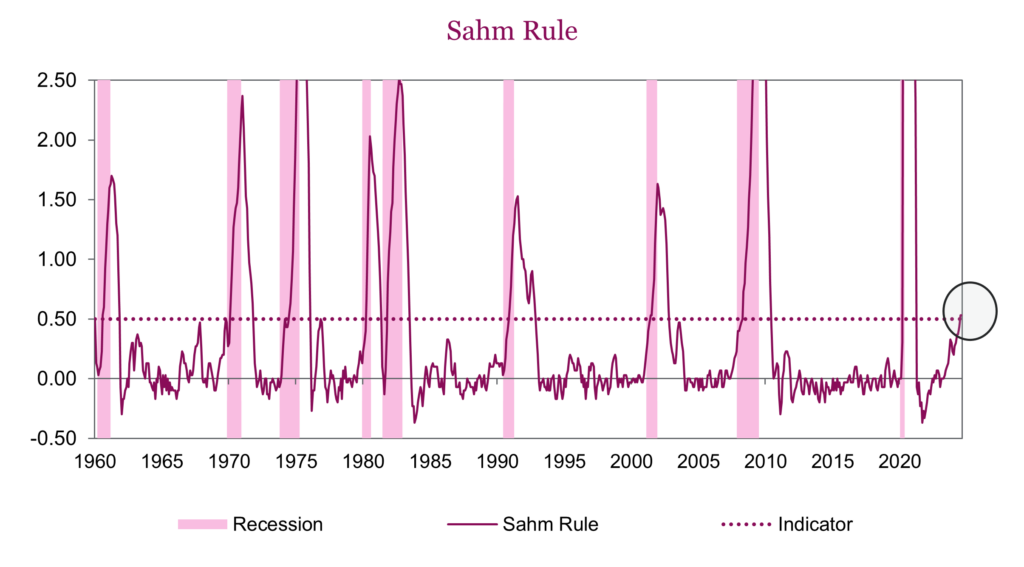
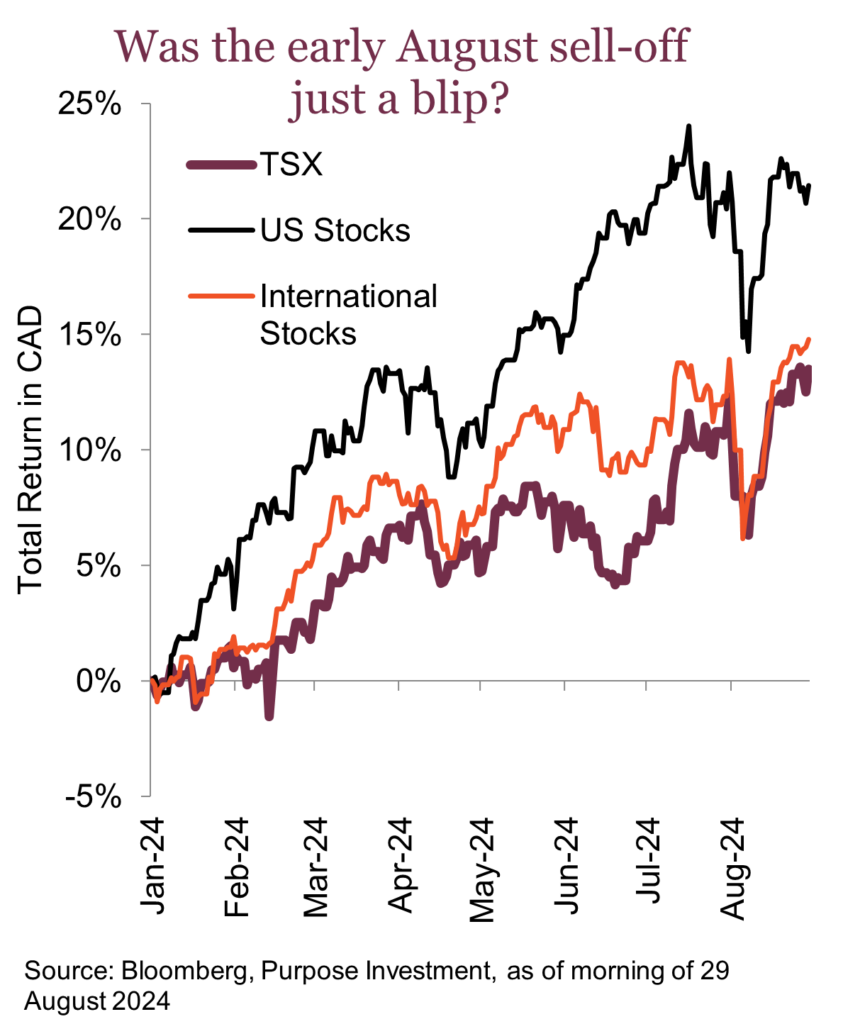
Equities saw a strong but volatile month in August, with the S&P 500 clinching its fourth consecutive winning month; an impressive feat when you consider the index was down more than 6% at the beginning of the month. August began with investors digesting weaker economic data which included a jump in U.S. unemployment that triggered the “Sahm Rule”. The rule states that when the three-month moving average of unemployment is 0.5% above its 12-month low, the economy is in the early stages of a recession. While markets were already on edge from recession fears, the Bank of Japan decided to raise interest rates. Investors who were borrowing in yen and investing in countries offering a higher yield (known as a carry trade) were forced to unwind their trades, which added to the selloff. Despite these two events at the beginning of the month, market sentiment quickly shifted, with equity markets spending the rest of the month recovering towards (and in some cases, above) their previous highs. Overall, the S&P 500 was up 2.4% and the TSX was up 1.2% on a total return basis. Market dynamics began to shift over the month, with sectors outside of the dominant Mag 7 stocks outperforming, highlighting broader market participation and leaving the Nasdaq to lag and finish the month up just 0.6%.
Markets also reacted positively to economic data and central bank talk from the BoC and the Fed. Canada’s annual inflation rate cooled to a 40-month low of 2.5% in July, matching forecasts, and core inflation measures eased as well, keeping the BoC on track to cut interest rates again in September. In the U.S., policymakers met at the annual Jackson Hole Symposium where Jerome Powell gave strong hints that the Fed will begin cutting interest rates at its next meeting. All this left fixed-income investors a little more hopeful, helping Canadian bonds rise 0.3% over the month and U.S. bonds to finish 1.4% higher. The U.S. 10-year treasury yield also remained below 4% after breaking through the level on August 1, another sign that lower rates are on the horizon.
Rocky
How can we characterize the market of late? The analogy that keeps popping into my mind is Rocky fighting Ivan Drago in the twelfth round as his corner keeps yelling: “Don’t go down”. This market is listening. As previously mentioned, at the start of August, markets were a bit fragile from softening economic data, including a jump in U.S. unemployment that triggered the Sahm Rule, which means we are in the early months of a recession. Then, the yen carry trade partial unwind sent markets tumbling on August 5. Since then, markets have recovered to their previous highs. The yen carry trade unwind cooled, and the economic data picked up a bit.
The next hit was Nvidia falling short of lofty “whisper” expectations near the end of August, sending the second-largest member of the S&P 500 down 7-8% in after-hours trading. This had futures indicating a 1-2% drop for the S&P and a much bigger drop for the NASDAQ. But as the next day came, Rocky picked himself up again and got back to it. Nvidia was down only about 2% in early morning trading, with the S&P and NASDAQ up the next day.
August is often a rather strange month, given lower volumes. This can exacerbate moves in either direction, perhaps this year in both directions. The good news is we are seeing broader participation in this advance; it’s not just the mega-cap tech stocks. And earnings estimates globally appear to be gradually revising higher.
For now, the market remains in that happy place. Softer economic data is good news, as inflation will continue to cool. Of course, economic data always oscillates around the truth, but it is worth noting how far bond yields have fallen and how far economically sensitive commodity prices have fallen. If the economic data does soften more, it will become a problem for the equity market. For now, only the bond and commodity traders appear concerned.
A number of levers have helped this market move higher over the summer. Bond yields, such as the 10-year, dropped from nearly 4.5% to 3.9%, which helped market multiple expansion. Expectations for Fed rate cuts, based on the futures market, have risen from 1.8 cuts to 4 by the end of the year. And the U.S. dollar has dropped a lot; in fact, the S&P 500’s 2.3% gain in August is more or less flat in Canadian dollar terms.
Could the market be running out of levers to help it move higher? Maybe. But one thing is for sure: the amount of money parked in money markets is huge, certainly encouraging the ‘buy the dip’ mentality. Rocky just keeps bouncing back up. At some point, this movie will end, but in the meantime, go Rocky!
Commodities talking, is anyone listening?
As we close out another month, it’s hard not to notice the stark divergence between equity and commodity markets. While equity indices are once again pushing toward all-time highs, many key commodity markets are sending a very different signal that investors seem largely ignoring.
Crude oil, traditionally a good measure of global economic health, remains under pressure, reflecting growing concerns over demand. Despite OPEC’s efforts to manage supply, oil prices continue to struggle, down 8% this summer, signaling that commodity traders are increasingly wary of demand projections. Similarly, base metals, which are heavily impacted by industrial and manufacturing activity, are flagging concern. Dr. Copper is still up YTD thanks to the massive AI-inspired surge in the spring, but it has swiftly come back down to earth. We’re seeing a little bounce off the bottom for most base metals, but the trend remains largely directionless. Yes, it’s easy to blame China and its ongoing property woes as the sole reason why commodities are floundering. Still, discounting the easy narrative and focusing more on price should temper rosy expectations for the soft landing and the “everything is ok” narrative. If copper, oil and the rest of the commodity complex are viewed as economic bellwethers, their weakness should be noted.
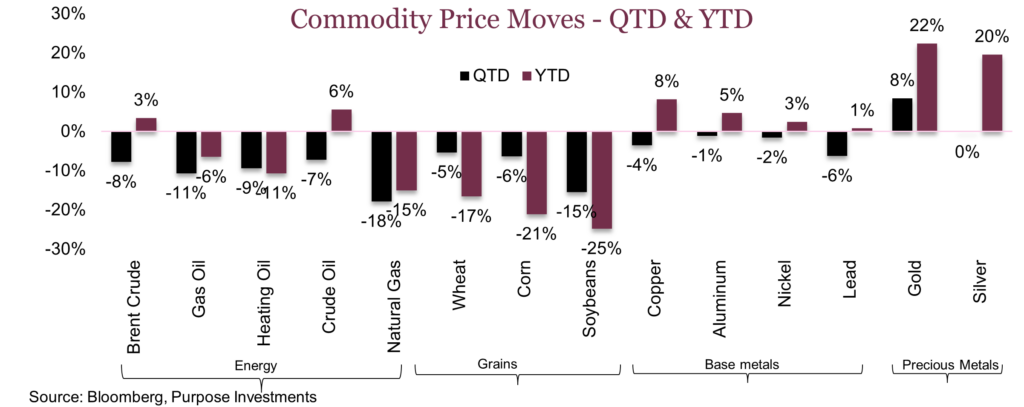
The most depressed segment of the commodity market has been soft commodities. While less tied to economic growth, lower crop prices do impact farm economics. This has carryover effects on equipment and fertilizers. Weather is the largest factor here, and bumper crops around the world have depressed grain prices across the board. Wheat, corn, and soy are all down around 20% YTD and down 50-60% from the record highs of 2022 following Russia’s invasion of Ukraine. Deriving economic signals from the agricultural space is a stretch, but one positive is this should continue to depress food inflation.
In contrast, gold has surged to an all-time high of over $2,500 per ounce. Or over $1 million USD for a bar of gold, if you prefer counting your gold in bars. This rally in gold is not just a reflection of inflationary concerns, central bank buying or lower rate expectations. Gold is the original fear gauge, and interest in it tends to surge during times of distress. Gold is a refuge for investors when worry grows, and the future path becomes murky. This steady appreciation is not a quick flight to safety but appears to be more than that. Perhaps it’s the growing concern in the Middle East, a realization that risks remain elevated in financial markets, or fear the US dollar will decline. The fact that gold is soaring while other commodities struggle only underscores the rising anxiety among those closely tracking global economic trends.
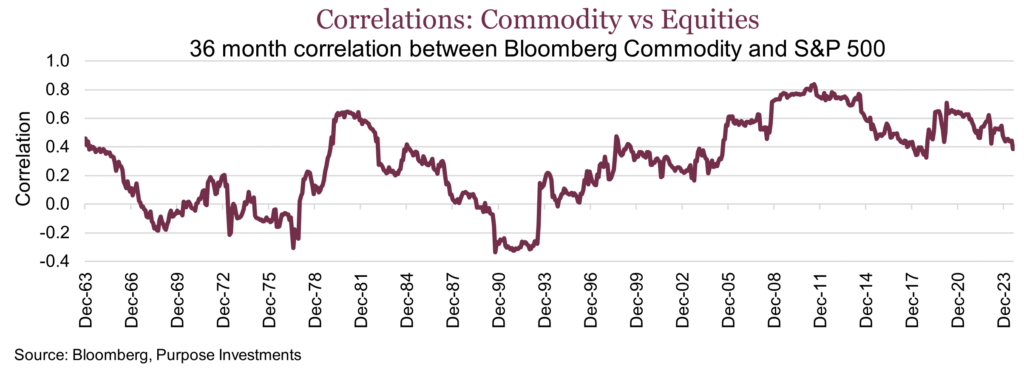
Correlations – The continued decoupling between the S&P 500 and the Bloomberg Commodity Index is an interesting development, particularly as we emerge from a period of historically high correlations. Over the past decade, correlations between equities and commodities were elevated, often moving in tandem as global growth and risk sentiment dictated market behaviour. However, today these correlations have dropped to their lowest levels since 2008, suggesting a shift in market dynamics. This divergence indicates that factors like tech sector dominance and interest rates increasingly drive equity markets. In contrast, commodity markets are more attuned to supply, demand, and economic growth fundamentals. The decoupling is a reminder that, while equities continue to climb, commodity markets reflect a more cautious outlook. For investors, this correlation breakdown is a good thing for portfolio diversification.
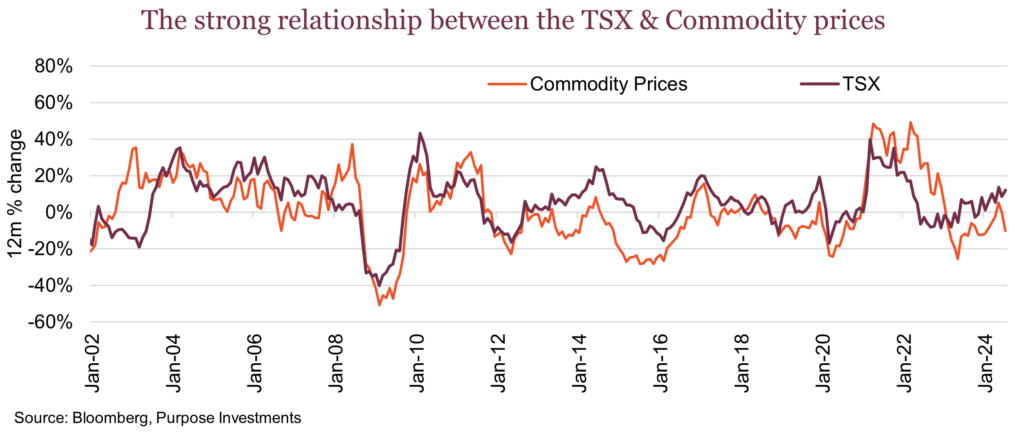
Not surprisingly, the correlation to the TSX is actually quite a bit stronger. Going back to the 60s, it’s been nearly double that of the S&P 500. But the relationship between the TSX and commodities has also been breaking down. The correlation is down to 0.4, and as shown in the chart below, 12-month returns between commodities and the TSX typically move in the same direction. The recent downturn in commodities has had limited impact on the Canadian market.
The divergence: what it means – This divergence between strong equity and struggling commodity markets raises some concern, especially in the Canadian market. Commodity traders are often quick to react to shifts in global demand, clearly signalling caution. They are pricing in weaker growth, heightened risks, and a potential slowdown that equity markets have yet to fully recognize. It could be that the delayed effects of monetary tightening have slowed demand more than headline equity index levels demonstrate. Equity traders, on the other hand, are riding a wave of optimism driven by AI, a handful of strong corporate earnings, and an assumption that looming central bank cuts will support markets. Perhaps it’s simply a mindset difference—where equity traders focus on short-term gains and momentum, while commodity traders take a more demand-driven approach. These markets do not operate in isolation; what impacts one tends to impact the other.
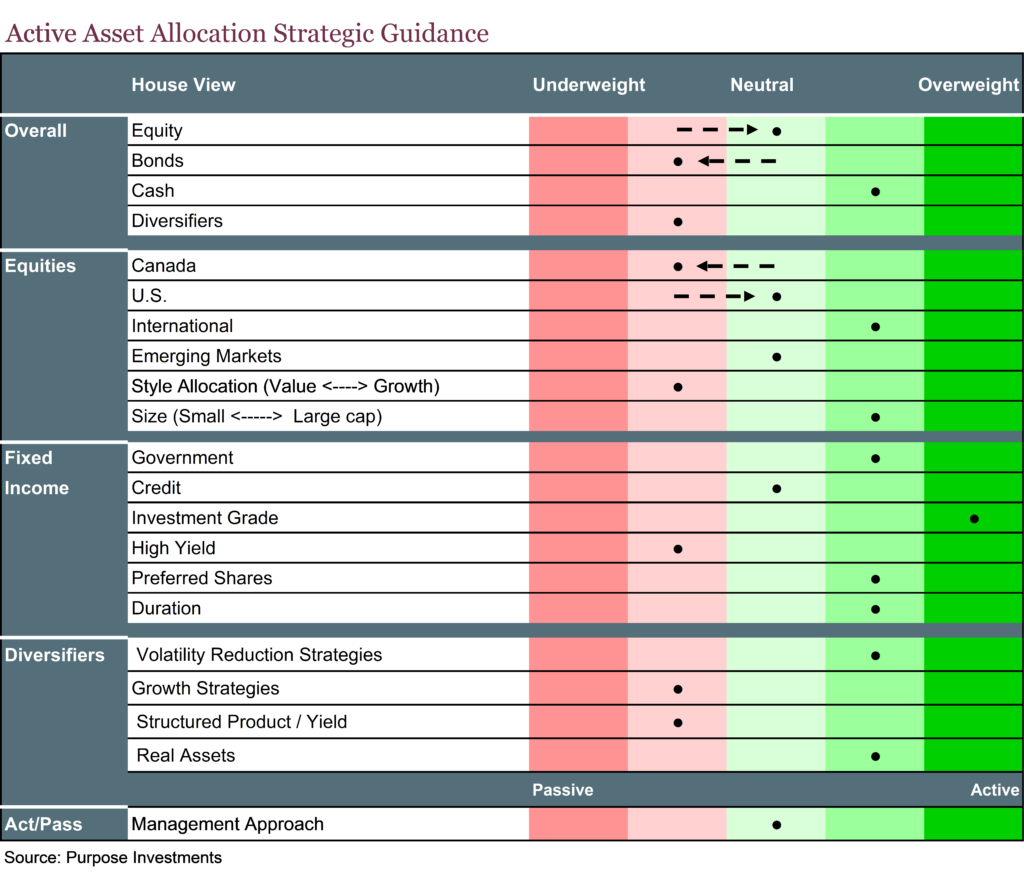
To better align with these signals, investors might consider diversifying their portfolios to include more defensive assets, like gold, or assets/sectors that tend to perform well in late-cycle environments. We’ve recently dialled back on our energy exposure, taking a subtle cue from the commodity and stock market disconnect. The signals from the commodity market are not a giant red flag, but they warrant increased caution.
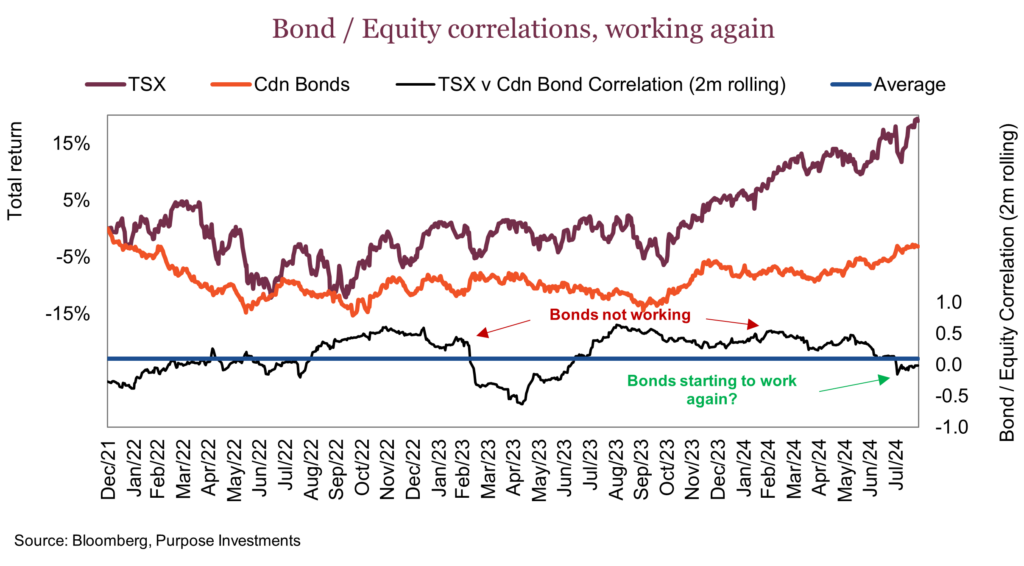
Adapting to a more correlated world
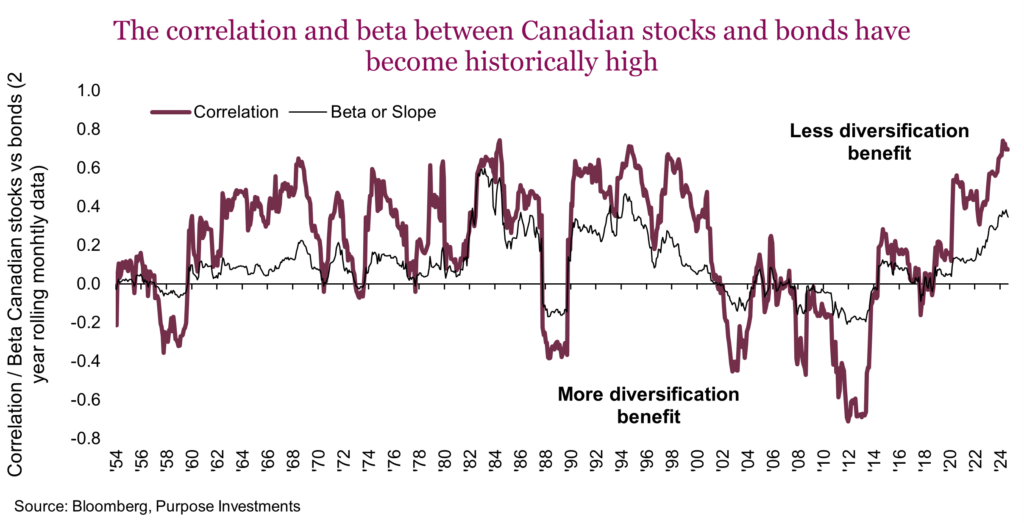
In a number of previous Market Ethos, we have discussed the much higher correlations between equities and bonds, making portfolio construction more challenging. Market dynamics change over time, and past relationships that may have existed for decades or longer can change. The key is understanding whether it is a short-term aberration or if something more permanent has changed. There is no denying that in today’s market, many relationships are not functioning normally. Take gold – at a new high of $2,500/oz – an advance that flies in the face of high real yields (normally a negative for gold) and a generally strong U.S. dollar. Or how about the inversion of the U.S. yield curve for 23 months with no recession?
It is foolish to believe that, in a dynamic system such as the markets or economy, single-factor relationships will always work; there are simply too many moving parts that can disrupt such relationships. Gold is up here for a number of other reasons, and perhaps that recession is just delayed. Correlations, too, will likely not persist at such high levels and have perhaps started to soften. In our opinion, the cause behind many of these broken or challenged historical relationships is inflation and higher short-term interest rates, all triggered by the pandemic and subsequent policy responses.
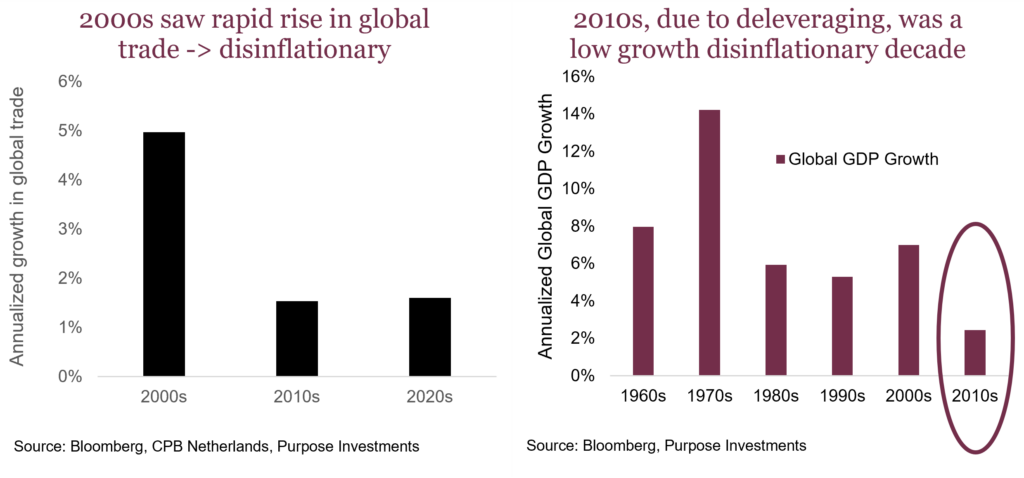
We all suffer from recency bias, over-emphasizing recent experiences or history over longer timeframes. Perhaps the 2000s and 2010s were anomalies, periods with low or negative correlations, dreamy environments for portfolio construction, and 60/40 portfolios. Interestingly, this 20+ year period enjoyed general price disinflation. In the 2000s, it was thanks to a rapid rise in global trade as manufacturing moved to lower labour-cost jurisdictions (led by China), putting downward pressure on prices. In the 2010s, the global economy, consumers, and corporations were repairing their balance sheets by deleveraging. This suppressed global economic growth and contributed to disinflation. Disinflationary pressures helped keep bond/equity correlations lower.
Fast-forward to today, and we should not be surprised to see correlations higher than in recent history. While high, correlations are actually closer to longer historical norms. The real question is, what to do about it, and what happens next?
Correlations likely to soften – Inflation is normalizing and coming down. This has central banks dialling down short-term interest rates, which should help soften correlations. And the market is becoming more concerned with the pace of economic growth, or more specifically, the pace of slowing. If you want a simple rule, in a market primarily concerned with inflation, correlations will likely be high. In a market concerned with recession risk, correlations will be lower.
We have seen this over the past couple of months. Unfortunately, we will likely not enter a disinflationary world similar to the 2000s and 2010s anytime soon. A number of longer-term trends will likely keep inflation as a recurring market risk in the coming years. These include:
- The disinflationary impact of rising global trade has slowed. Tariffs, protectionism, and a gradual move to a more polarized world are inflationary.
- The energy transition may prove disinflationary as technology advances, but today, it is not. Energy costs are higher, and this translates into higher prices.
- Wages over the past couple of years have been rising as fast or faster than inflation. Given that our economies are tilted more toward service, higher wages drive higher prices. And if you have noticed any recent labour disputes, resolutions are quick and costly.
- Cost of capital used to be much lower. Now not so much. Part of this is due to demographics as the disinflationary force of more savers than borrowers softens. The population is also getting older and moving more towards the decumulation phase.
Countering these inflation factors are the disinflationary forces of technology and higher debt. It is never a straight line, but we would argue inflation will not go quietly into the night. This may lead to correlations remaining higher than in the previous two decades.
What to do about higher correlations – Bonds are not broken, and the 60/40 is not dead. However, bond risk mitigation contribution to portfolios will likely be lower than in the 2000s and 2010s. The silver lining is that with yields higher than in recent history, they do now carry a more pronounced return contribution.
That being said, tweaking the traditional 60/40 to find different sources of diversification likely makes more sense today and tomorrow than in years past. Becoming more global helps a little. However, higher correlations are a global phenomenon that limits diversification gains. There are two sources of diversification we believe are worth increased consideration from a portfolio construction perspective:
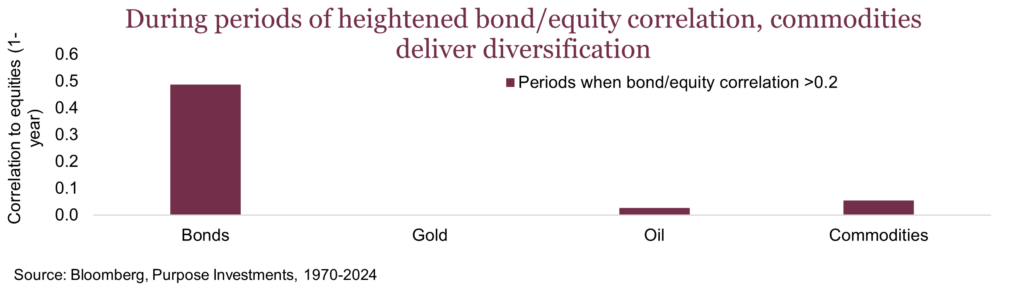
- Commodities – The prices of many commodities and commodity price-sensitive equities offer an added diversification benefit. Gold, oil and broad commodity price indices all carry very low correlations to equities during periods of heightened bond/equity correlations. They also tend to do well when the U.S. dollar weakens, another positive from a portfolio construction perspective. The downside is the volatility in the commodities, and related equities are material, often much higher than bond volatility. Commodity prices often react to short-term supply/demand dynamics, which can oscillate a lot. Many are very sensitive to changes in global economic growth, such as base metals or energy. Some behave based on other factors, like gold. Commodity exposure offers a good source of diversification but should be used sparingly, given the inherent risk/volatility.
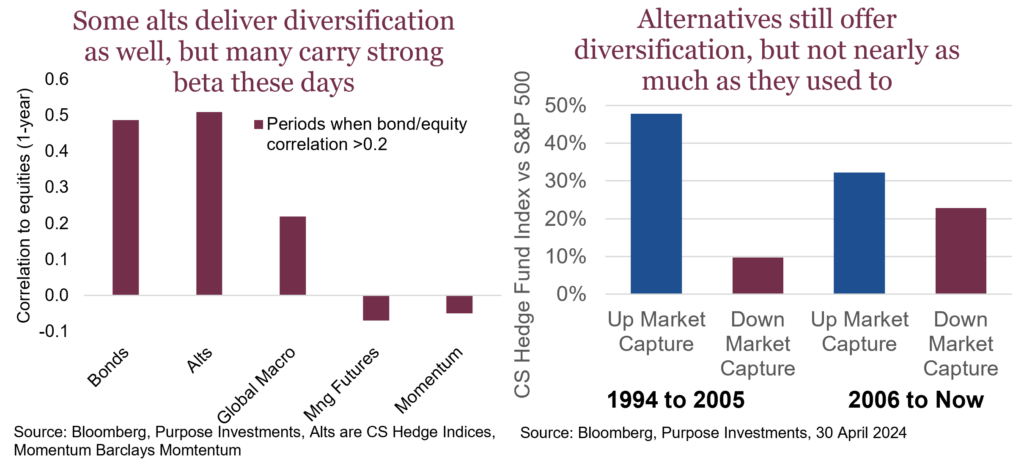
- Alternatives – This very diverse asset class certainly offers unique strategies that have investment streams, unlike traditional assets, which have diversification benefits from a portfolio construction perspective. The challenge becomes which sub-strategies or managers. Due diligence should not be taken lightly because, over the years, many of these vehicles have become more market beta than one would have thought. This is likely the result of a strong performing equity over the past decade, causing many to take on more market exposure to keep up. Low volatility, low correlation, and low returns are challenges in maintaining or growing assets under management.
As a result, the broad alternatives index, which is a mashup of many strategies, actually is not as great a diversifier as one might expect. This can also be seen in the up/down market capture from longer ago compared to the past few decades. The good news is more narrowly, there are sub-strategies that continue to be more effective diversifiers. There are truly different strategies throughout, and finding them requires more due diligence. A good initial rule of thumb, if equities are up +10% and your alt is up +10% … it may be less alt than you think.
If higher equity/bond correlations are now the norm, the efficient frontier for portfolios has been nudged to the right. That means for the same level of return, you should expect greater volatility than before. However, adding in a measured amount of commodity exposure and alternatives can help nudge the curve back to the left.
Market cycle
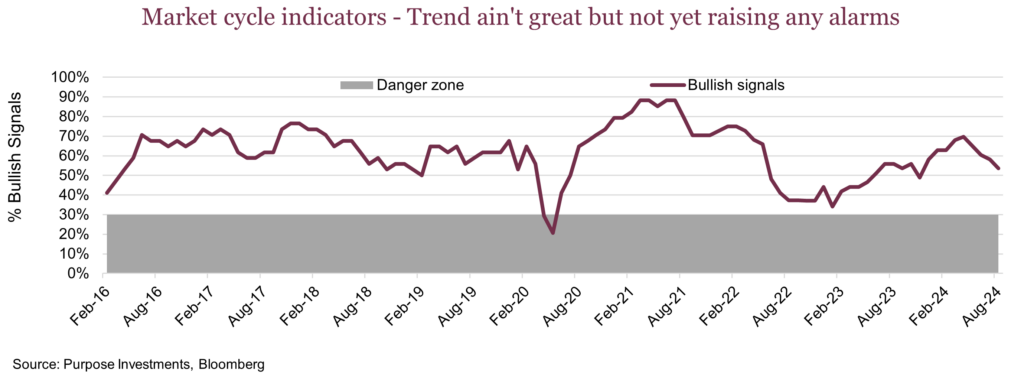
Market cycle indicators have been eroding over the past few months, but they are still reasonable. In April, 70% of signals were bullish, and as of the end of August, this was down to 53%.
The U.S. economy flipped two bullish signals to bearish compared to last month. GDP Now, from the Atlanta Fed, an econometric model built around more high-frequency data, dropped from 2.9% mid-August to 2.0% by month end. This measure softened residential investment spending and inventories, the good news being that the consumer remains steadfast. The other signal that flipped was energy demand.
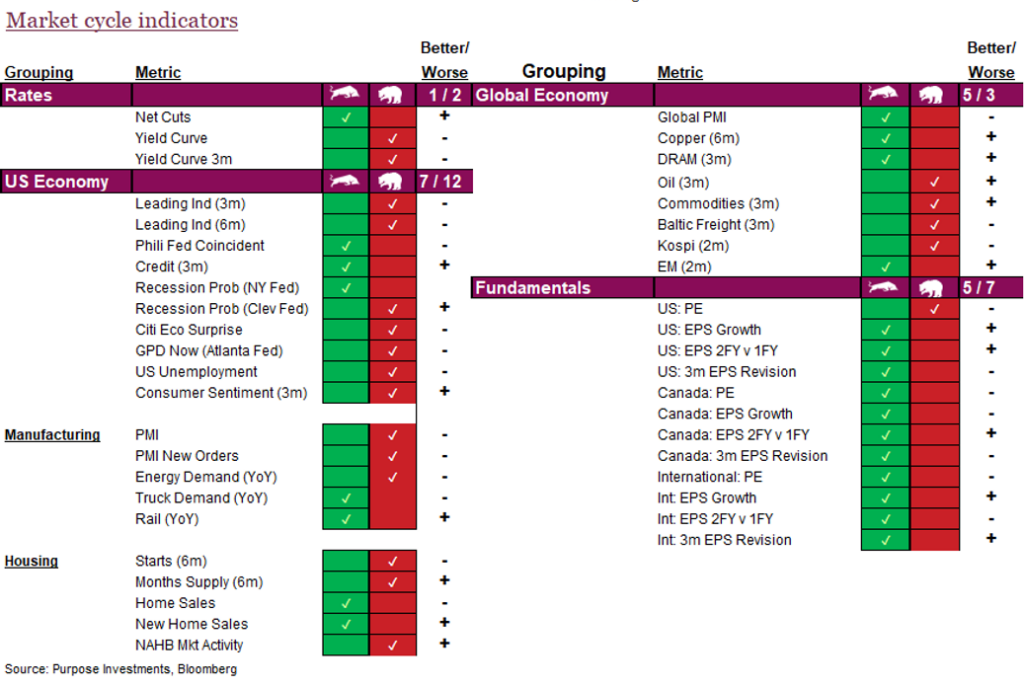
Outside the U.S., the global economy category lost one bullish signal as the KOSPI rolled over. Given the composition of its equity market, the Korean market has long been a proxy for global trade. On the positive side, international earnings growth picked up. Earnings estimates have been steadily improving globally.
Final thoughts
There have been big moves in equities, both down then up thankfully. Big moves in bond yields, moving lower. Big moves in currencies, with USD dropping. Big moves in commodities, economic cyclical ones down, safe haven ones up. This has not been a sleepy summer, so either the seasonal volatility of Sept/Oct came early, or we are just getting warmed up for a wild finish to the year. This is not the time to be chasing in our view, even if Rocky keeps bouncing back up.