
Sign up here to receive the Market Ethos by email.
July 2023.
Investor Strategy.
Executive summary
- Tough to match in the second half
- Everything has gone K-shaped
- Economic resilience or just delayed?
- Release valve and pressure cracks
- Earnings – not all negative but certainly paying up for them
- Market cycle
- Portfolio positioning
- The final word
At the moment, it appears both the economy and markets are K shaped.
Take the economy; some aspects are going really well. Spending on services remains robust, thanks to pent-up demand and still resilient labour markets. Meanwhile, manufacturing and other cyclical components continue to show weakness. Or the equity markets. The technology-heavy NASDAQ is up 30%, as is Japan. Meanwhile, the Dow Jones Industrial Average is up a paltry 2%, as is the TSX. Divergent, just like the letter ‘K’.
Tough to match in the second half
Equity markets continued to advance in June, despite central banks turning hawkish this month. The Bank of Canada, moved off the sidelines in early June, raising the overnight lending rate by 25 bps. The BoC’s benchmark rate is now at a 22-year high of 4.75% and is expected to increase further to rein in inflation. It wasn’t just the BoC who were aggressive this month, with the Bank of England surprising markets by hiking interest rates by 50 bps, taking the Bank Rate to 5.00% and acknowledging that inflation in Britain would take longer than expected to fall. Adding to this, Fed Chair Jerome Powell said at least two interest-rate increases are likely necessary this year to bring the inflation rate down to the U.S. central bank’s 2% target, while officials in the ECB echoed the same sentiment.
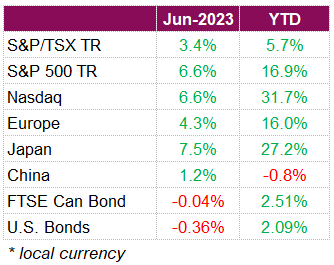
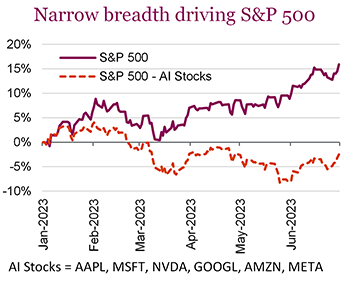
Still, equity markets have managed to climb a wall of worry so far this year, with the S&P 500 and Nasdaq now up more than 20% from their October lows, marking the start of a new bull market for the indexes. The S&P 500 finished the month up 6.61% on a total return basis and closed off the end of the first half up 16.9% after four straight winning months in a row. The Nasdaq has seen even stronger gains, up 6.7% in the month and rising 32.3% on a total return basis this year, thanks to the market’s new obsession with artificial intelligence. Nearly $5 trillion has been added to the value of companies in the Nasdaq since the start of the year. Without the help of large tech names to boost performance, the TSX trailed its U.S. peers this month, rising a still respectable 3.4% in June and now up 5.8% YTD, both on a total return basis. With hawkish commentary reverberating throughout June, bond yields rose during the month, with U.S. Treasury yields reaching their highest levels since March. The increase was triggered by strong economic growth data, leading investors to speculate that the Fed will hike rates more this year. Short-term bond yields, which are sensitive to changes in the Fed’s policy rate, saw the most significant bump higher, with the two-year yield rising by as much as 18 bps to 4.89%. As a result, bonds disappointed in June with the FTSE Canada Universe Bond Index down -0.04% and the U.S. Aggregate Bond market falling -0.36%.
Finally something positive on inflation. Canadian inflation continued to moderate over the month, with CPI slowing to its weakest pace in two years. CPI rose 3.4% in May from a year ago, the smallest increase since 2021, which matched the median estimate and was down a full percentage point from April. The moderation in price gains is a welcome development for the BoC, especially after a surprise acceleration in the previous month when the headline rate rose for the first time since June 2022. Still, resilient economic growth, solid consumption patterns, a tight labour market, and persistent above-target inflation continues to weigh on policymakers who are expected to extend their tightening campaign to slow excess economic demand. The U.S. is also finding itself on a similar trajectory, seeing positive economic data while contending with still high inflation. Reliable leading indicators of U.S. recession continue to worsen, suggesting to us that this latest advance in share prices will eventually give way to a more challenging period for equity investors.
The re-opening of China has been a wildcard this year. China’s consumer-driven recovery has shown signs of losing momentum as spending slows across sectors, including travel, housing, and car sales. The rebound in consumption since the easing of pandemic restrictions has driven growth this year, but weak confidence and mounting evidence of a potential economic slowdown are increasing expectations for additional stimulus measures. While economists have raised the expectations for more monetary and fiscal stimulus such as accelerating the sale of special local government bonds and implementing further monetary easing, the scale of the stimulus is expected to be limited, which has pushed equities in China lower.
Everything has gone K-shaped
Economic parlance often tries to use a single letter to capture what is happening. For example, a V-shaped recovery in the economy or market represents a sudden drop followed by a sudden rise; L-shaped is a sudden drop followed by a muted recovery. ‘K’ is used to denote a divergent two-pronged recovery — the portion of the letter going up to the right representing the positive and the downward to the right portion of the letter representing things that are not going well. At the moment, it appears both the economy and markets are K shaped.
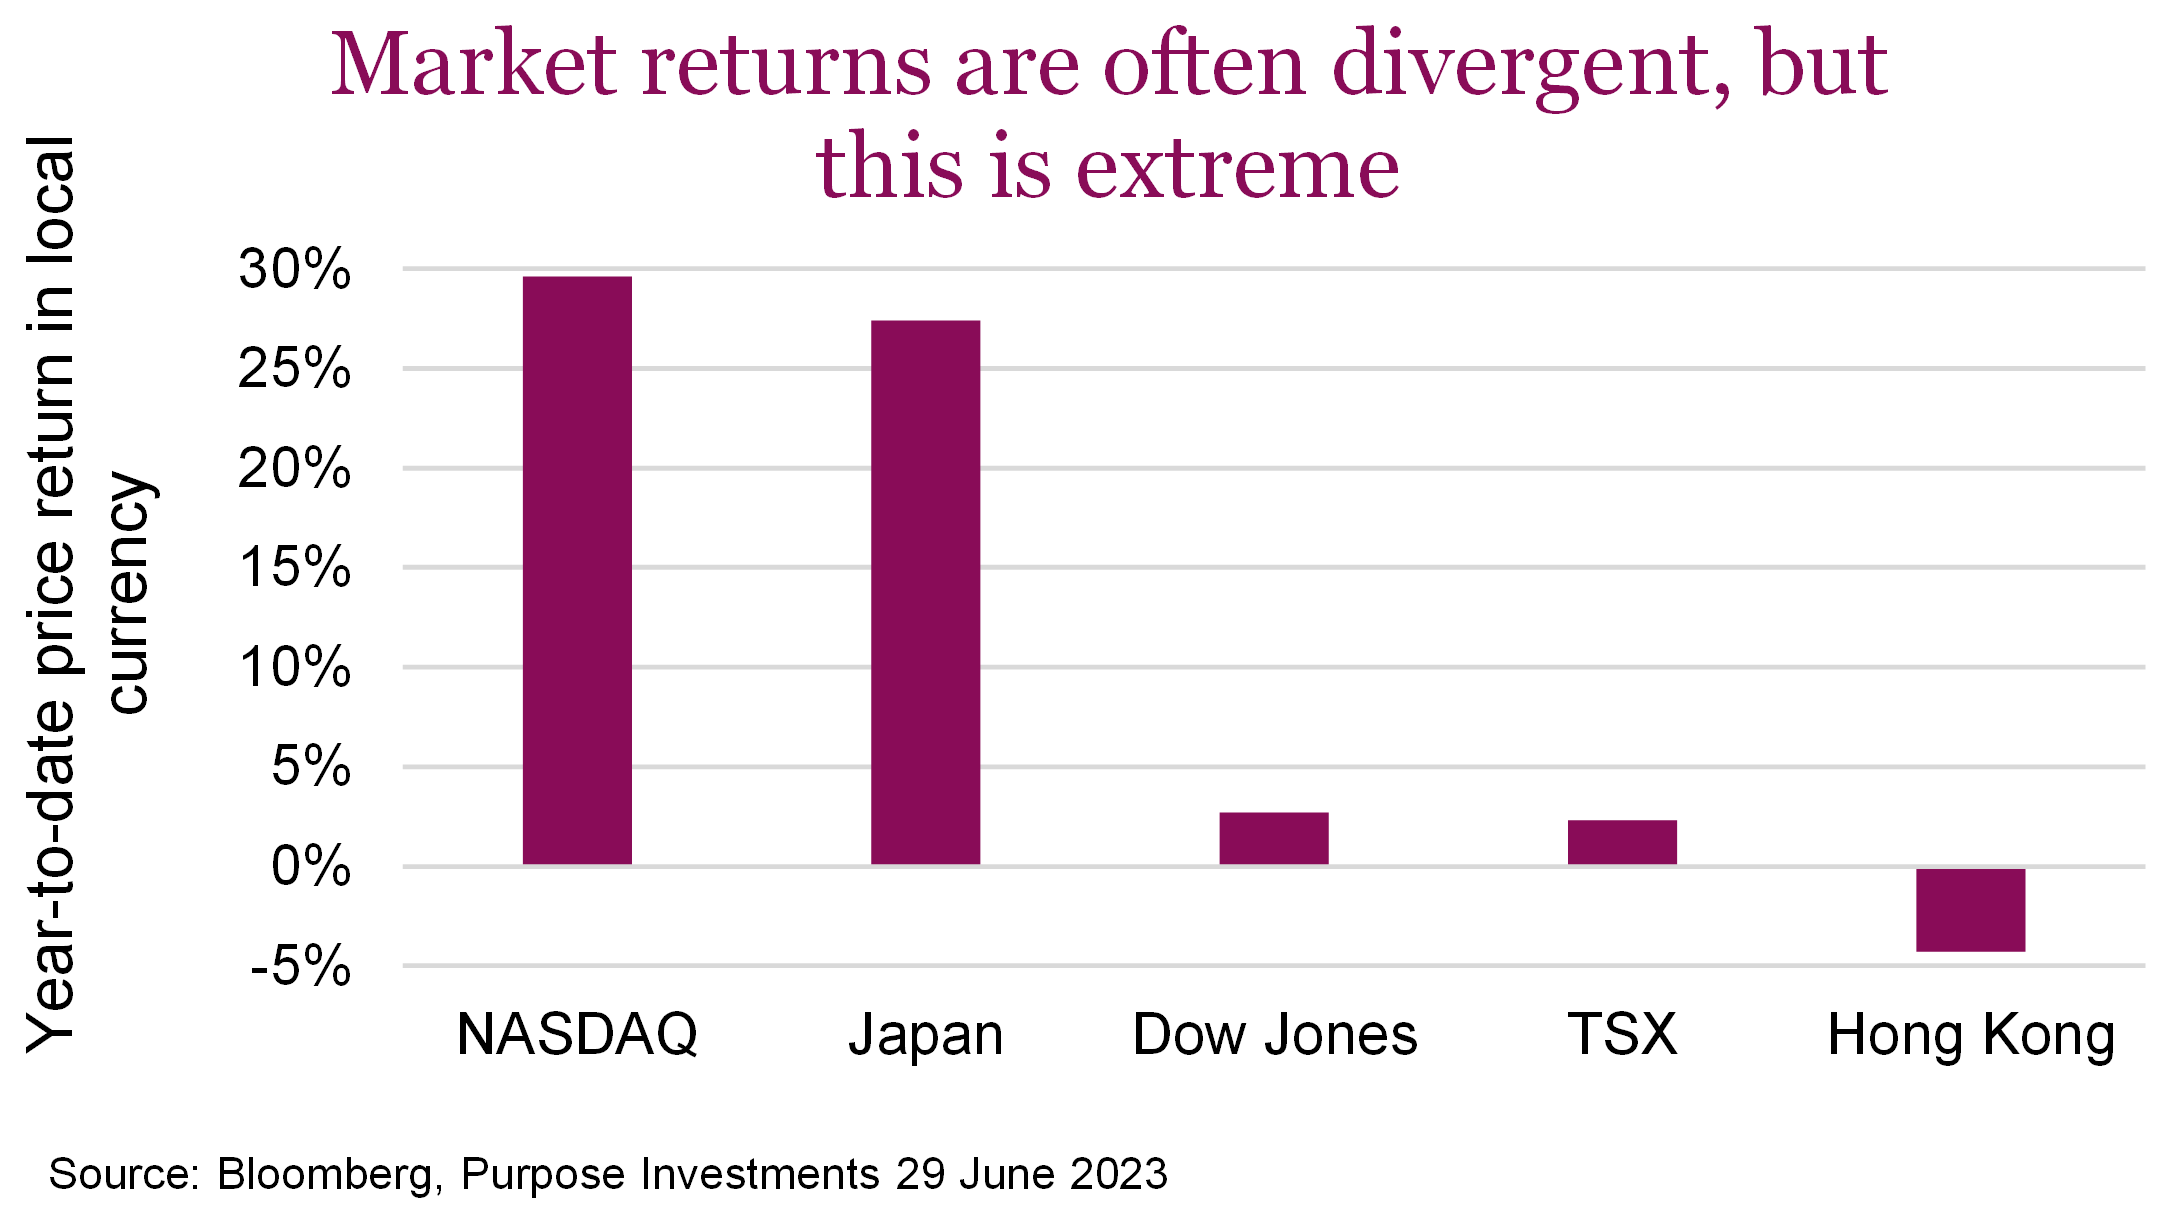
Take the economy; some aspects are going really well. Spending on services remains robust, thanks to pent-up demand and still resilient labour markets. Meanwhile, manufacturing and other cyclical components continue to show weakness. Or the equity markets. The technology-heavy NASDAQ is up 30%, as is Japan. Meanwhile, the Dow Jones Industrial Average is up a paltry 2%, as is the TSX. Divergent, just like the letter ‘K’.
Economic resilience or just delayed?
The study and analysis of the economy is really the study of human behaviour and decision-making. During the pandemic, we all changed our behaviours, and this aggregated in such a way to really change the economy. Buying stuff, watching too much Netflix, and staying home more often pushed supply chains beyond capacity and wrecked other business models (all the cupcake shops are long gone from the downtown PATH). Then behaviours started to change back, some faster than others.
We shouldn’t be too surprised to see economic activity in manufacturing slowing while service-related activity remains robust. This is very evident in Purchasing Managers’ Survey data (PMIs). Looking across most major economies, service activity remains in expansion mode (above 50) while manufacturing activity has been in contraction mode (below 50) over the past year.
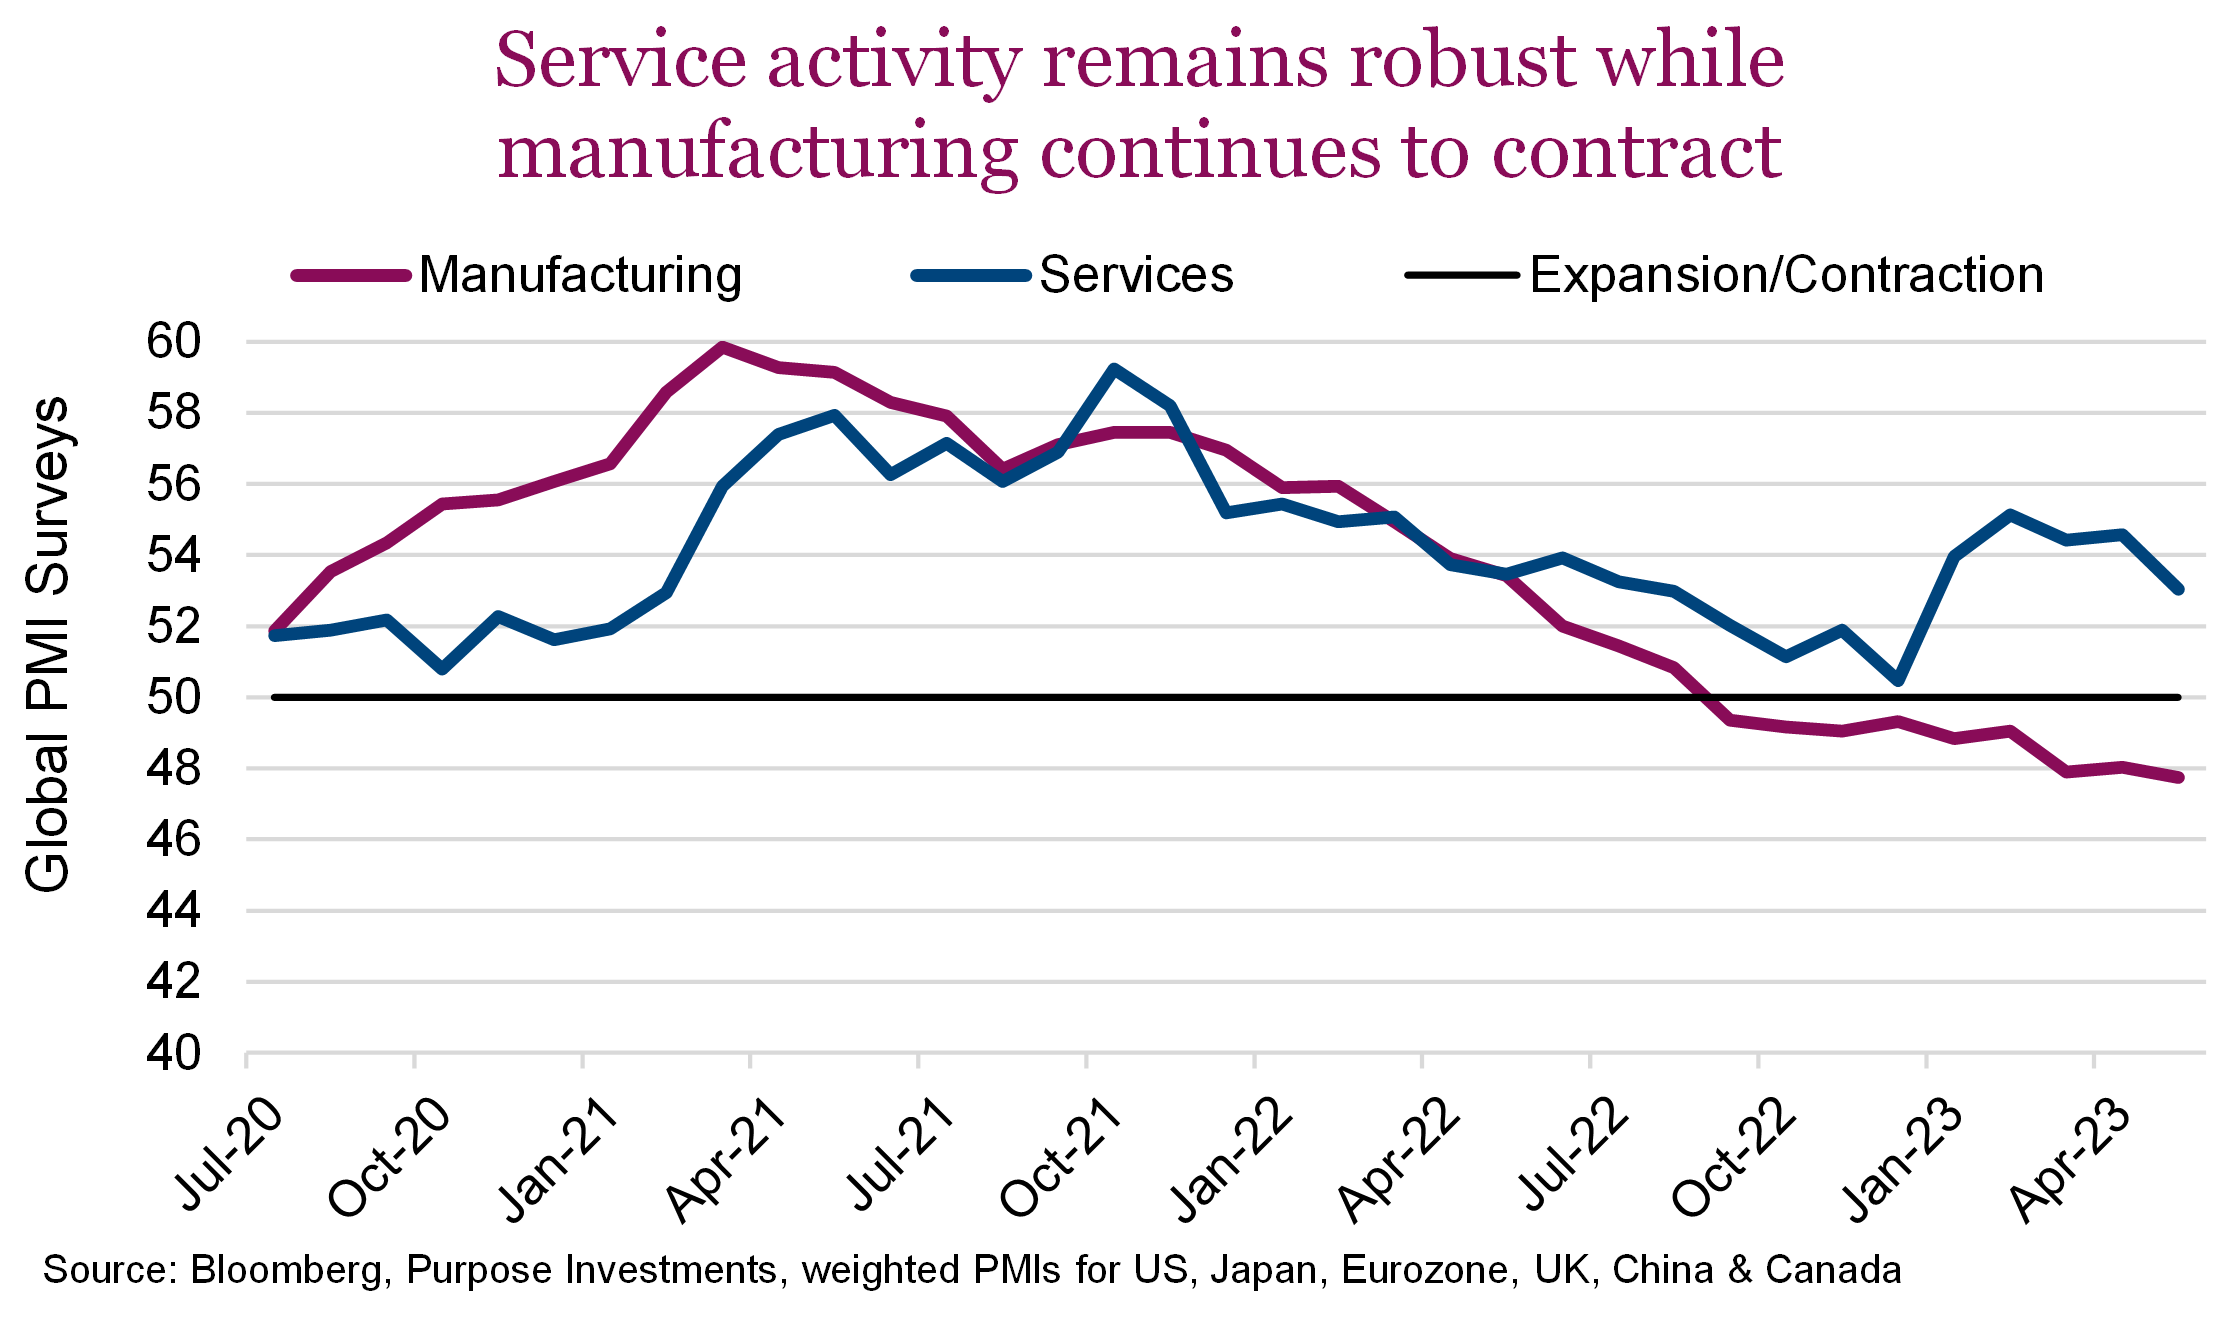
The glass-half-full lens for this data is that overspending on goods during the pandemic and subsequent catching up within supply chains resulted in bringing demand forward into 2020–2021. Normalizing our spending on goods is simply manifesting in less manufacturing activity. This is also evident in other metrics. Trucking demand is way down, given cardboard box shipments are running almost 10% below year-ago levels. Think of those little boxes on your porch. Meanwhile, our desire to travel, eat, and do stuff has services activity rather robust.
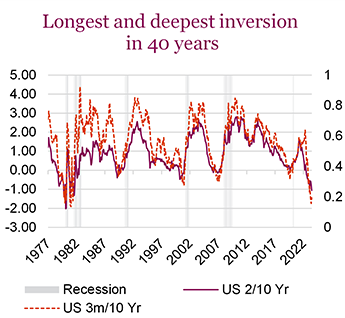
The glass-half-empty lens would highlight the fact that changes in manufacturing activity often precede economic activity in the service sectors of the economy. Implying that service activity is at risk of following the trend in manufacturing, providing yet another sign of future slowing in economic activity. Add this to the inverted yield curve, recession probability models and leading indicators.
This divergence of economic activity can also be seen from one economy to the next. China and Germany, which have relatively larger portions of their economy driven by manufacturing, have seen a downturn in data. Meanwhile, economies such as the U.S., which are more service-oriented, have remained more resilient.
What comes next?
Not surprisingly, there are two potential paths (there are probably more than two, but let’s simplify). The normalization of goods spending could work itself out and stabilize, with service activity keeping the global economy growing at a reasonable pace. Or all those rate hikes that hit manufacturing/good spending quicker could finally start to weigh on services activity. Bringing on slower economic growth or even recession. We remain in the latter camp but must acknowledge the resilience of the economy or at least that we have once again been a tad early.
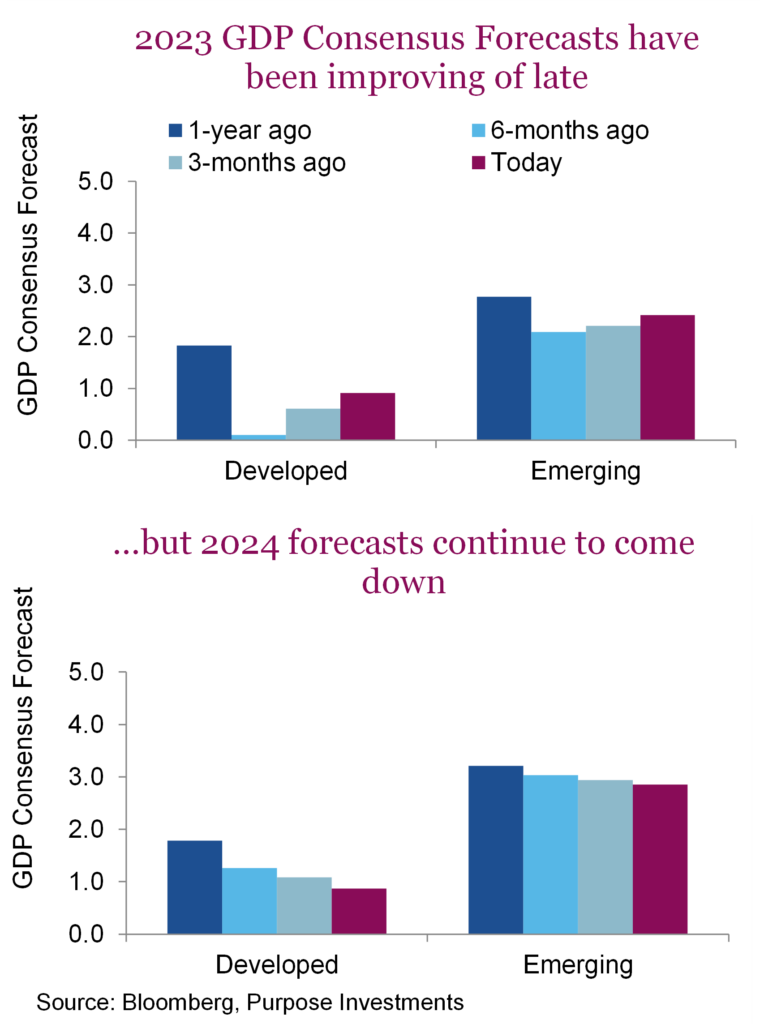
Looking at consensus economic forecasts for global economic growth, there is no denying that 2023 is shaping up better than the collective wisdom predicted. Six months ago, forecasts for developed economic growth were barely above zero, and now ithas risen to almost 1%. Still a sizeable deceleration from 2022, but at least it isn’t negative.
The good news kind of ends there, as forecasts for 2024 have continued to be revised lower for both developed and emerging (developing) economies. Taken at face value, global economic growth still appears set to slow to near stall speed…just later than many had previously expected.
Release valve and pressure cracks
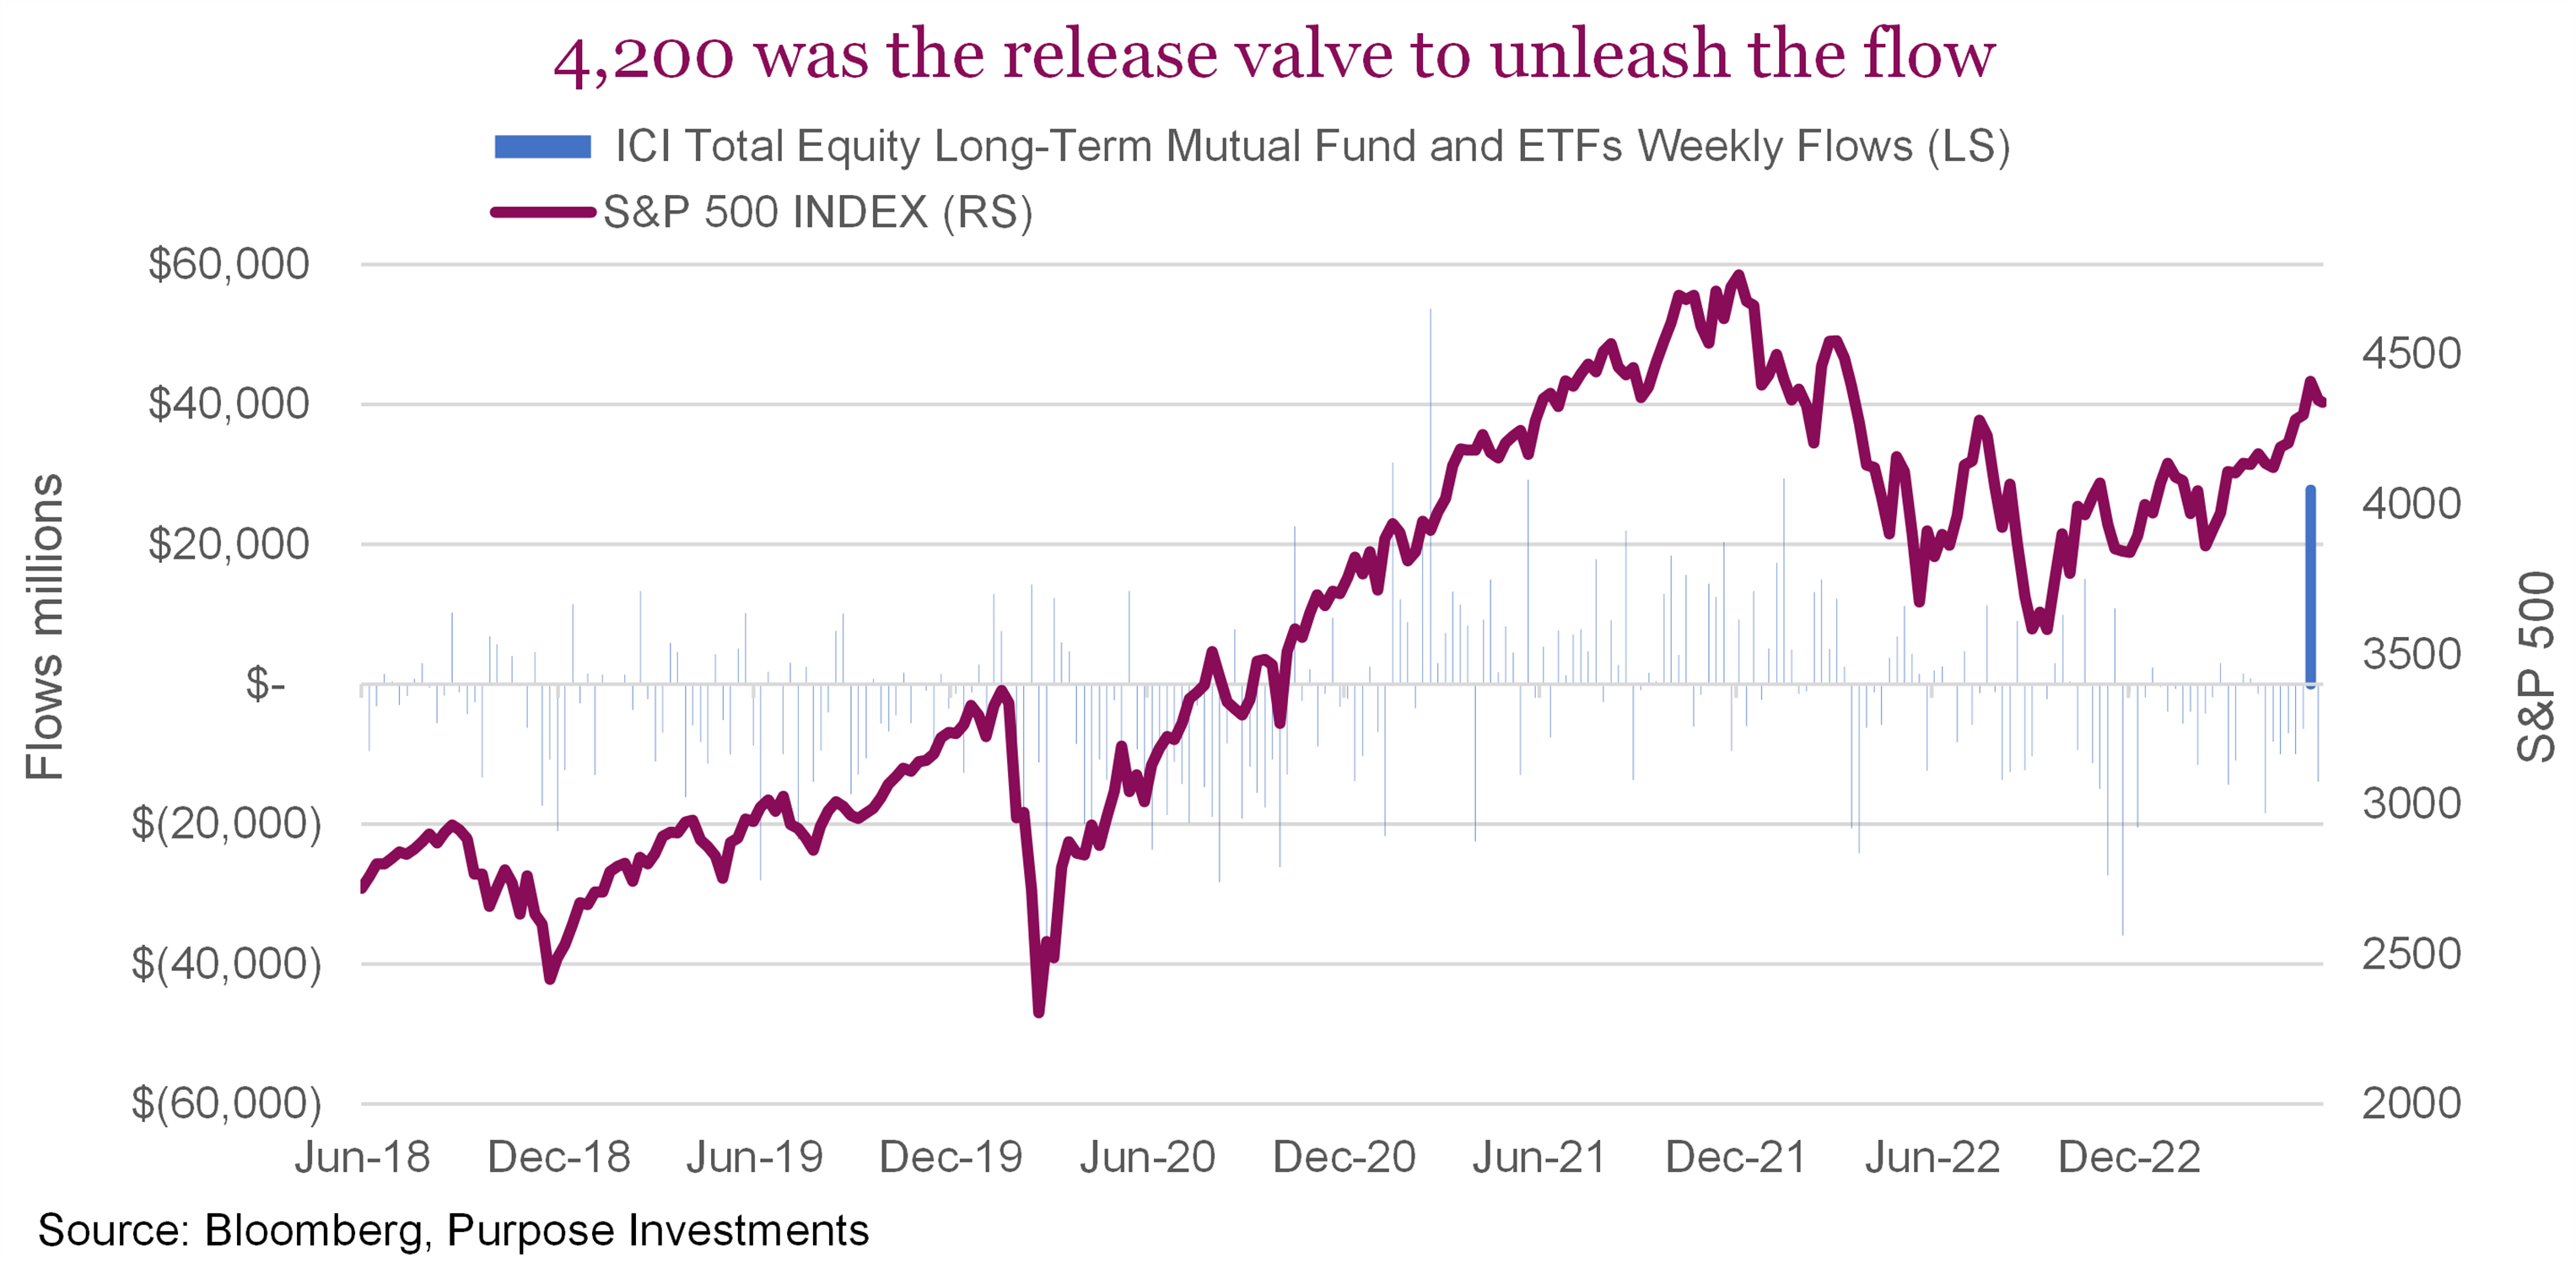
After two months of flirting with the 4,200 level, it was clear this was a major resistance level for the S&P 500. Once released, this pressure point opened the floodgates in June. Aggressive repositioning and short covering from extremely depressed levels on the futures market led to one of the largest weeks of money entering the market over the past five years. Total mutual fund and ETF weekly inflows nearly reached $28 billion mid-month. Lots of fresh new money-long positions have been established as FOMO kicked into high gears. The futures market has also seen a sudden move off some of the most bearish positioning we’ve seen in the E-mini futures over the past twenty years.
Sentiment has shifted; AAII Bull-Bear reading is now over +20. Not extreme, but any time you have this much of a gap between the bulls and bears, it typically follows some strong returns in the market and is a sign that it is becoming increasingly tilted towards excessive greed. As a contrarian, it’s time to take some notice whenever sentiment shifts by such a degree and be ready for a reversal. At this point, it just doesn’t seem worth it to jump into the momentum trade from a risk/reward standpoint. Historic flows coupled with stretched sentiment are both signs of pressure cracks building in the market. In addition, the VIX, may be the most well-known measure of market sentiment. At 14, it’s a sign that complacency is abundant in the market.
Predicting isn’t easy
It’s always hard to make the right call when it comes to forecasting where markets will be in the future. Predictions are difficult, and we’d argue that they are a futile task for several reasons.
- Markets are complex: Financial markets attempt to tie in the complexities of the economy, business valuation, geopolitical events and sentiment every second of the day.
- Uncertainty: Nobody knows what’s going to happen in the future. Unforeseen developments can play a major role in market movements. You also have Black Swan events, which are rare and unpredictable events that can disrupt the functions of the market.
- Behavioural: Despite the rise of AI and algos, markets are still largely driven by human factors. With it, they reflect a range of human emotions and all of our wonderful biases.
- Information Asymmetry: The speed and amount of new information that gets disseminated every single day makes it very difficult for strategists to gain any sort of information advantage.
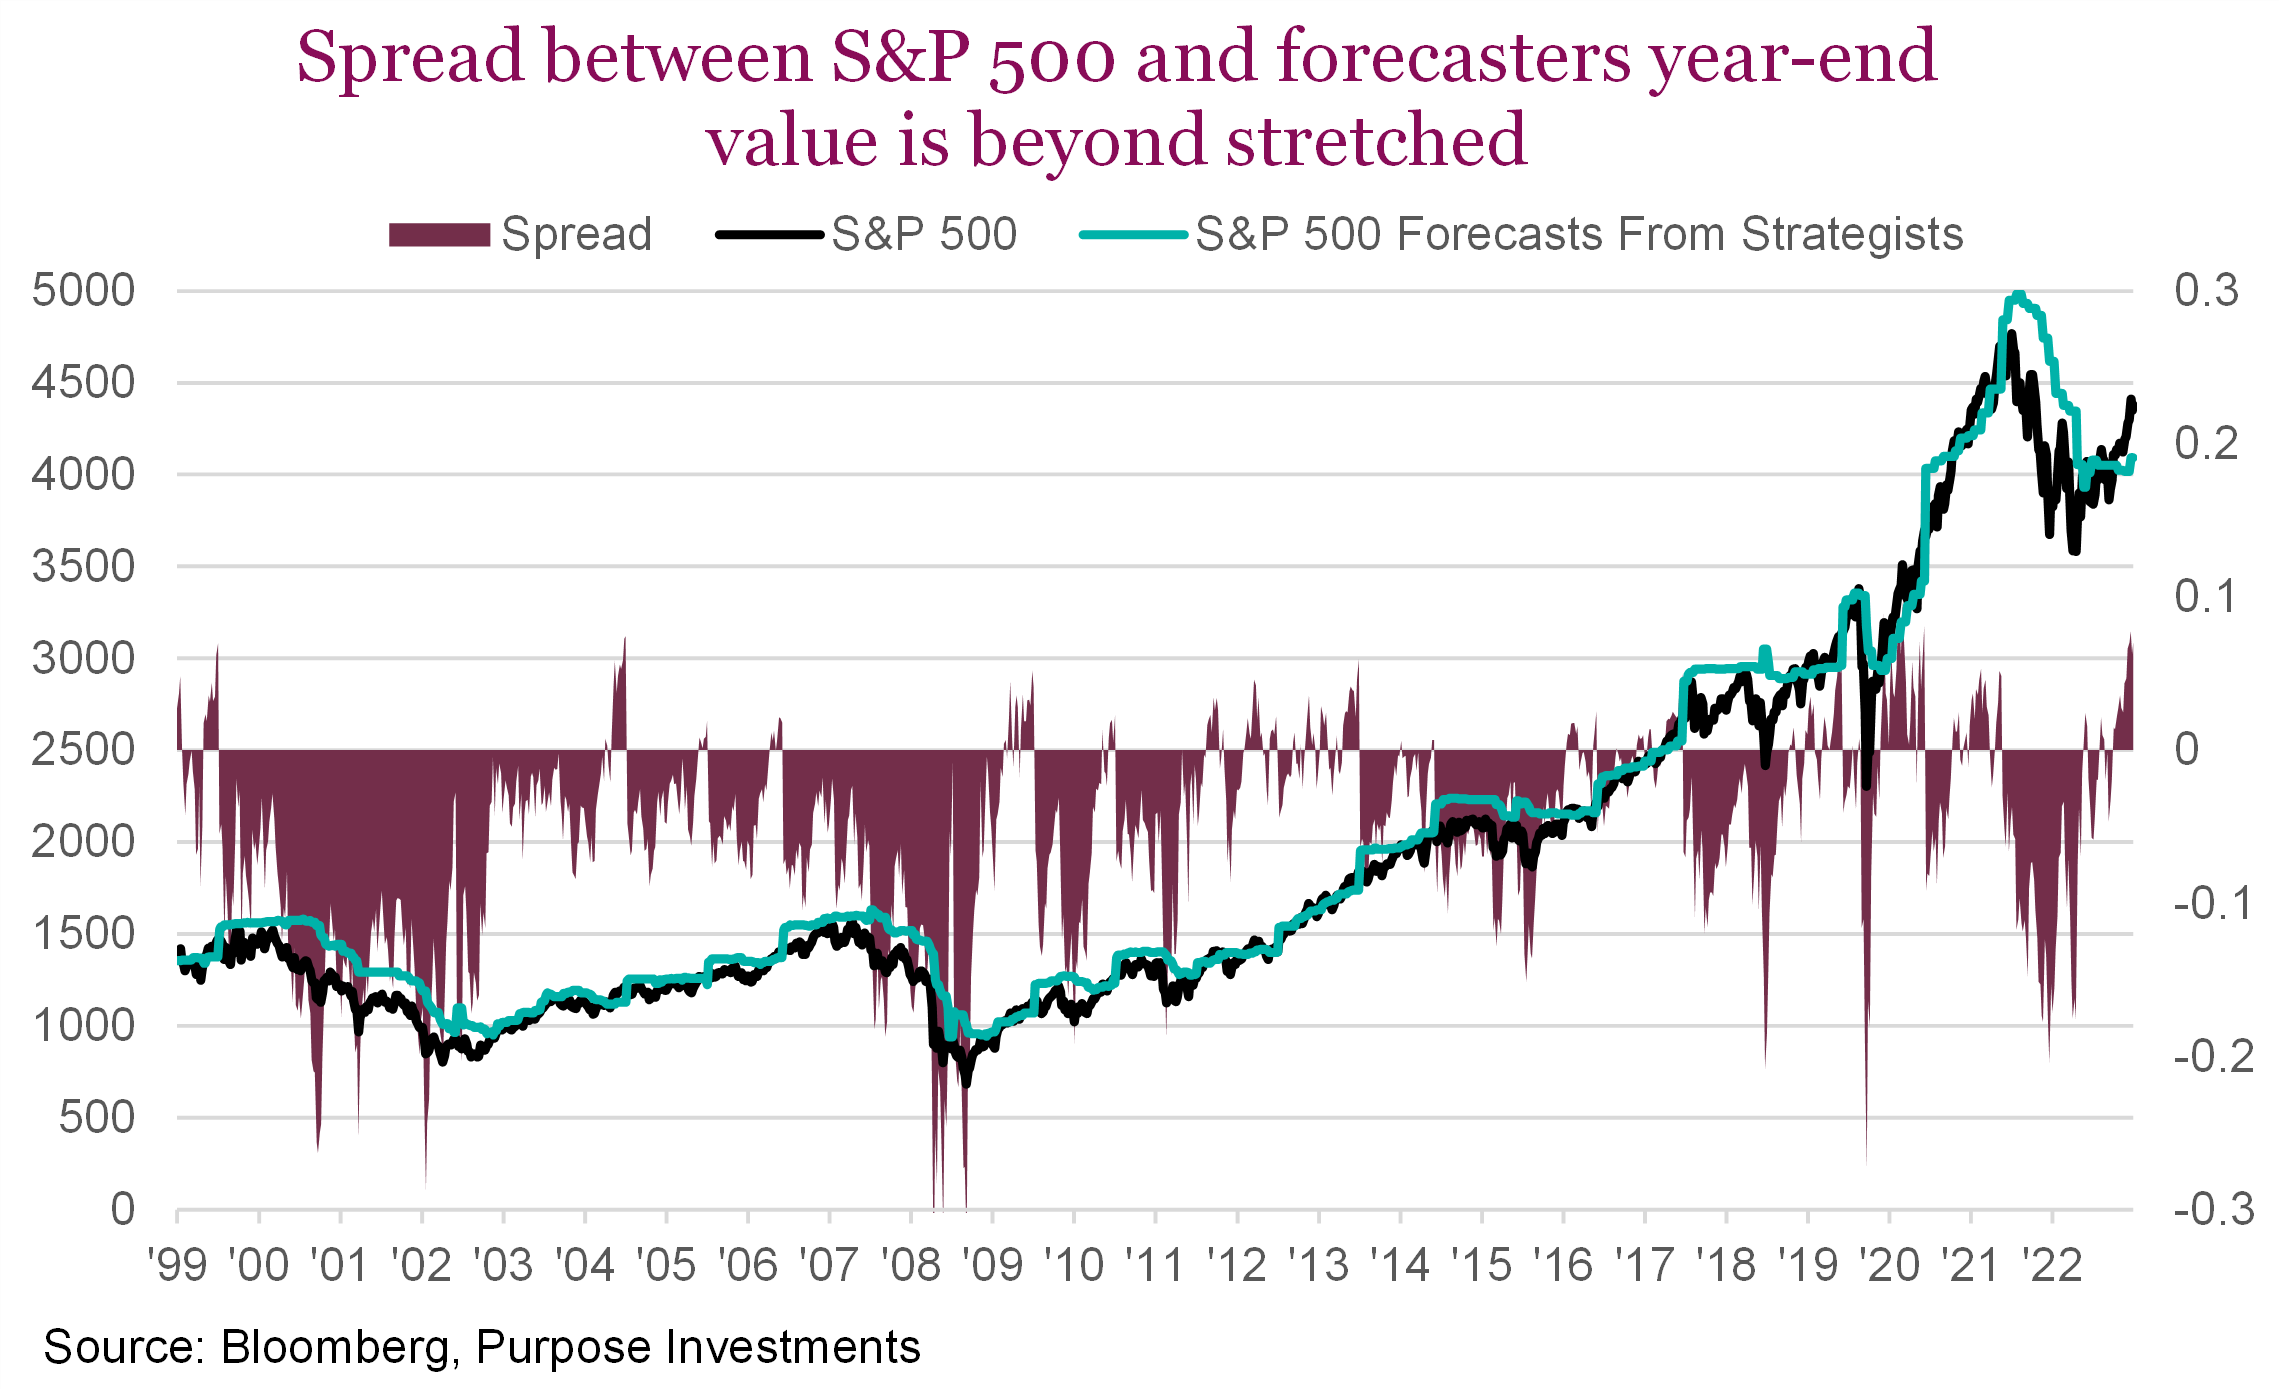
We’ve been in the recession camp since the beginning of the year. We were not alone. In hindsight, most other strategists had the same idea. The consensus forecasted year-end level for the S&P 500 on January 20th stood at just 4,050. It’s since risen to 4,091. Since 1999 there have been very few periods where the market trades through the average year-end forecast for the S&P 500. The fact that the S&P is now nearly 10% over the forecasted level speaks volumes about how fast the recent advance has happened and how widely out of sync the market appears to be with the macro and fundamentals. Besides the stimulus-fueled advance following the pandemic, the spread has never been larger.
Higher for longer driving divergences
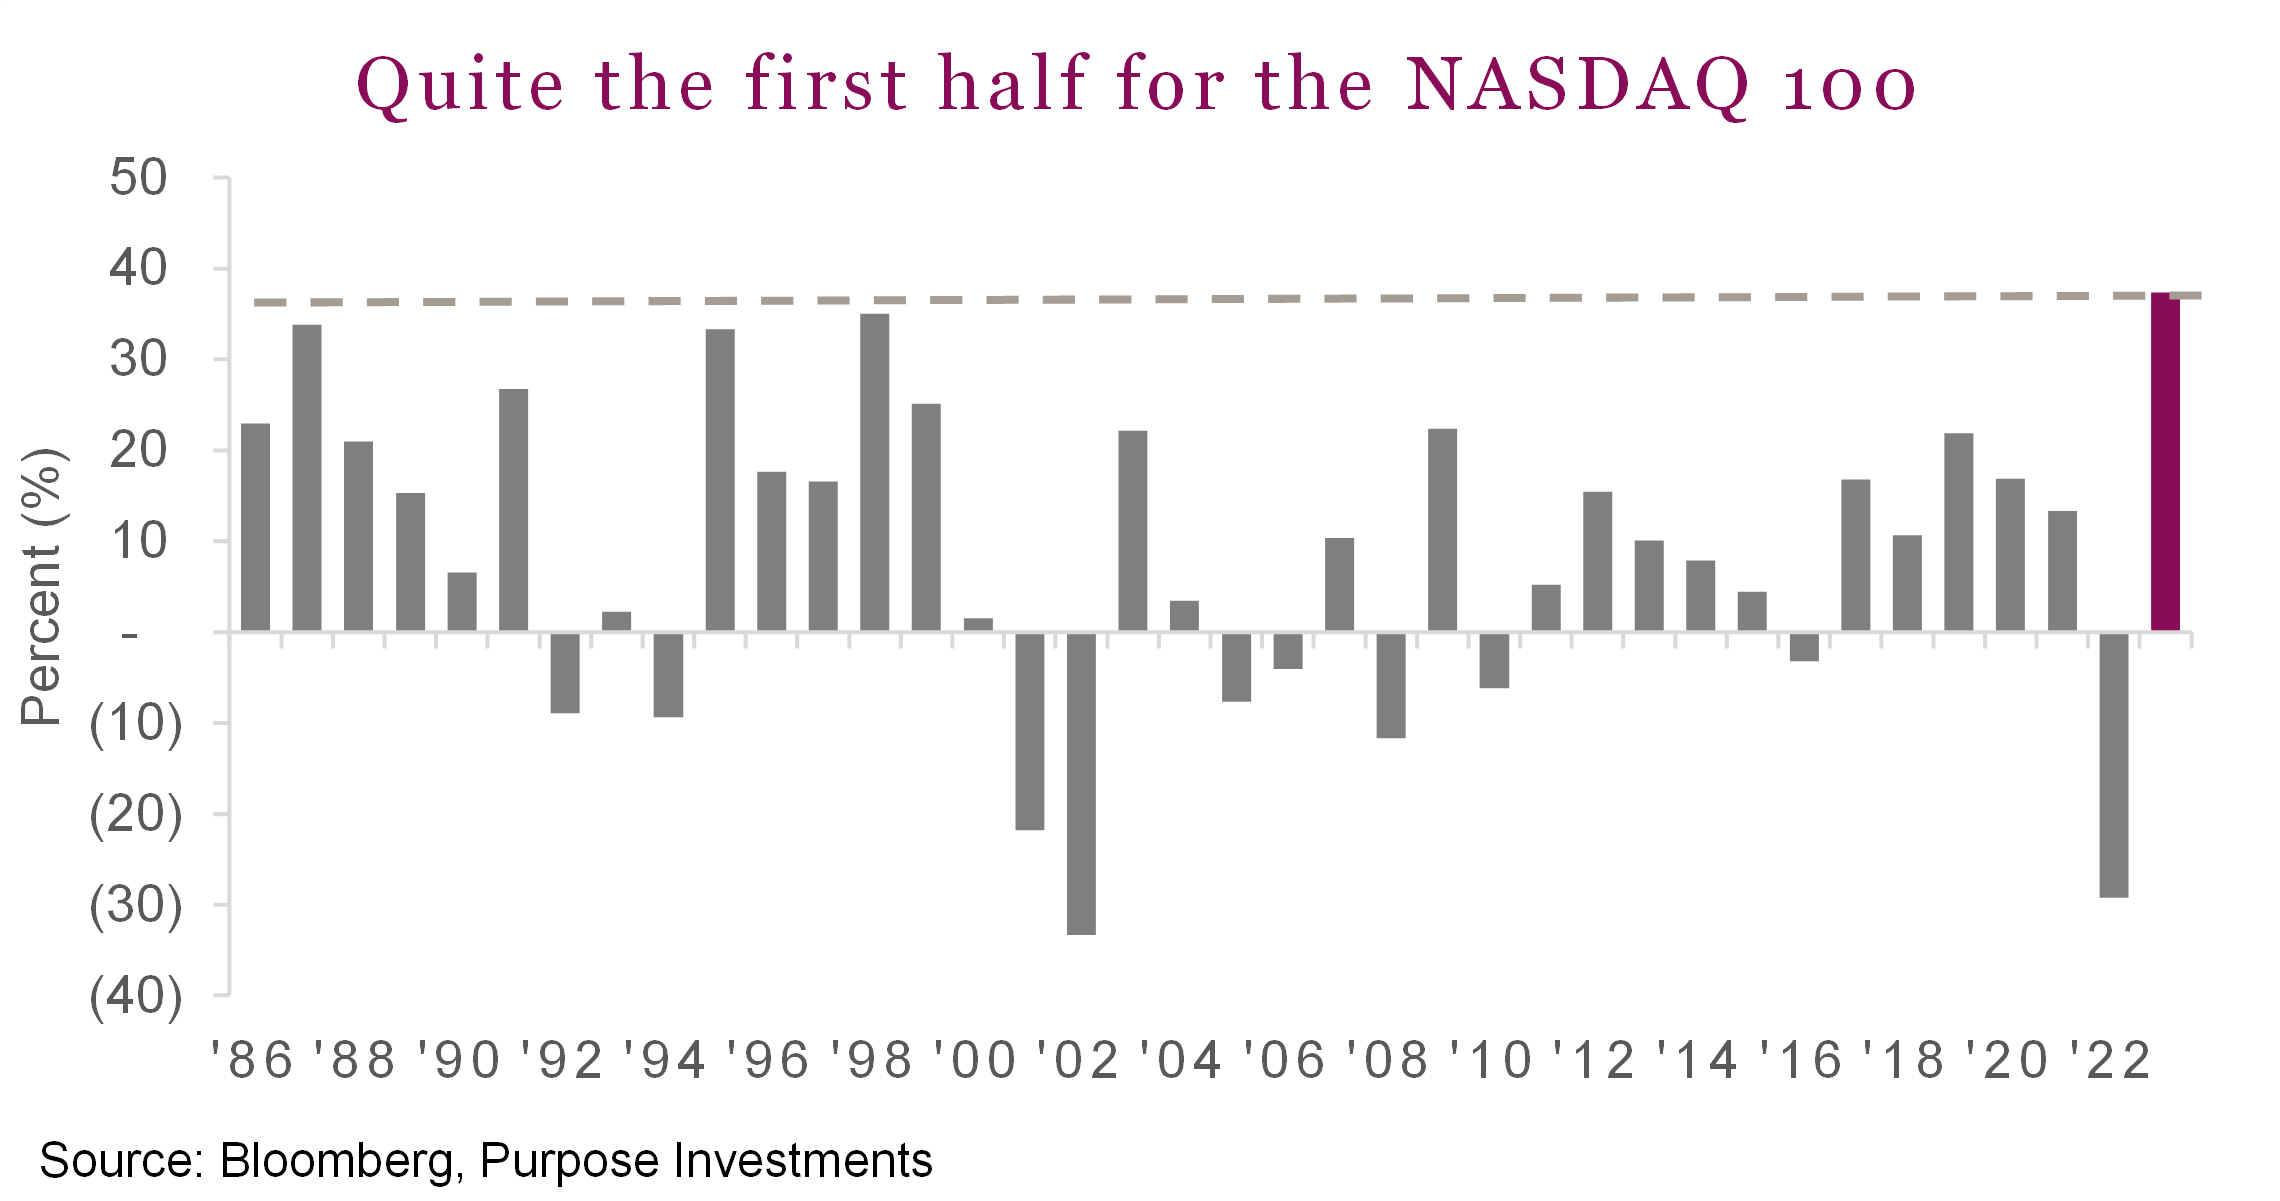
There were multiple themes that took hold during the first half of the year. The return of tech dominance fueled by the AI boom was front and centre, driving the NASDAQ 100 to its best first half on record. What started as the snapback rally off the lows last year, with the biggest losers becoming the biggest winners, gained momentum as everything AI took hold of the market. Rising rates be damned.
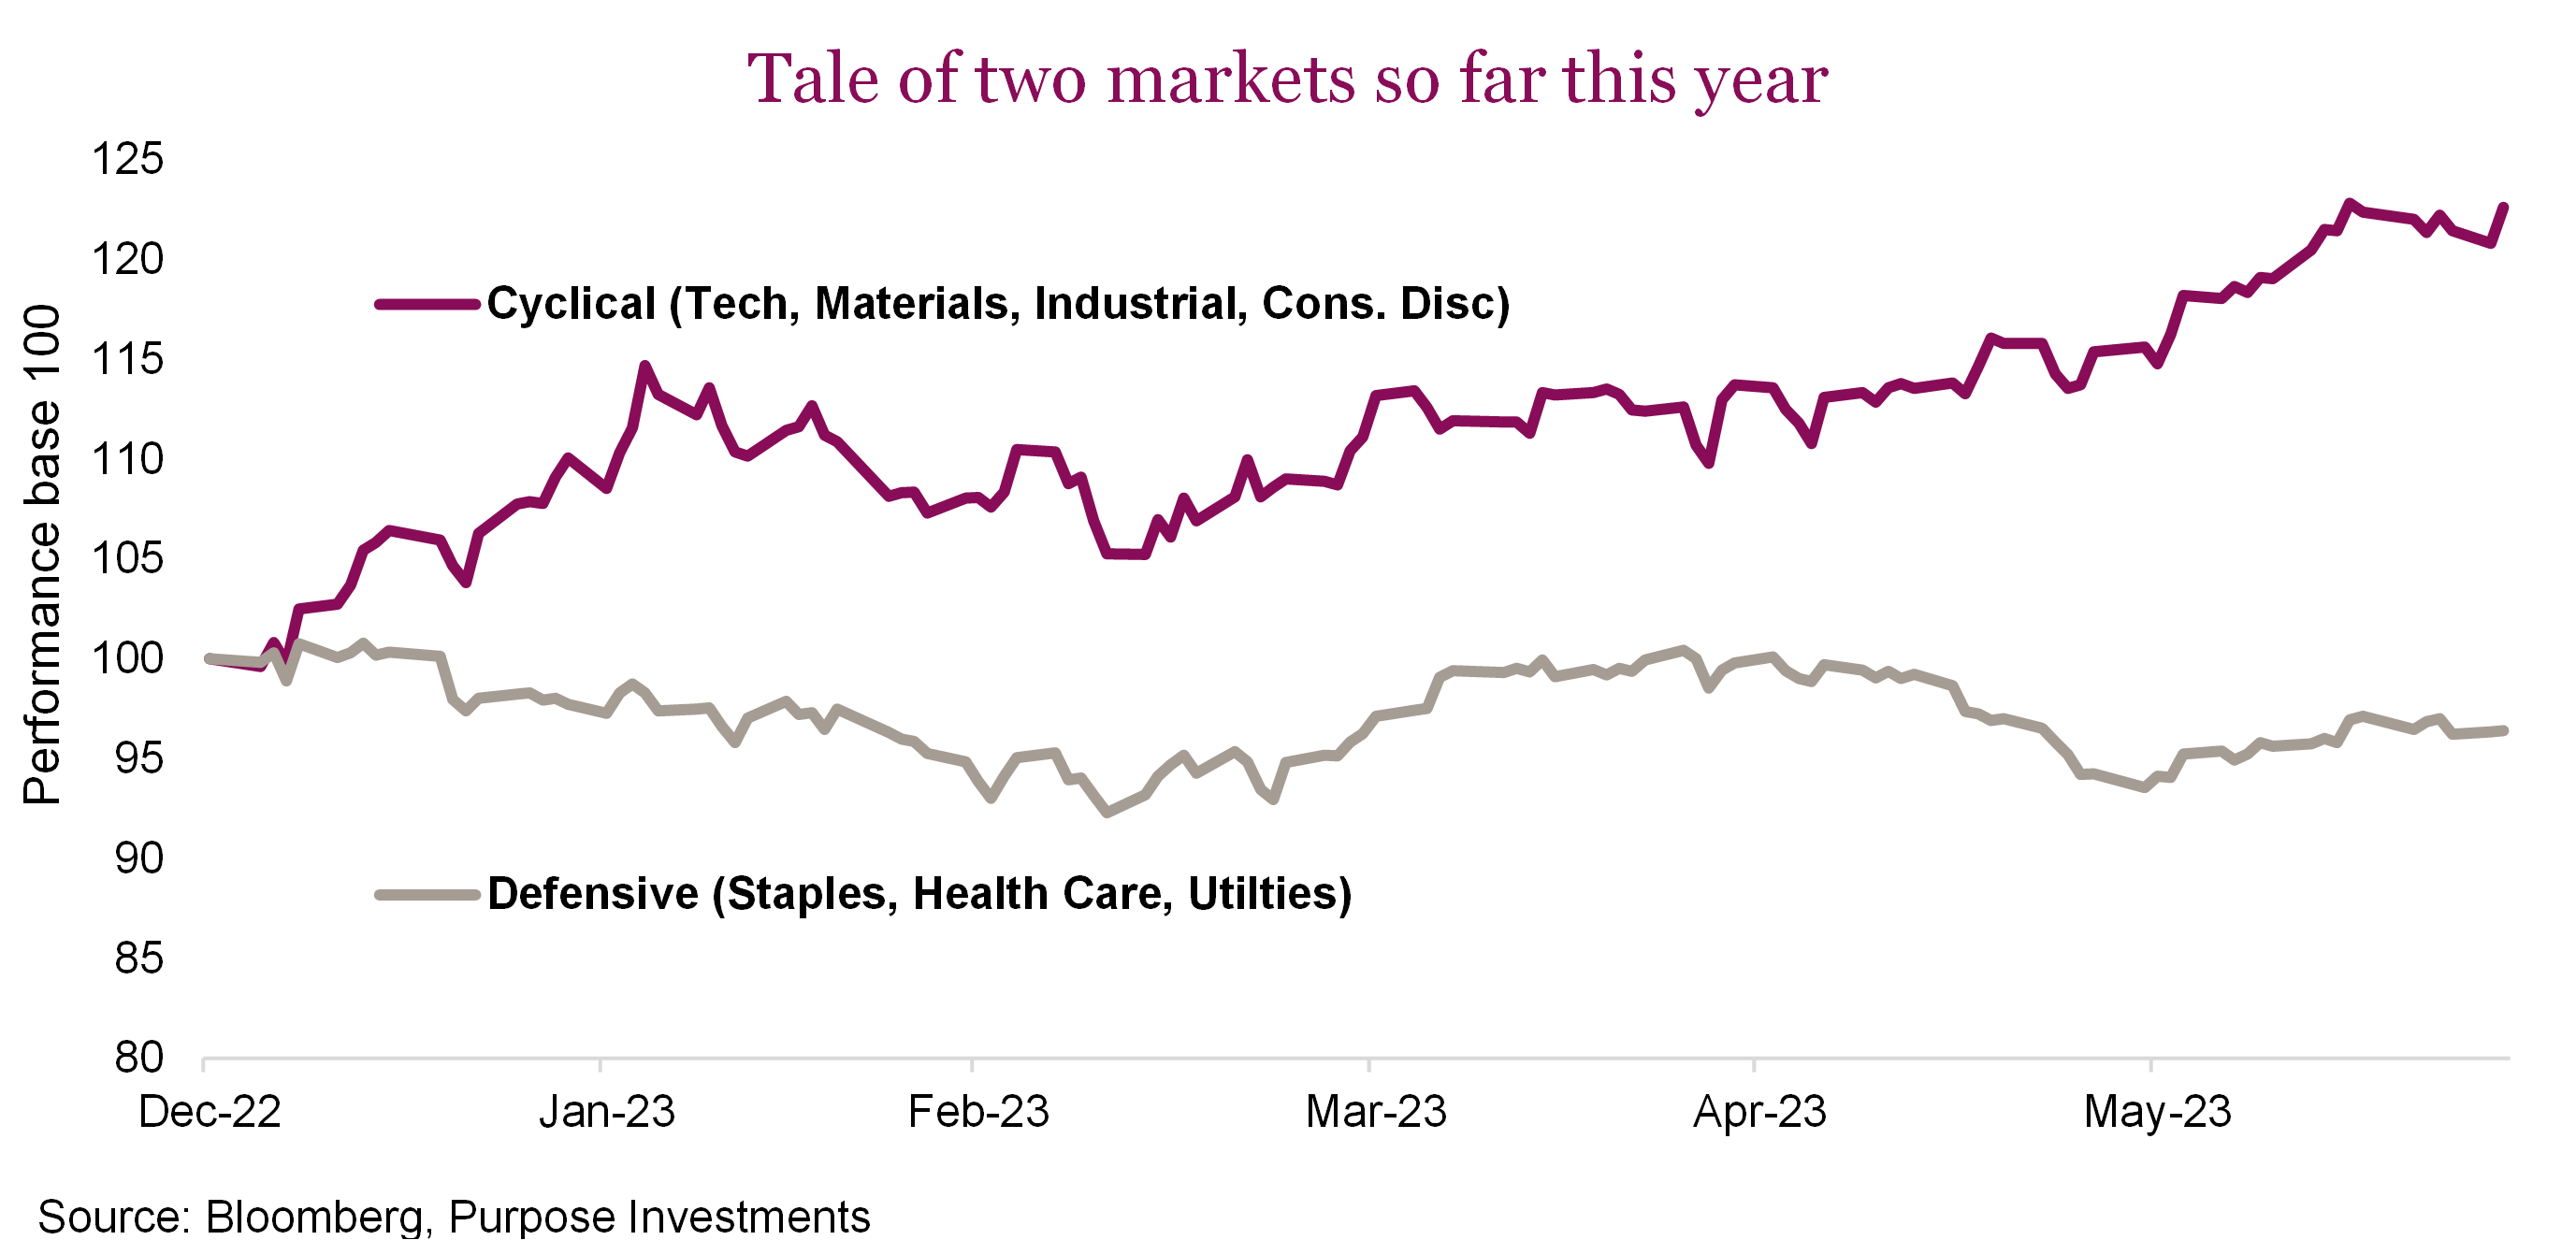
Mega-cap tech companies have broken free of the rising rate handcuffs that restrained the sector in 2022. Unfortunately, not every sector was given the AI key. Central banks have resumed hiking, and there the market is currently expecting more to come. The higher for longer premise has taken a toll on many sectors, in particular Real Estate, Utilities and Telcos. Structural headwinds within parts of the real estate complex, particularly the office sector, remain firmly in place. Infrastructure, especially renewable energy companies, has also faced persistent pressure over the past few quarters. The dislocation across sectors is most evident when comparing cyclical sectors versus defensive sectors. We see the reoccurring K-shape in the graph below, which shows just how disjointed market the market has become. Amidst a murky evolving macro backdrop, spreads between the best and worst-performing sectors over the last three months reached nearly 30% a few weeks ago.
Earnings — not all negative but certainly paying up for them
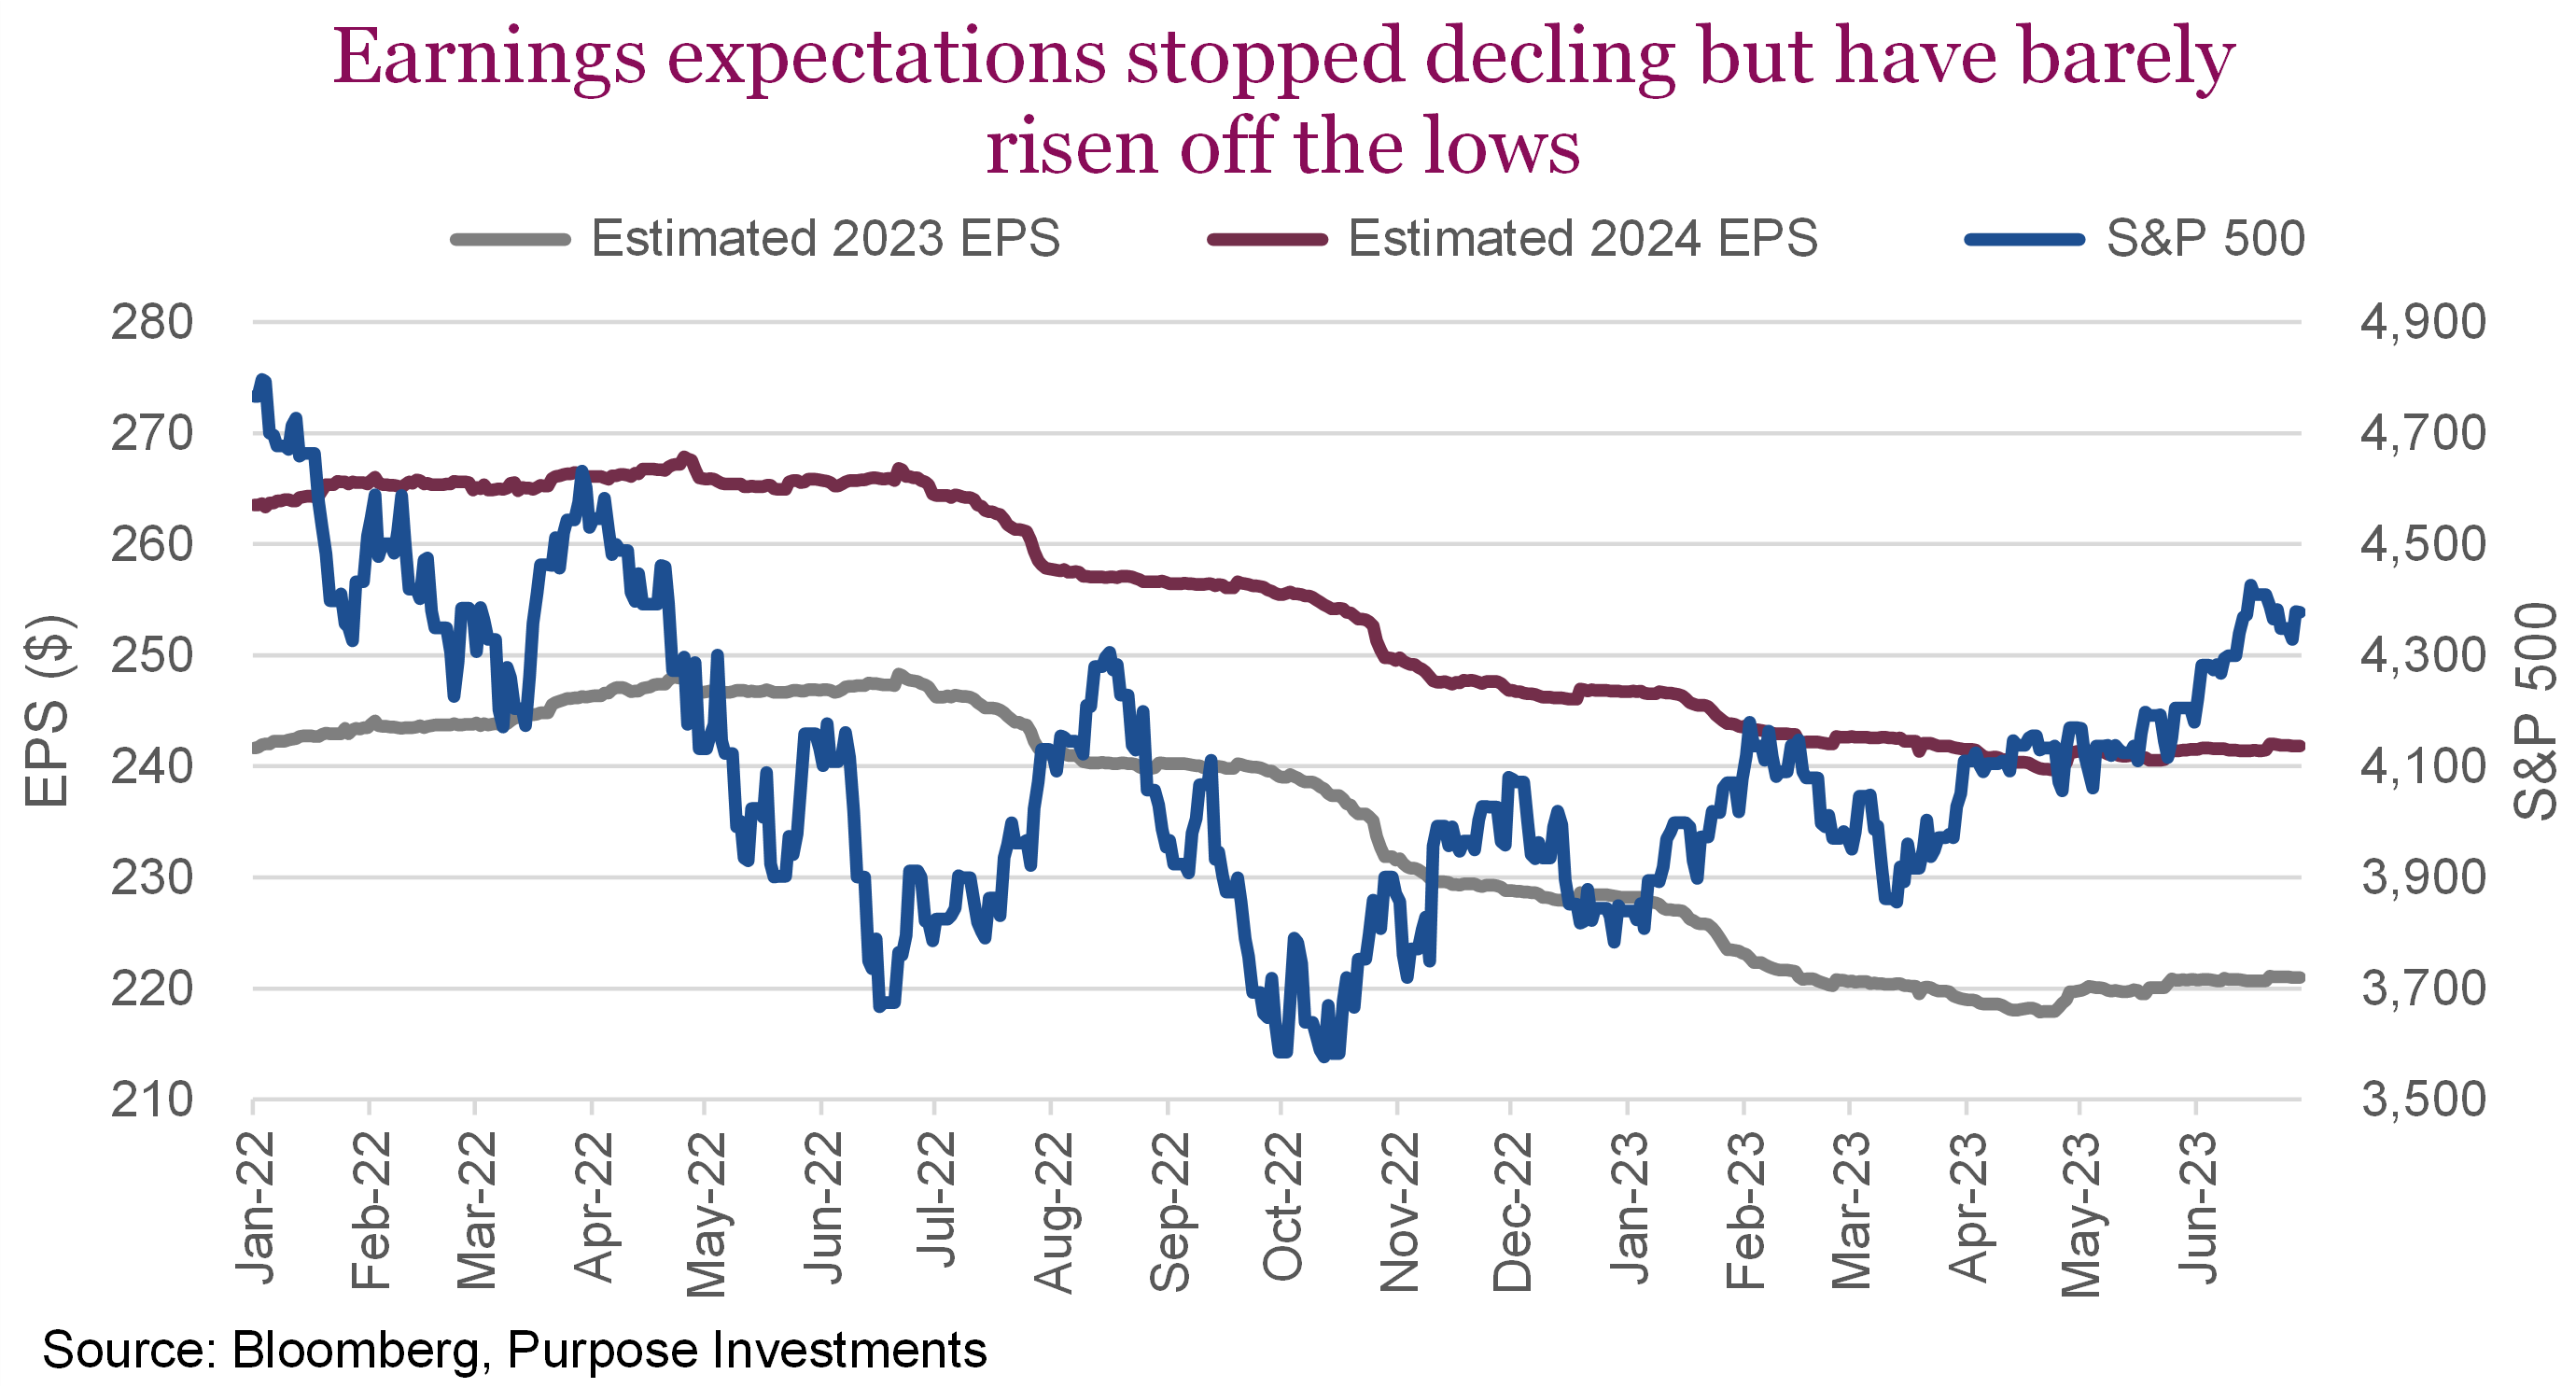
Part of this divergence is fundamentally driven. Headline expected EPS for the S&P 500 for 2023 and 2024 has moved slightly higher. In addition, the 3-month change, which was consistently negative for most of last year, is now positive. Though earning expectations have only risen a paltry 1.4%, the rate of change has drastically improved. With recession forecasts being pushed back and/or tempered towards a soft landing, Tech EPS are up a meaningful 12% from their 2023 lows. Likewise, other cyclical sectors have also seen a recent rebound. Defensives, on the other hand, are lagging. With the beginning of the Q2 earnings season set to kick off in a couple of weeks, we’ll get a better picture of the winners and losers. Perhaps there is still a lot of wishful thinking in these estimates, especially with the vigorous growth penciled in a few quarters from now. Earning expectations are still high and not consistent with any type of recession scenario. The market appears to be fully expecting a soft landing followed by a strong recovery. While possible, we still don’t see this as a probable scenario given the lagged effects of monetary policy that is set to continue to tighten.
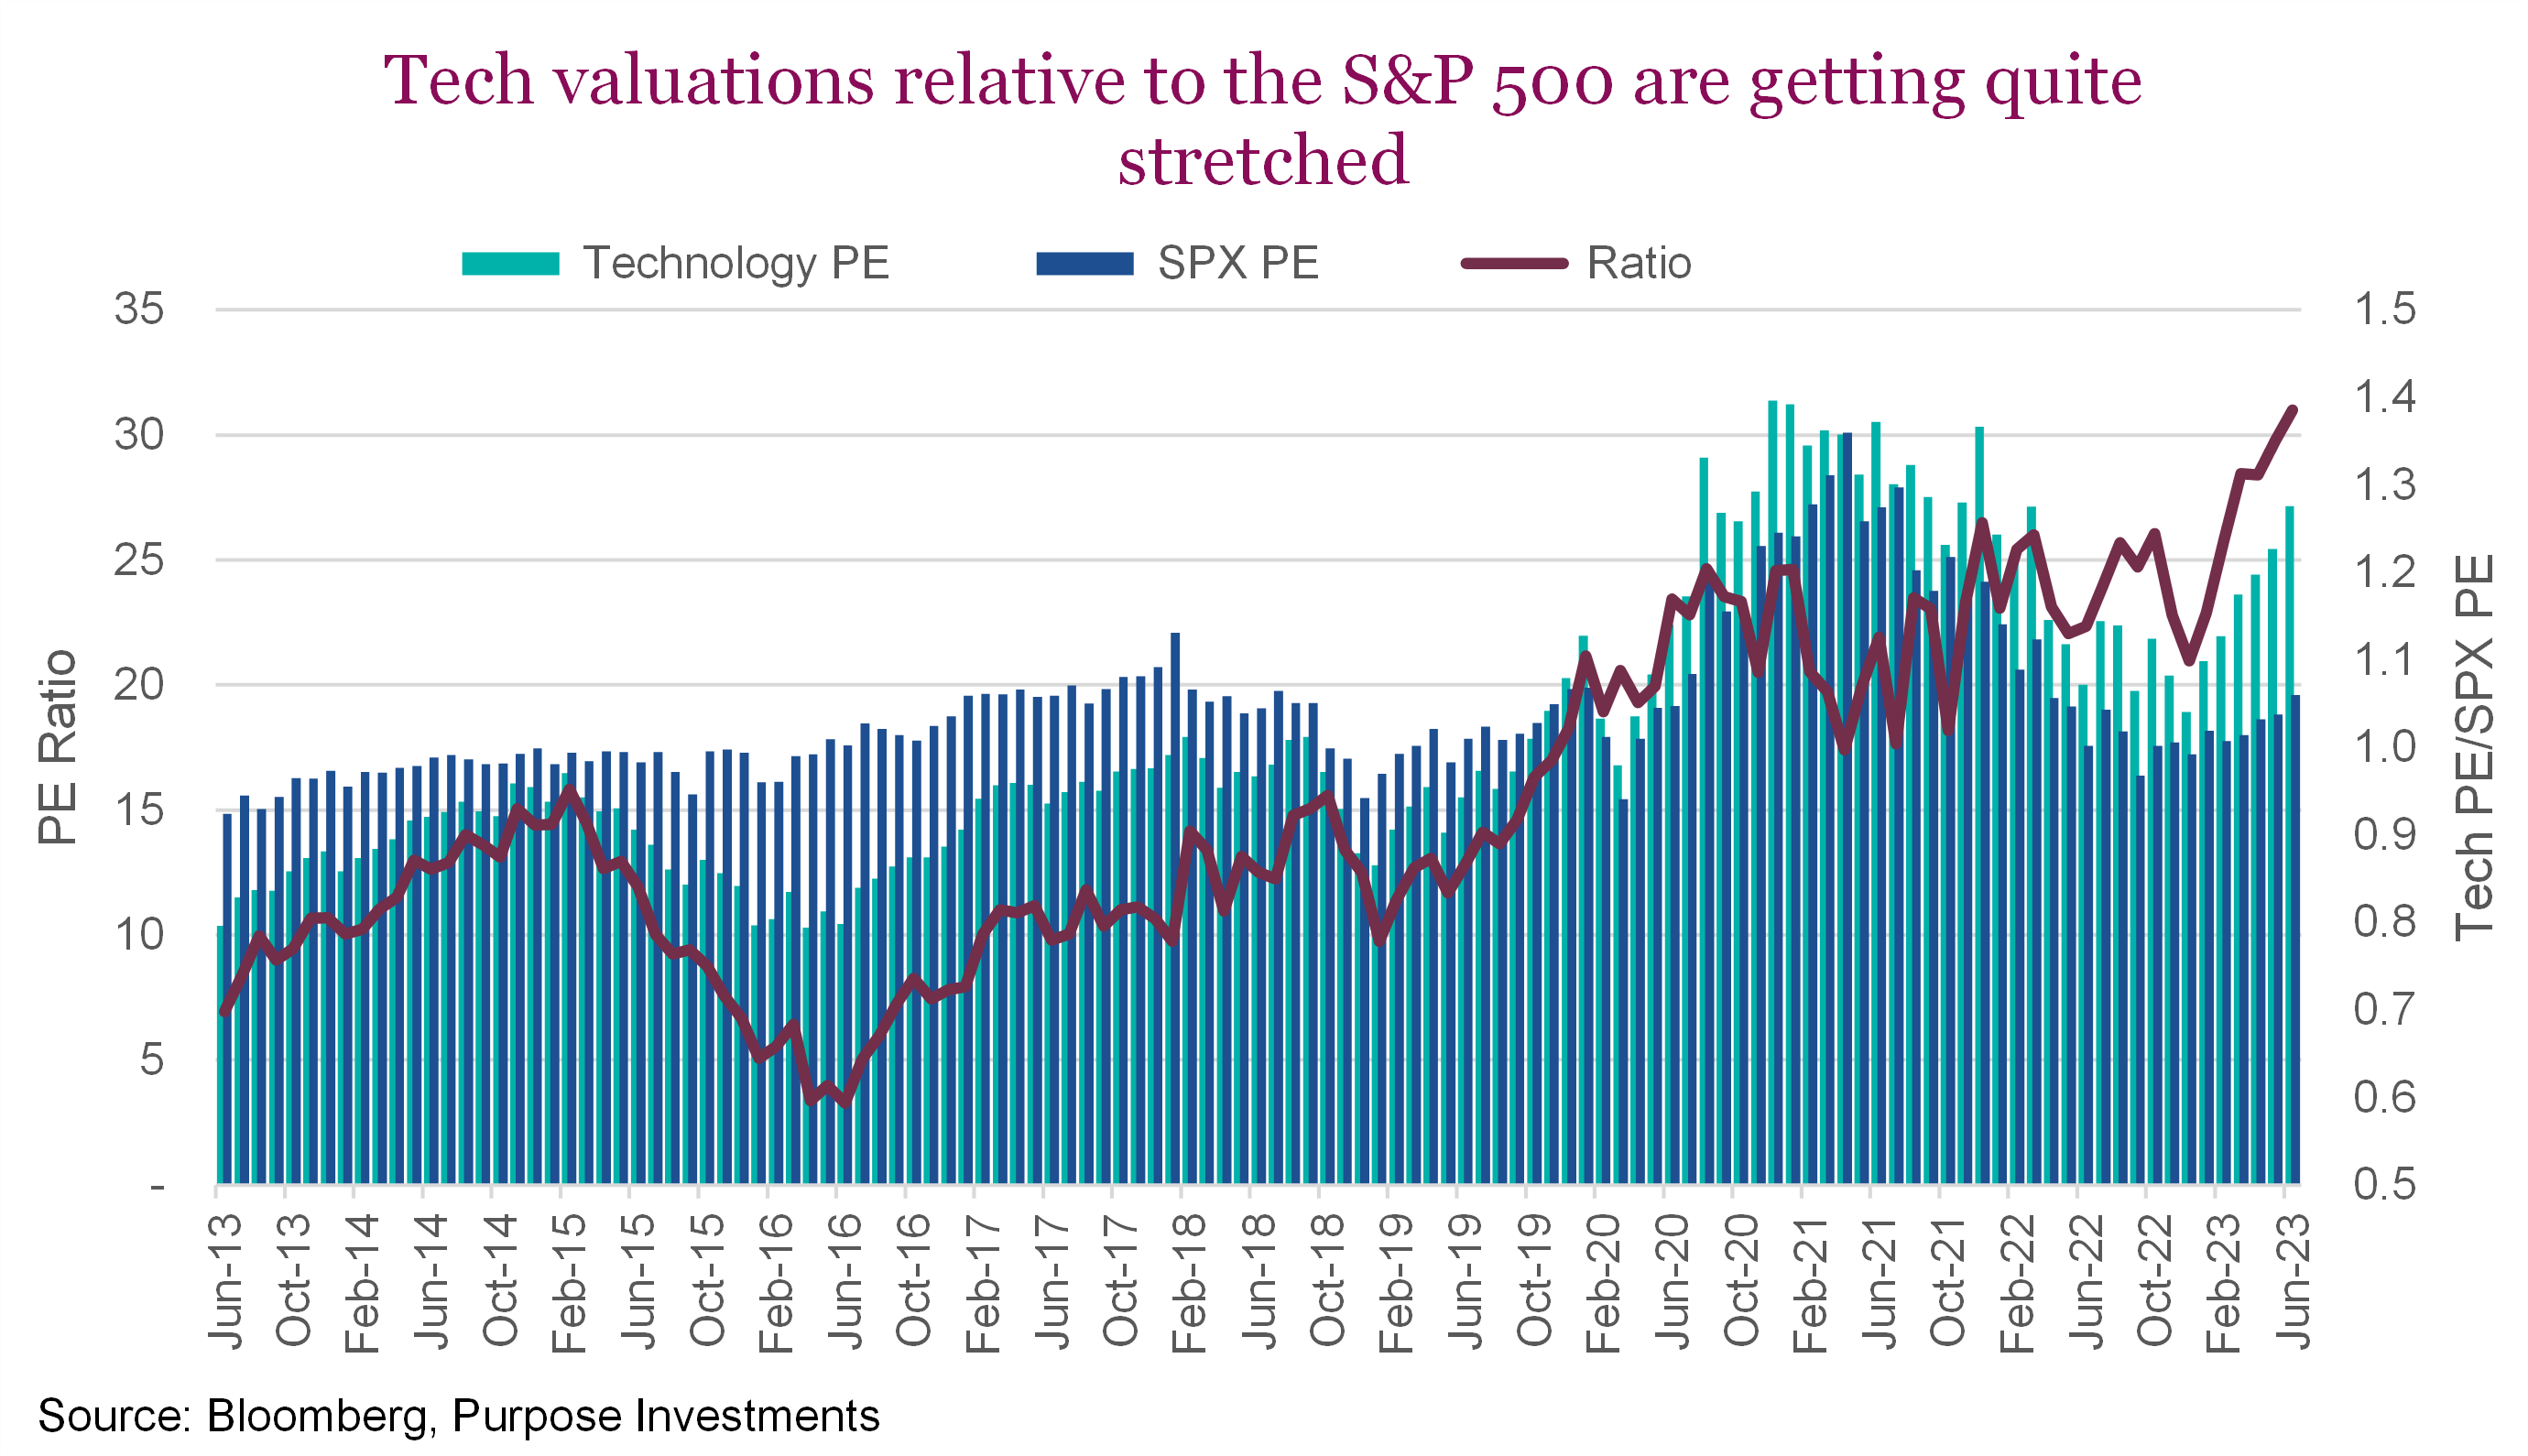
Earnings estimates for the Technology sector have improved, but the market still might have got ahead of itself. In the chart, we have the PE ratio for the S&P 500 Technology index as well as the S&P 500 and the ratio between the two. Valuations for the Technology sector are now 1.4 times higher than the index, which is historically quite stretched. While not quite at 2000 levels where the ratio rose to over two times, investors are clearly paying a high price to gain exposure to AI or the relative safety of fortress-like balance sheets for many of the big tech companies.
Market cycle
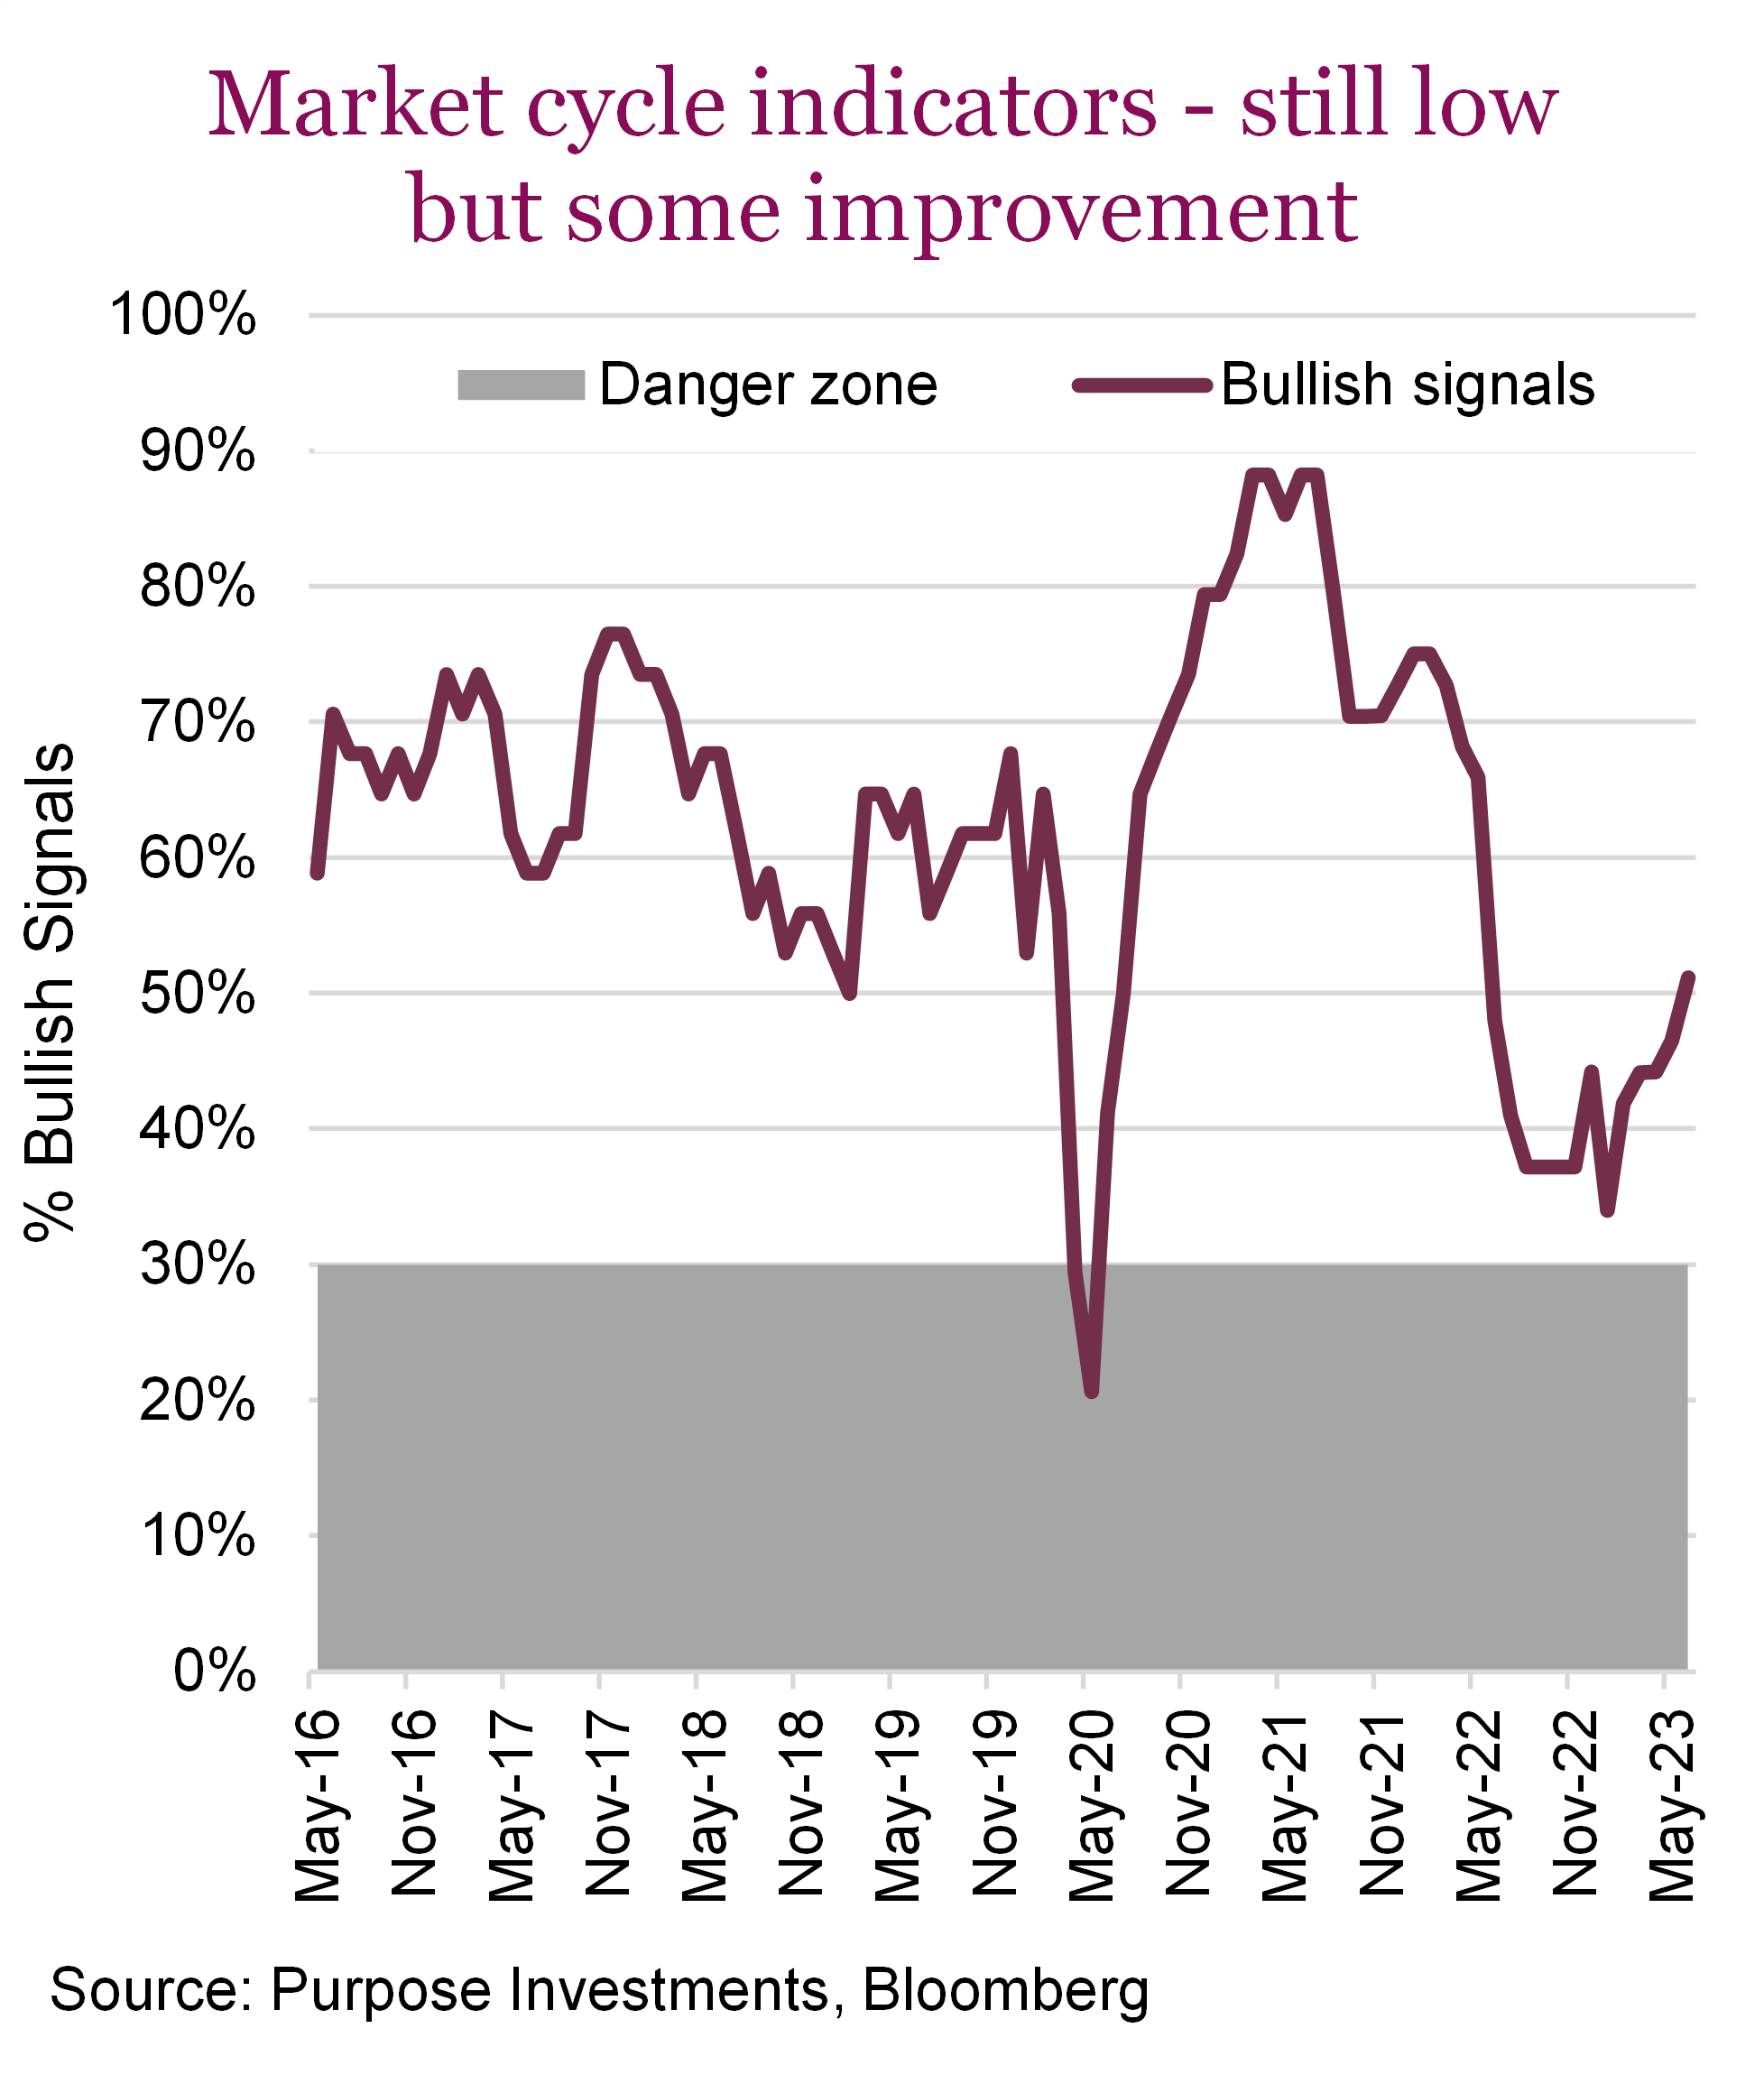
Directionally 2023 is playing out as expected — it is the magnitudes that are really surprising. Inflation, which remains, is gradually fading as a dominant fear in the marketplace. With peak central bank rates nearby and economic activity remaining surprisingly resilient, the market has continued to rally off the October lows. The S&P has regained 66% of its 2022 losses, the TSX 40%, but those losses were much less. International markets have regained 60% of their previous pain, with some markets reaching all-time highs.
One could conclude the next bull cycle has started, and nobody got the memo. Given the biggest bouncers were the biggest decliners in 2022, we believe this is a bear market bounce, albeit a big one. With credit conditions continuing to tighten, more forward-looking economic indicators rather bearish, and earnings starting to contract, we remain cautious. The drop in 2022 was a valuation decline. After this bounce, we believe a fundamental decline looms.
As a result, we remain moderately tilted towards defense. This translates into a moderate underweight in equities, marginal overweight in bonds and holding elevated cash. Among equities, we have a tilt towards international, market weight in Canada and underweight in the U.S. (unfortunate of late). This is partly valuation driven and some initial positioning for the next cycle, which we believe international will outperform. Bond allocations are lighter on credit, and duration is normal after years of low duration. Our base case is some sort of recession, and duration will once again be a portfolio’s friend.
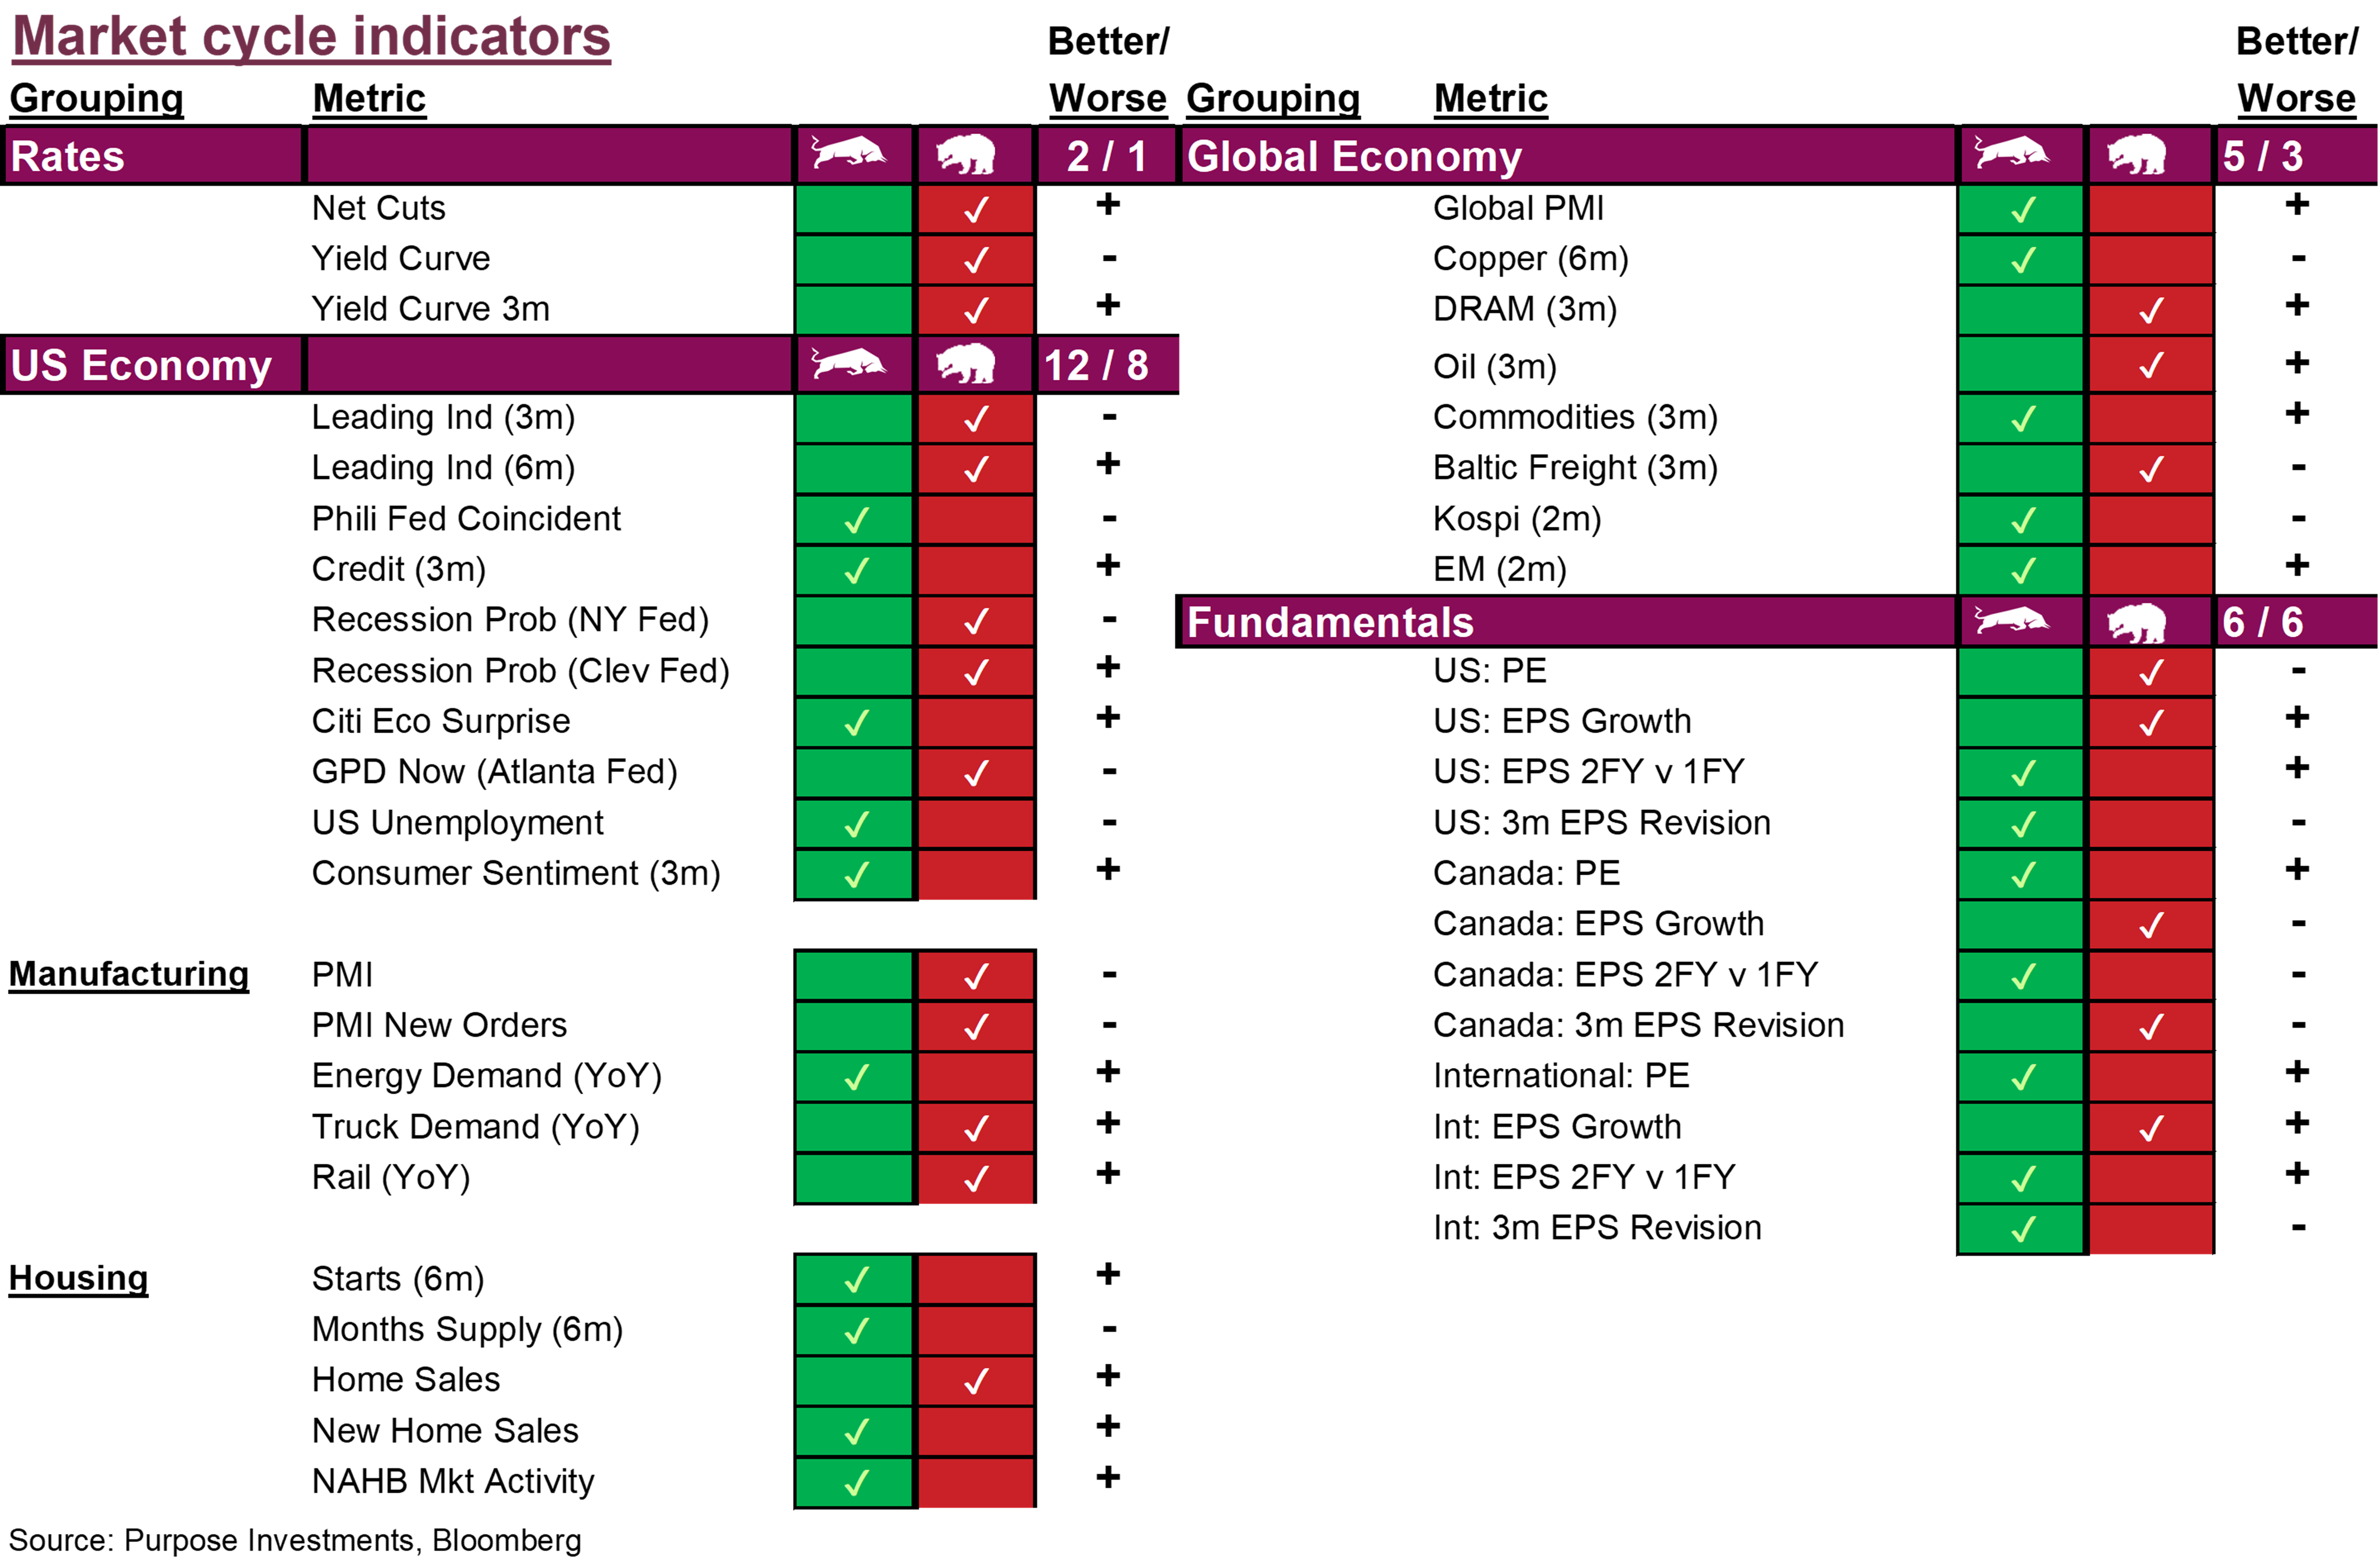
Market cycle indicators have improved a bit but remain below average, warranting our moderate portfolio tilt towards defence. We will remain keenly focused on signs of improvement/deterioration in the manufacturing measures and fundamentals as we enter the Q2 earnings season.
Portfolio positioning
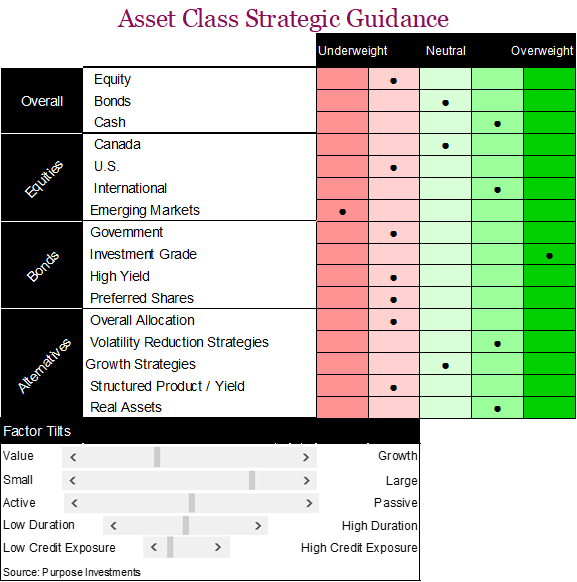
No changes to our portfolio positioning this past month. We remain with a moderate underweight in equities and a moderate overweight in cash and bonds. Full underweight in emerging markets and moderate overweight in international has worked well of late. The moderate underweight in U.S. equities, not so much.
We continue to find decent value in the more conservative parts of the bond market, given the rise in yields. Again, our fear of duration has fallen as a potential recession is our base case. And among alternatives, we continue to lean on volatility or defence strategies with real assets.
The final word
With K-like divergence among different equity markets, within markets depending on cyclicality and defensiveness, among types of economic activity, between different economies and between the market vs forecasts, there is no shortage of mixed signals. This is often a characteristic that becomes prevalent near key turning points. The turning point could be the start of a new bull, but we remain in the camp that it is a potential turn towards an economic or earnings recession.
We continue to lean towards defense but still have enough market exposure in case
our conservative mindset proves misplaced.
Sign up here to receive the Market Ethos by email.
Source: Charts are sourced to Bloomberg L.P., Purpose Investments Inc., and Richardson Wealth unless otherwise noted.
*Authors:
Purpose Investments: Craig Basinger, Chief Market Strategist; Derek Benedet, Portfolio Manager
Richardson Wealth: Andrew Innis, Analyst; Phil Kwon, Head of Portfolio Analytics; Mark Letchumanan, Research; An Nguyen, VP Investment Services
Disclaimers
Richardson Wealth Limited
The opinions expressed in this report are the opinions of the author and readers should not assume they reflect the opinions or recommendations of Richardson Wealth Limited or its affiliates. Assumptions, opinions and estimates constitute the author’s judgment as of the date of this material and are subject to change without notice. We do not warrant the completeness or accuracy of this material, and it should not be relied upon as such. Before acting on any recommendation, you should consider whether it is suitable for your particular circumstances and, if necessary, seek professional advice. Past performance is not indicative of future results. The comments contained herein are general in nature and are not intended to be, nor should be construed to be, legal or tax advice to any particular individual. Accordingly, individuals should consult their own legal or tax advisors for advice with respect to the tax consequences to them.
Richardson Wealth is a trademark of James Richardson & Sons, Limited used under license.
Purpose Investments Inc.
Purpose Investments Inc. is a registered securities entity. Commissions, trailing commissions, management fees and expenses all may be associated with investment funds. Please read the prospectus before investing. If the securities are purchased or sold on a stock exchange, you may pay more or receive less than the current net asset value. Investment funds are not guaranteed, their values change frequently and past performance may not be repeated.
Forward Looking Statements
Forward-looking statements are based on current expectations, estimates, forecasts and projections based on beliefs and assumptions made by author. These statements involve risks and uncertainties and are not guarantees of future performance or results and no assurance can be given that these estimates and expectations will prove to have been correct, and actual outcomes and results may differ materially from what is expressed, implied or projected in such forward-looking statements. Assumptions, opinions and estimates constitute the author’s judgment as of the date of this material and are subject to change without notice. Neither Purpose Investments nor Richardson Wealth warrant the completeness or accuracy of this material, and it should not be relied upon as such. Before acting on any recommendation, you should consider whether it is suitable for your particular circumstances and, if necessary, seek professional advice. Past performance is not indicative of future results. These estimates and expectations involve risks and uncertainties and are not guarantees of future performance or results and no assurance can be given that these estimates and expectations will prove to have been correct, and actual outcomes and results may differ materially from what is expressed, implied or projected in such forward-looking statements. Unless required by applicable law, it is not undertaken, and specifically disclaimed, that there is any intention or obligation to update or revise the forward-looking statements, whether as a result of new information, future events or otherwise.
Before acting on any recommendation, you should consider whether it is suitable for your particular circumstances and, if necessary, seek professional advice.
The particulars contained herein were obtained from sources which we believe are reliable, but are not guaranteed by us and may be incomplete. This is not an official publication or research report of either Richardson Wealth or Purpose Investments, and this is not to be used as a solicitation in any jurisdiction.
This document is not for public distribution, is for informational purposes only, and is not being delivered to you in the context of an offering of any securities, nor is it a recommendation or solicitation to buy, hold or sell any security.
Richardson Wealth Limited, Member Canadian Investor Protection Fund.
Richardson Wealth is a trademark of James Richardson & Sons, Limited used under license.