
Investor Strategy
October 8, 2024
Navigating the fog
Sign up here to receive the Market Ethos by email.
Executive summary
Anticipated volatility in September didn’t come as expected. Though markets wobbled at the beginning of the month, risk appetite and optimism came back in a hurry following the Fed jump-starting its easing cycle with a 50-bps cut mid-month. With more rate cuts on the horizon, markets pushed to all-time highs this month in both Canada and the United States. Focus has now shifted towards the data, Q3 earnings, and of course the U.S. election in November. The path ahead remains uncertain with the fog of the election all around. Regardless of the limited visibility, markets appear cautiously confident.
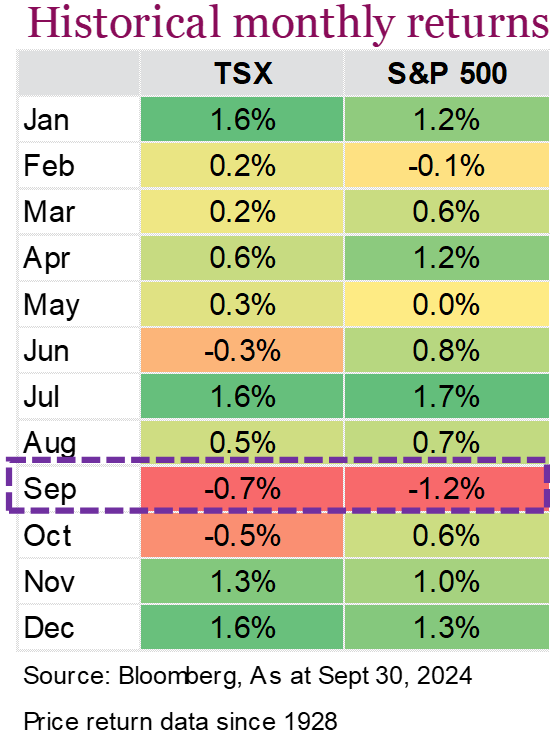
Unseasonable September
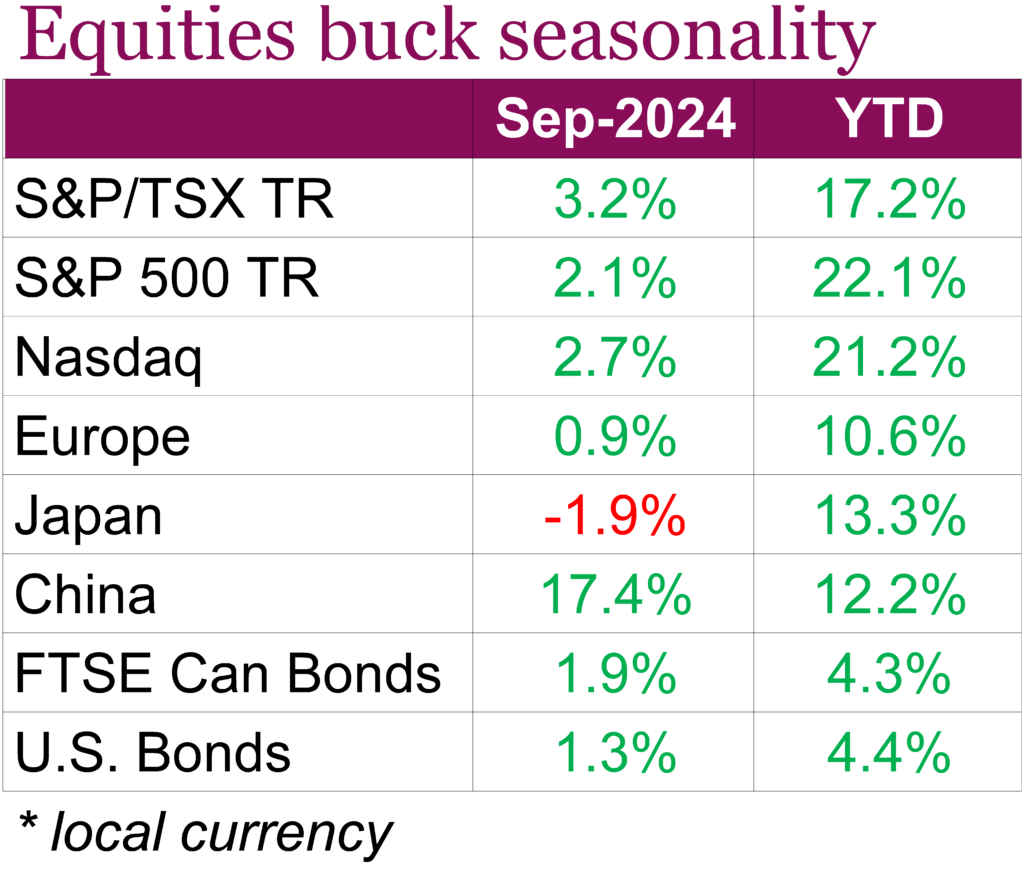
Despite historically being a tough month for markets, equities and bonds rallied in September. What’s more impressive is that equity markets were able to rebound with strong gains after falling at the beginning of the month, with the Nasdaq, S&P 500, and TSX having -5.8%, -4.2%, and -2.4% declines respectively in the first week of September. Sentiment quickly shifted after the Fed’s jumbo 50 bps rate cut on September 18, and while recession concerns remain front of mind, there is growing confidence that the Fed will continue to loosen policy and that a soft landing in the U.S. can be achieved. Adding to this, inflation in Canada surprised to the downside, falling to 2.0% on a y/y basis in August. The headline figure reached the BoC’s target rate for the first time since 2021, primarily on falling gas prices. The Bank of Canada has already reduced rates three times since June, bringing the overnight rate to 4.25%, however, August’s inflation data reinforced confidence that inflation is under control, leaving room for further cuts. When it was all said and done, on a total return basis, the S&P 500 finished 2.1% higher for the month while the TSX was up 3.2% and the Nasdaq up 2.8%. The S&P 500 saw its fifth consecutive month of gains and had its best start to a year since 1997, now up 22.1% YTD.
Global stocks also saw strong gains after China’s central bank made its largest-ever one-year policy rate cut, lowering the medium-term lending facility rate by 30 bps to 2%, as part of a broader stimulus package aimed at reviving its slowing economy and avoiding deflation. This move was followed up by further measures to lower borrowing costs, boost market confidence, and help China achieve its 5% growth target for 2024. The Hang Seng Index finished the month up 18.3% while the CSI 300 closed 21.1% higher on a total return basis.
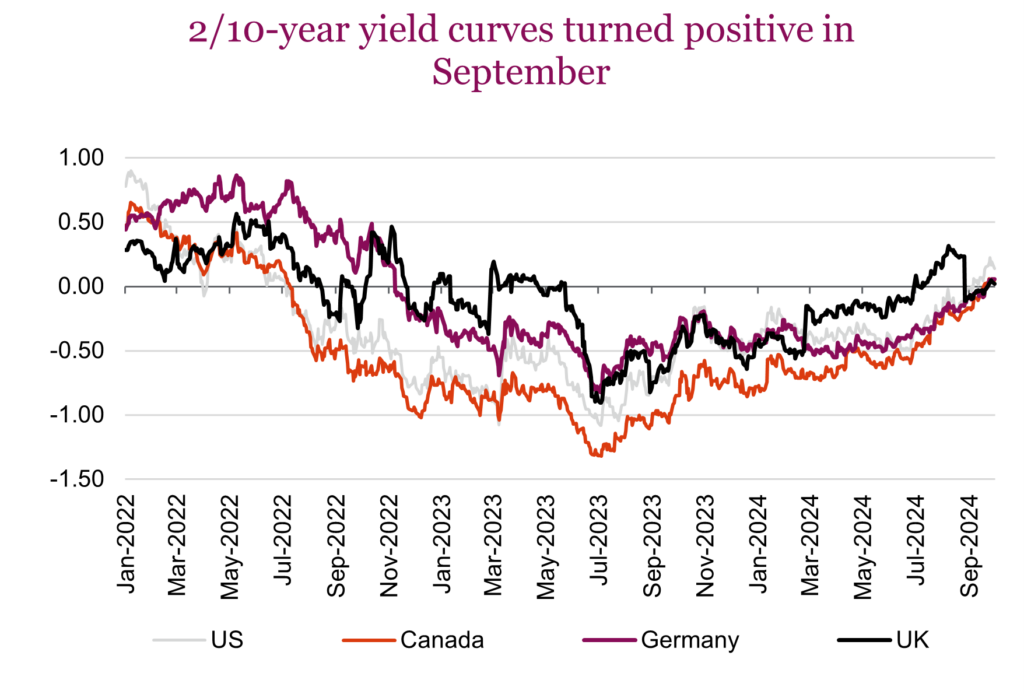
Bond markets were helped by encouraging economic data and the Fed’s rate decision, which helped both the Canadian and U.S. 2/10-year yield curve to un-invert. Global bond yield curves, which have been inverted for years, are now normalizing as central banks lower interest rates to counter slowing economies and avoid recessions. This reversal, seen in markets like the U.S., UK, Germany, and Canada, is driven by falling short-term yields as investors bet on further rate cuts. The steepening of yield curves reflects growing concerns over potential recessions but also hints at confidence that central banks, particularly the Fed, may engineer a soft landing for the economy. By month end, the U.S. Aggregate Bond was up 1.3% while Canadian bonds, measured by the FTSE Canada Universe Bond, was up 1.9%.
Markets are well known to ‘climb a wall of worry’ and have done that very well this year. We entered the year on the lookout for a recession and slowdown in earnings growth, but those fears have diminished, and markets have now embraced thoughts of an economic ‘soft landing’ in the U.S. which the data appears to corroborate.
Foggy
Anticipated volatility in September didn’t come as expected. Though markets wobbled at the beginning of the month, risk appetite and optimism came back in a hurry following the Fed jump-starting its easing cycle with a 50-bps cut mid-month. With more rate cuts on the horizon, markets pushed to all-time highs this month in both Canada and the United States. Focus has now shifted towards the data, Q3 earnings, and of course the U.S. election in November. The path ahead remains uncertain with the fog of the election all around. Regardless of the limited visibility, markets appear cautiously confident.
Too many cuts priced in
The market may be pricing in too many interest rate cuts from the Federal Reserve, given the fact that the U.S. economy continues to grow. Jerome Powell did his best recently to emphasize his intentions that the Fed is “not on any preset course” and that the most recent cut should not be interpreted as a sign that future rate cuts will be aggressive. Despite this, money markets even last week saw a one in three chance the Fed will cut another 50 bps in November. This will depend heavily on the data of course, but given that government policies remain more inflationary than deflationary it’s likely the market has overshot rate expectations to the downside. It’s already begun to walk back some of these expectations. The chart below shows the anticipated FOMC rate over the course of next year. It’s already begun to move higher. Striking the right balance between bringing inflation down and supporting labour markets is key. We’ll see further readjustments – but we have our doubts that we’ll see another 175 bps decline in short rates by the end of 2025. As always, the data will dictate the path, not market expectations.
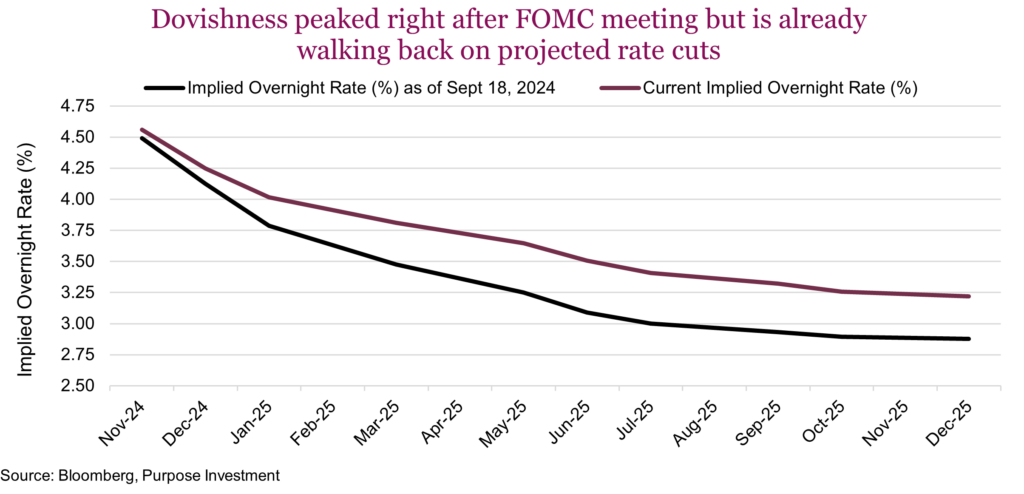
More broadly, though, it may call some of the pricing further down the line into question. The curve is already flattening but if that data continues to be strong, we’ll see projected rate cuts continue to disappear. Which incidentally also goes against the weight of market positioning. Rates have already risen considerably from the September lows, which equities have happily absorbed. Should this continue, we expect stocks could have an adverse reaction.
The labour question
When the fog is thick, visibility is reduced. Instruments can help guide us through, such as a compass. Labour markets are the compass, they will guide the Fed and markets through the fog even when the course is unclear. This was reinforced by Jerome Powell this week. His remarks noted the puzzling disconnect between strong growth data and weaker unemployment data. Thankfully, the economy is still doing well which must make the Fed a bit less worried that labour market weakening will lose control.
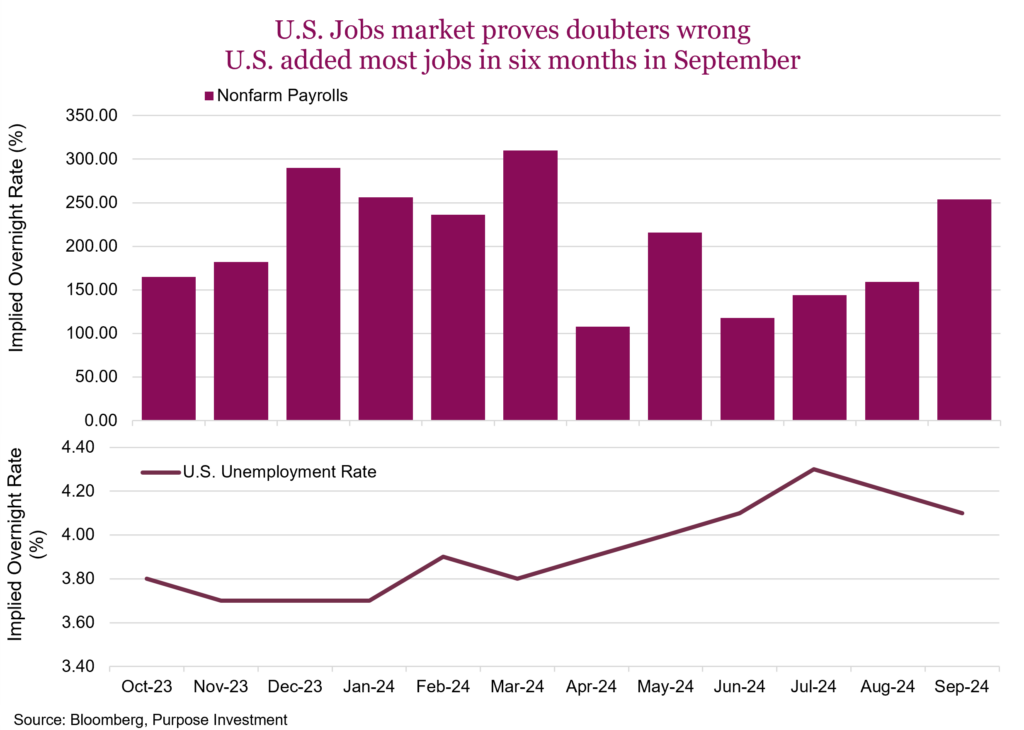
In September, the latest employment report rose 254,000, smashing expectations of a gain of 150,000. The unemployment rate actually dropped to 4.1%, going back to June levels. Only two out of 71 economists in the Bloomberg survey forecasted the unemployment rate to drop, which just shows the futility of forecasting. On all accounts, the release has eased concerns that the jobs market was weakening faster than expected and the Fed was well behind the curve. Immediately the market began walking back rate cut expectations, now pricing in under 100 bps of Fed easing over the next four meetings. From the Fed’s perspective, concerns over inflation were put to bed with the attention instead focused on the labour market. Demand for workers is still healthy and if the labour market is the compass, it is pointing straight ahead. No course change is required.
What type of landing?
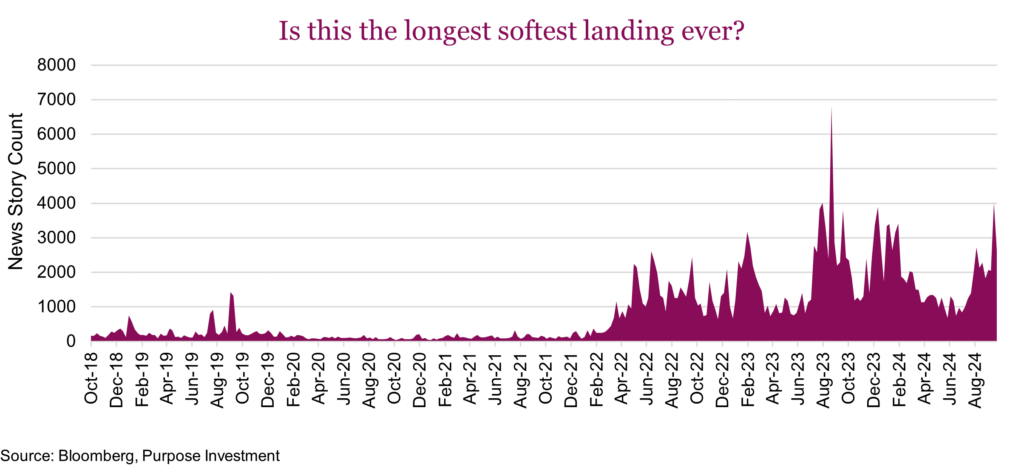
Mentions of a ‘soft landing’ in the news have surged once again. This might very well be the longest softest landing ever as journalists have been mentioning it for three years now. The mentions peaked in August 2023, but the story count seen below is feverish. At some point, you have to think the runway is going to run out and by that point, it won’t matter how soft the landing is. Perhaps the no-landing narrative will take flight once again. Following the latest jobs number it’s a real possibility. For now, the soft landing is the most popular narrative supported by the data. The narrative plays an important role in influencing economic behaviour, markets, and even economic outcomes. Contagious ideas like this can shape expectations and even create their own momentum by serving as the lens through which investors interpret data.
Reading through the fog
Navigating the investment landscape through the fog of an uncertain election requires a delicate balance. While the growth path is promising, investors must remain vigilant about the potential impact of rising interest rates, unpredictable market reactions, and ongoing labour dynamics. Unemployment levels are not at a concerning level and the troubling trend that was in place appears to have reversed. A soft landing, though a strong possibility, is not a given. Uncertainty is a constant variable when making portfolio allocation decisions. It’s hard to quantify but looking at gold at an all-time high and cash levels on the sidelines approaching $6.5 trillion in the U.S, it’s clear that many investors are looking for ways to protect their gains by reducing risks.
S&P: Set it and forget it?
Asked about U.S. equity a portfolio manager recently said, “Why not just buy the S&P and forget about it?” Honestly, it’s a fair question, and at first glance, the logical answer seems to be, “Why not?” U.S. equities are quietly having one of their best years since the 90s. If you look at the S&P 500’s performance over the past 20 years, not only is this the best year so far through the end of September, but if you look at the top-ranked full calendar years, 2019, 2021, and 2023 all rank in the top four. Whether it’s been a conscious decision to overweight U.S. equities, or simply the result of market growth and increasing model exposure, it’s no surprise that portfolios are so heavily tilted toward U.S. stocks. Why wouldn’t that be the case when the market keeps rewarding that choice; it hasn’t been a mistake by any means, the S&P 500 total return index is up 64.5% in just two years. Saying that out loud almost sounds ridiculous, but after 45 new highs in 2024, here we are!

Investors seem confident that the market will keep cruising along, but what if it doesn’t? We have seen this happen a few times before. What if an unforeseen market event comes along and the market takes a hit like it did in ’08? That kind of pullback, around 50%, would cause devastation and wreck a lot of retirement plans. While the current environment seems to be flooded with liquidity, there’s no guarantee that dip-buying will always be there to save the day. We may sound like a broken record, but our goal is to continue to bring awareness to underlying portfolio exposures that not all portfolio managers may be aware of.
When looking at your portfolio you may not realize that you are overweight U.S. exposure. Understanding that the baseline may differ from investor to investor, there remains a good probability that the U.S. equities is much higher than you would believe. It’s probably one of two things that caused this: either investors don’t realize how much their exposure has increased or they are aware and are just letting it run with a baseline higher than most. Either of these scenarios makes sense and even if investors are not aware, it has been the right call for over a decade. After such a long stretch of success, it’s no surprise that investors have grown comfortable. Anchoring bias has led most investors there, focusing on the recent strong runs of the S&P 500 so much that we have forgotten that there have been similar returns found across the globe. Maybe it’s time to rebrand anchoring bias as “comfortability bias.”
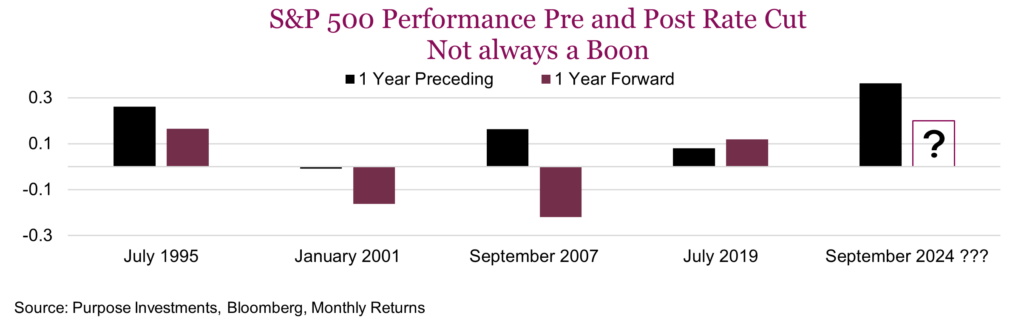
But what about moving forward? The direction of rates in the U.S. economy is known and there’s a lot of hype around rate cuts being a boon for the market, but history shows it’s not that simple. Logical thinking might suggest with lower rates, stocks will do well. Borrowing becomes cheaper and earnings start to improve and over the long run, this is true. But it is much more nuanced in the short term, and understanding why the Fed is cutting has a pretty big impact. Look at what’s happened to the S&P 500 the last four times the Fed started cutting rates. The year before the cut the market was up three out of four times. The 1-year forward returns show a 50/50 shot of a negative or positive return. This year, we’re seeing the best pre-cut performance in the last five cycles, but what happens next is anyone’s guess. We can expect the effects of these rate cuts will likely play across markets for quite some time. The “Fed playbook” is there, but just like any other playbook sometimes that play gets blown up.
Without having a lot of data to evaluate for rate-cutting cycles, understanding “Why?” for the Fed is important. The Fed’s reasoning behind rate cuts can drive market reactions differently depending on whether it’s seen as a precaution against a recession or a routine policy adjustment. While some of the potential benefits of rate cuts may already be reflected in current stock prices, market volatility is expected due to ongoing uncertainty. Regardless, in any environment, the market’s response will not be very predictable as the Fed navigates these inflection points.
The bottom line is that portfolios are rightly or wrongly loaded up on U.S. stocks, and while that’s been the right call for a while, it’s difficult to say if it will continue to be. As said before, it’s all subjective of what is considered a “neutral” or baseline U.S. allocation. Keep an eye on portfolio weightings, as there are many global opportunities to explore, and diversification remains a key strategy for long-term success. With increasing risks and high valuations, it might be time to rethink those weightings. We advocate for a more balanced approach, with valuations stretched as noted in the previous section, the potential for disappointments is elevated.
Market cycle
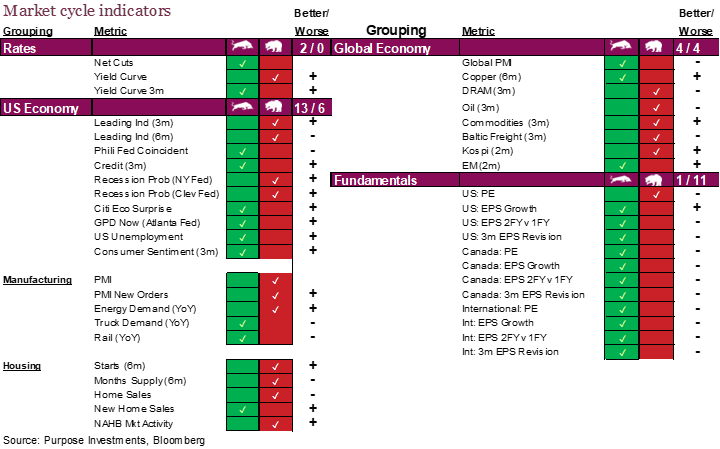
Market cycle indicators eroded for several months, and even dipped further intra-month in September getting very close to crossing below 50 but bouncing back up to finish the month at 58% positive.
Compared to last month the U.S. economy gained four bullish signals. GDP Now, from the Atlanta Fed, which is an econometric model built around more high-frequency data, increased from 2% at the end of August to 2.5%. Within this measure, it was strengthening export estimates that were the big driver. Other signals that flipped were the Citi Economic Surprise index and Consumer sentiment. Sentiment measures have increased to their highest level since April. Inflation easing would be a big contributor to this as well as lower interest rates. Manufacturing metrics still are moderately weak but beginning to see some positive trends in the PMI data.
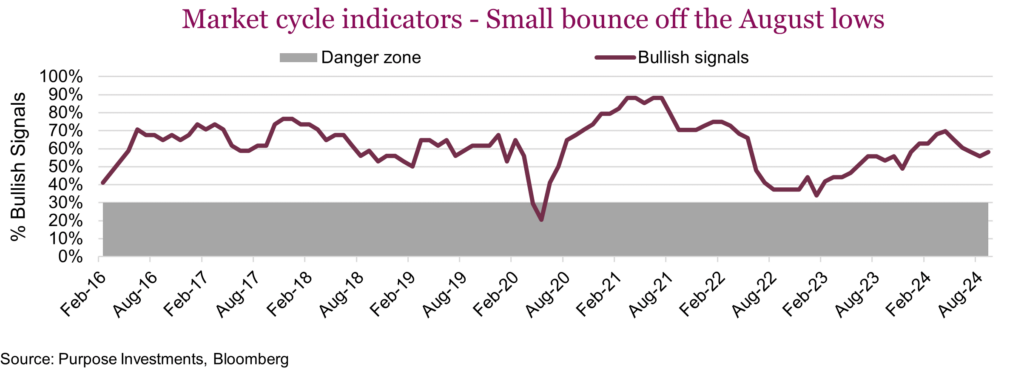
Outside the U.S., the Global Economy section gained a bullish signal but also lost one. Resulting in a 50/50 split. DRAM signals flipped to negative, but the Baltic Freight indicator moved into bullish territory. Shipping rates rose to their highest rates in nearly three months thanks in large part to China’s stimulus plans and surging commodity prices. The port shutdown in the U.S. may begin to cause havoc with global shipping and supply chains and this indicator is quite volatile. The KOSPI is still bearish but it, along with a several other indicators, are improving.
Final thoughts
We don’t believe it’s the time to be chasing markets higher, given the uncertainty over the next couple of months. Despite the fog, markets are at all-time highs. Rates might not go down as much as some expect, but if it’s because the economy doesn’t falter perhaps the most popular narrative is the right one.