
Market Ethos
21 September 2026
Bullion meets Bitcoin
Sign up here to receive the Market Ethos by email.
In early 2022, U.S. inflation as measured by CPI peaked at 9.1% and gold broke over $2,000/oz just like it is supposed to, right? Gold, as a real asset, has that long reputation for being a hedge against inflation. This reputation was really solidified in the 1970s and early 1980s, which we always thought might be a bit spurious. Inflation was very evident in the 1970s and gold went up a lot. But gold had been at an artificially fixed price for many decades prior to the 1970s, so a good chunk of that appreciation may have been it finding its real price after being manipulated for decades. Worth noting, the gold to inflation correlation has fallen each decade since the 1970s and so far in the 2020s, it has actually been negative. Inflation is a heck of a lot lower than 9% today, and gold is much higher.
One rule with gold investing, you best be prepared to be confused as its behaviour is often hard to explain. For evidence, let’s look at a gold model that we ‘borrowed’ a few years back [borrowed is a fancy way of saying we saw it and rebuilt it ourselves]. It was smart and intuitive, incorporating many widely accepted drivers for the price of gold. This includes the US dollar, real yields, inflation as measured by two-year break evens, the VIX as a proxy for broader unease and gold ETF flows. The dollar and real yields carried the most influence. This model was awesome for almost two decades. Look at how tight the model vs gold price remained from 2004-2021.
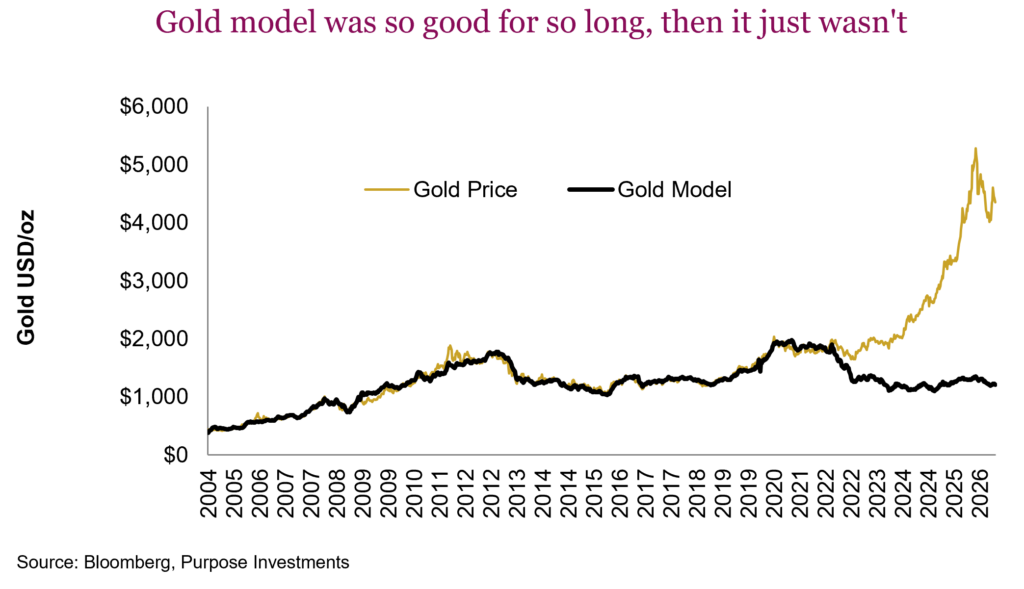
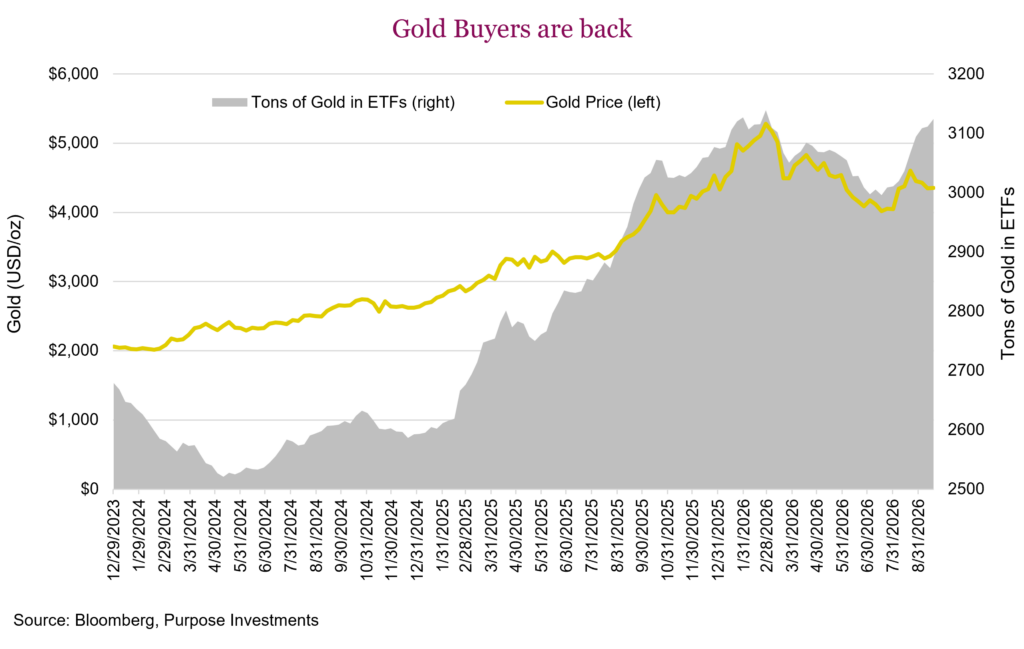
In the quant world, building the model is easy — understanding it and when it may stop working is the skill separator. It’s safe to say that the old gold model is broken. Training up a new gold model after 2021 using the same input factors fits well with the rise in gold but with much different factor weights. The U.S. dollar is still a meaningful influence, but real yields flipped direction, which does sound suspect. The other big difference is that ETF flows have become a much bigger factor in explaining the moves in gold. The good news of late, with all this talk about debt sustainability, is that inflows into gold bullion ETFs have resumed.
There was a time that talking gold only appealed to a few investors. But now for any Canadian it has become a performance driver for the TSX Composite. Gold miners have a 13.7% weight in the TSX — that is bigger than utilities, consumer staples, consumer discretionary, communication services and real estate combined. The materials sector, which is dominated by gold and silver miners, is larger than energy. So, you better have an opinion as gold is too big to ignore.
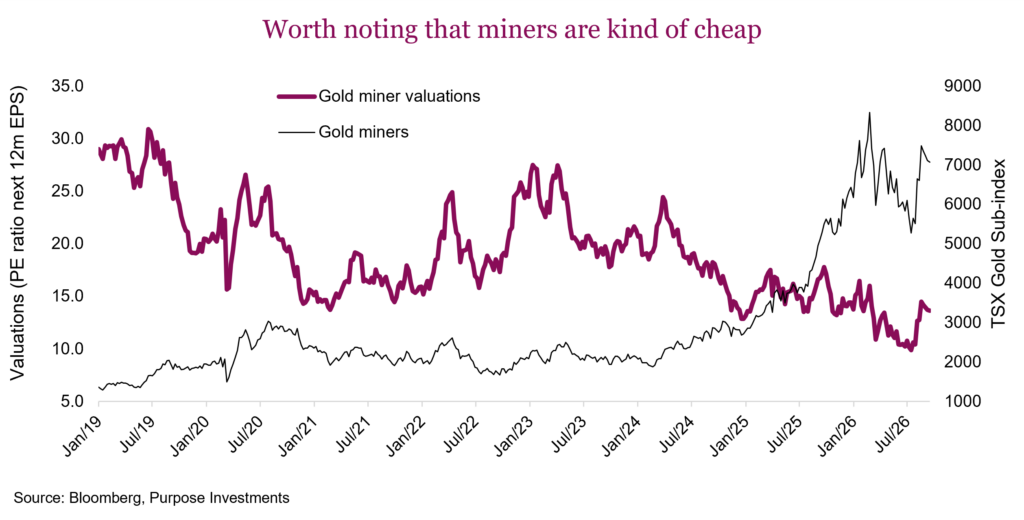
We remain constructive on gold miners, and bullion. The Canadian Gold index (TSX Gold Sub Industry Index) is obviously up a good amount over the past few years, but much of this has been thanks to strong earnings growth. Based on consensus estimates for the next 12 months, the index is trading at 13.6x. The valuation is even a bit more compelling given in 2026 earnings are forecast to be $325 and growing to $395 next year. 21% growth with a PE ratio below 14x is a good combo, acknowledging these earnings are very sensitive to oscillations in the price of gold.
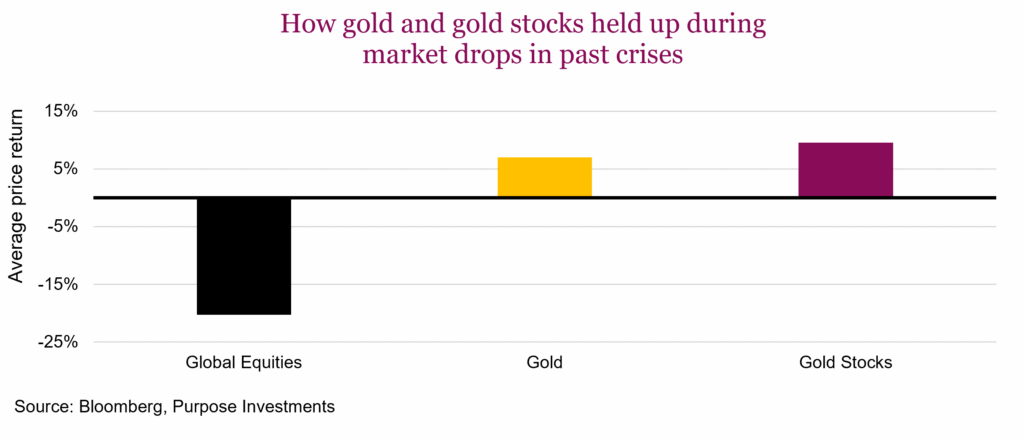
For bullion, we also have a positive view. It is a diversifier that has a very strong track record. The chart below tracks most major drops in global equity prices since 1990, measuring the drop in equities, peak to trough, compared to the drop in gold bullion and gold miners. Certainly, in times of trouble gold has a good track record. It is not lost on us that during the market weakness earlier this year with the conflict around Iran, gold did not deliver. Nothing works all the time.
As we have highlighted in past Ethos, we are not overly concerned about global debt risks. That being said, it is a bit higher risk today than in years past. And gold should be a good diversifier in case this risk does ramp. So, there you have it, constructive on gold miners with the caveat they have run a lot over the past few weeks. And a bit more constructive on bullion as a portfolio diversifier. Now let’s talk ‘new gold’.
Bitcoin: New gold?
Many refer to Bitcoin as new gold or digital gold, owing to its engineered scarcity. Based on our work, it isn’t new gold, it’s Bitcoin. And that isn’t a bad thing, it does offer a unique performance profile. One of the challenges remains its history, as Bitcoin ten years ago is very different than Bitcoin today. The vehicles to access it, size, price are all very different. This does make modelling its characteristics challenging.
In our team’s opinion, from a portfolio construction perspective, gold is crisis alpha, Bitcoin is a potential performance booster with unique volatility characteristics. If the market does go risk-off, such as in those past crises in the chart above, Bitcoin has not provided solace. While it didn’t exist during the first half of those events, for the second half of the list it did. And it fell, on average, a little more than equities during those episodes.
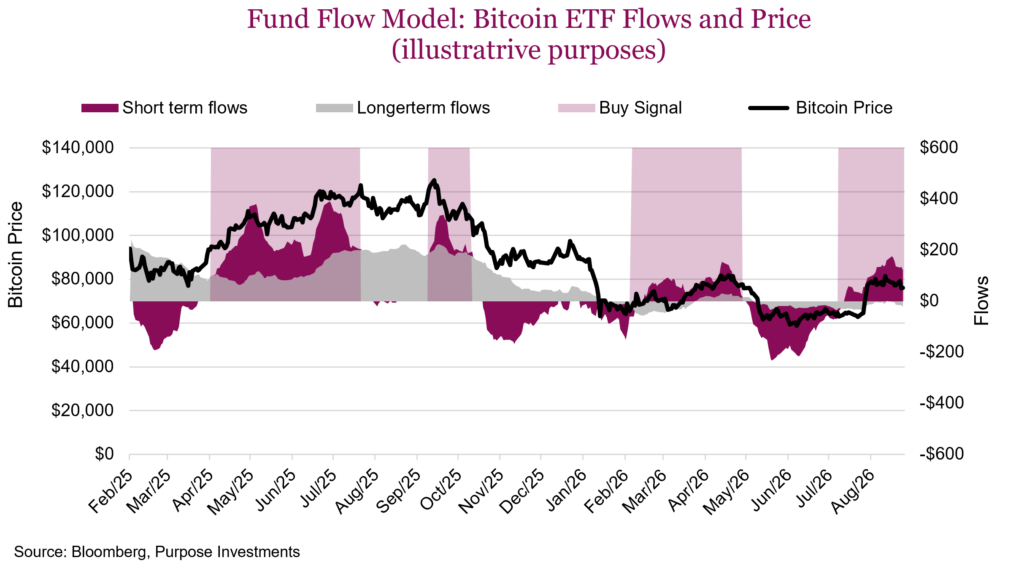
If we were building a quant model, it would be predicated on the view that with a somewhat fixed supply, variances in demand become the primary driver of price. To gauge deteriorating or improving supply/demand dynamics, we believe this will be captured in Bitcoin ETF fund flows. Increased buying will show up in rising ETF issuance and vice versa. This model attempts to capture rising or falling investor demand/interest in owning Bitcoin. We don’t know if rising Bitcoin prices increase flows or if flows cause prices to rise. Regardless, this model appears to participate in upswings decently, while also avoiding some of those bigger downswings.
ETF flows are broken down into a longer-term average and a shorter-term moving average. When the shorter-term average is above the longer-term average, there is rising or accelerating buying. And when below, there is slowing buying or selling. Of course, news and overall market risk appetite are big factors in Bitcoin’s price moves, which are captured in aggregate investor behaviour via flows. This model is not systematic but can help guide our view on Bitcoin. It is currently constructive for Bitcoin after turning positive on July 31, although flows have started to soften a bit.
Final thoughts
Perhaps the biggest commonality between gold and Bitcoin is if you own either one, you had best be prepared to be confused by its behaviour. That may just be the reason they are diversifiers, with very different characteristics.