Market Ethos
February 20, 2024
The market’s not broken … just riskier
Sign up here to receive the Market Ethos by email.
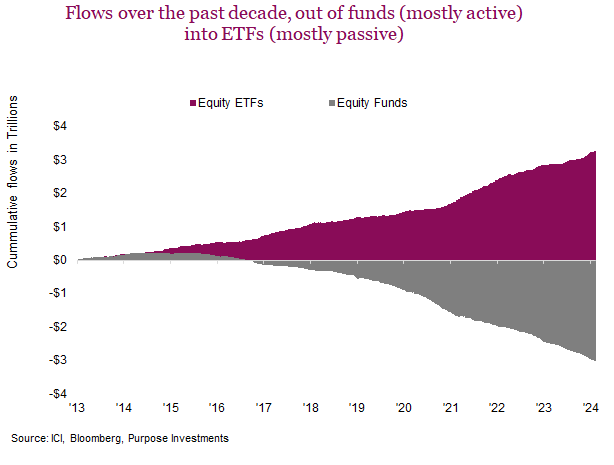
There has been a lot of chatter over the past couple weeks about the rise of passive investing distorting the market, leading to increased concentration and less price discovery. We encourage readers to listen to the February 8 ‘Masters in Business’ podcast with David Einhorn. We would add the caveat that his views are certainly at one end of the spectrum, albeit with some rather compelling points. The steady redemptions over the years from active managers and a reallocation to passive, has created more steady selling pressure in strategies that focus on value or fundamentals. Meanwhile, increased flows to passive are resulting in more of a momentum trade. Passive index strategies never met a PE ratio they didn’t like.
We don’t believe this has broken the market but would certainly concede it has made markets riskier. You have likely read reports highlighting the concentration risk in the S&P 500, driven by the Magnificent 7. Today these few names comprise about 30% of the largest equity market in the world. And over the past year, with the S&P 500 up 18.6%, 9.1% of this rise is attributed to those seven names. Safe to say the S&P 500 is rather concentrated and leadership is pretty narrow.
In fact, this concentration coupled with U.S. equity market outperformance over the past decade has really distorted even global equity markets. If someone were to buy a capitalization weighted index capturing all equities traded in developed markets, that does sound like it would be well diversified. Sadly no. The Bloomberg Developed Market index currently carries a 70% in U.S. equities. Clearly our old rule of thumb that global markets were 50-55% U.S., 30% Europe and the rest spread out is antiquated.
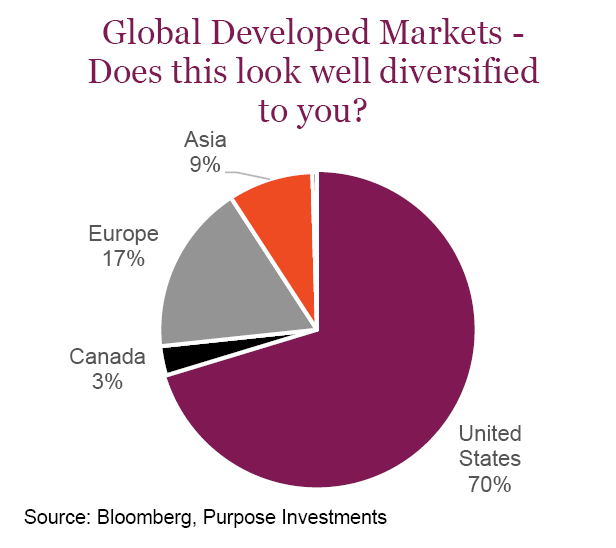
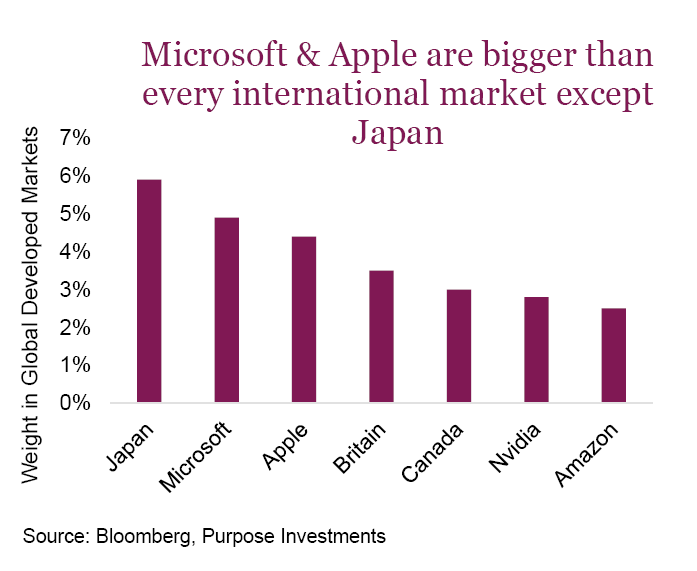
Equally incredible is that Nvidia is now roughly the same weight as Canada. Microsoft and Apple are roughly the same weight as all of Asia. This naturally leads to thinking this is tech bubble 2.0, (referring to tech bubble 1.0 as the 1990s internet bubble). Concentration is similar, the U.S. equity weight globally was also similar, and performance being driven by a narrow handful of names is similar. However, the 1990s was dominated by telecom equipment names, the builders of the internet backbone. This was much narrower than today. Simplifying each company’s many business lines, Apple is a device maker, Microsoft is software/cloud, Nvidia is a semiconductor maker, Amazon is a fulfillment/cloud company, while Google and Meta sell digital ads. These are more diverse businesses than the 90s tech bubble leaders.
And let’s not forget, these companies have earnings – material earnings at that. Across the Magnificent 7 they have trailing pretax income of over $400 billion. That is a far cry from valuations in the late 1990s, when new valuation metrics such as price to eyeballs were being bantered around given a lack of actual earnings.
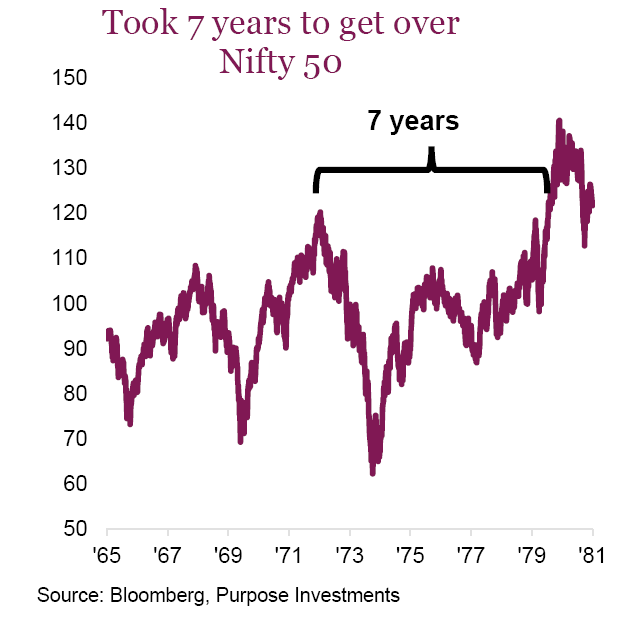
In fact, today’s market probably has more similarities to the Nifty 50 than the 1990s tech bubble. For those not familiar, the Nifty 50 was a bubble in high growth stocks that ran from the late 1960s to early 1970s. It was a decade led by growth over value (similar to today) and the growth names became dominant in the index as they grew faster over time (again, similar to today). The names in the Nifty 50 were pretty diverse, including General Electric, IBM, Coca-Cola, Xerox, and of course Avon Products and Polaroid.
The Nifty 50 were called one-way stocks; you just had to own them and valuations didn’t matter. Furthermore, portfolio managers had to own them to keep up with the index. Sound familiar? Today there are more and more managers altering their strategies to incorporate some Nvidia or Amazon, simply trying to keep up with the index. And there is a cohort that believes these companies are recession proof given their handling of the 2020 pandemic-induced recession and strong balance sheets. We believe that view is misguided; the pandemic recession was a unique confluence of events that hopefully won’t happen again during our investment lives.
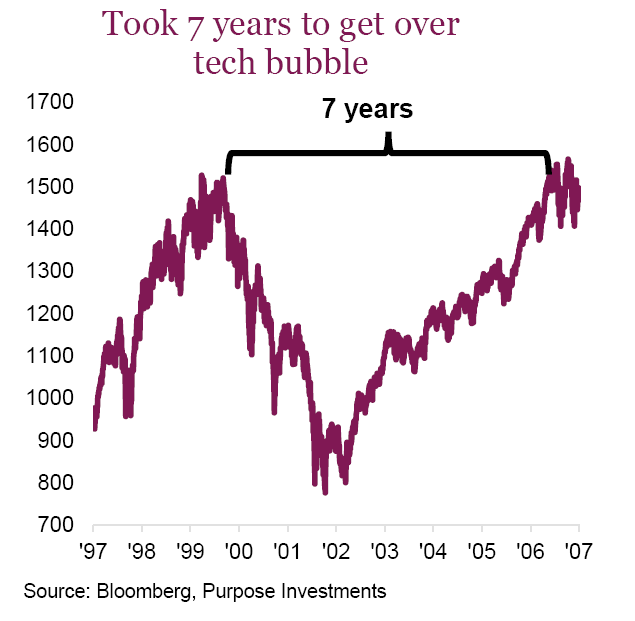
So what ended the Nifty 50 era? Two things, inflation and a recession. This combination dispelled investors’ view that these companies had such great prospects that they had become immune to the business cycle. And given the high concentrated weight in the index of those growth names, it led to a seven-year drought without the index making a new high. Quite similar to the drought of new highs following the tech bubble of the late 1990s.
We like both active and passive strategies, really depending on the market and the desire exposure. But it is imperative to know the underlying exposures in both active and passive strategies. Most passive strategies, often in ETF form, are tracking market capitalization weighted indices. That means whatever trades on the market or sits in that index carries a weight, given the size of the company. There is no committee that says the S&P 500 has too much technology (29%) or too little energy (4%). Or for the TSX with 31% financials and 0.3% health care. Nobody controls the risk in an index, which is why it remains important to understand the exposures, and how that combines with the rest of a portfolio. Hence if you want more international exposure, the World Index is not the answer.
Final thoughts
This does have the characteristics of a bubble. The unknown is whether it has a few years to go before peaking, or a few months or only days. One could easily argue that the Nifty 50 and tech bubble ended simply because they went too far. Expectations had become so high that any stumble would have a significant blowback on the share prices. Recession simply causes more companies to stumble around the same time, even if in different industries.
Whenever it does end, there is likely going to be a long hangover.