
Market Ethos
March 17, 2025
Warning signs popping up
Sign up here to receive the Market Ethos by email.
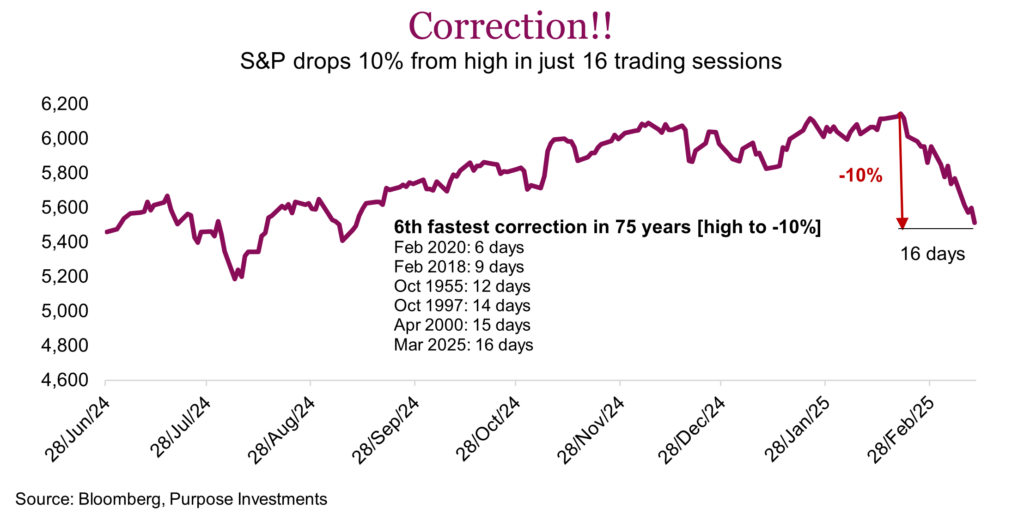
The S&P 500 closed in correction territory last Thursday, down -10% from its previous high. It actually dipped into correction territory on Tuesday intraday, but for most it’s the close that counts. What makes this correction a bit more unique is the speed and lack of omnipresence. The S&P 500 made a new all-time high on February 19, just under a month ago. That made this correction the sixth-fastest since 1950. Faster corrections include Covid in 2020, the implosion of vol option harvesting notes in 2018, the Asian currency crisis in 1997 and the start of the tech bust in 2000. Have no clue what happened in 1955, but we will find out.
Of course everyone is aware of why the market is down. The policy uncertainty and flip-floppery has worn down market patience. This has continued while at the same time the economic data has shown some signs of slowing. Markets can handle bad news, it is usually priced in very quickly and painfully. Like tripping off a bandaid quickly. Then things move on. Unfortunately, uncertainty is more challenging and lingers.
Why markets dislike uncertainty– In a normal market most investors are sitting on allocations, anchored in their conviction the portfolio is designed and allocated to help them reach their goals. When great uncertainty comes into the market, whether its economic data, this policy mess around tariffs, or war, etc. investors begin questioning their allocation. The longer the uncertainty lasts, especially if it ebbs and flows from a bit more optimist to pessimistic, more and more investors become less anchored. For example, in early February, let’s say 80% of folks thought a manageable tariff policy could be found through negotiations. We would guess that is a much lower percentage today. But it could rise again, even with an encouraging tweet, that is the uncertainty.
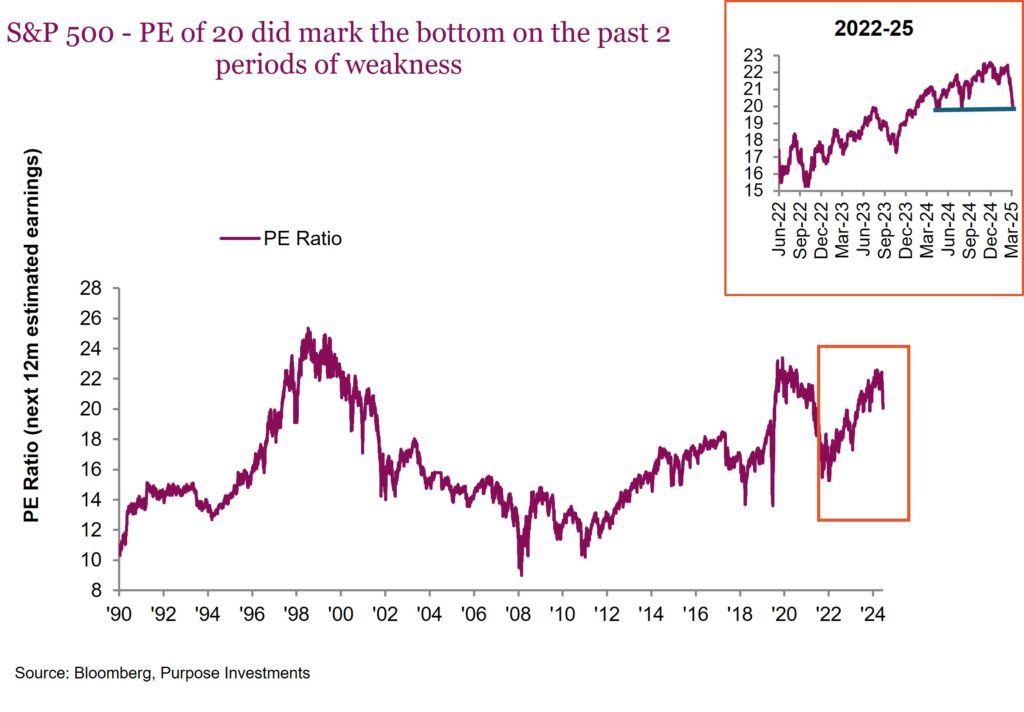
These folks that become unanchored with their allocation, opting to tilt more defensive perhaps, are countered by another cohort – value buyers. Ok, maybe they are now more known as the “buy-the-dip’ers”. Three weeks ago, the S&P was trading over 22x forward earnings (PE); today it is down to 20x — coincidentally the valuation trough on the two most recent periods of weakness in April and August 2024 (chart). 20x might be cheap enough to lure in some dip buying, while deeper value investors would probably wait for a better deal and risk missing an opportunity. Back in 2022, the PE got to below 16x. And if you look back farther, even 16x is not cheap.
Is 20x cheap enough to entice enough dip buyers to offset those tilting to be more defensive? This balance determines where the market goes next.
Lack of omnipresence – Often during periods of market weakness, correlations between different equity markets go to 1 and everybody falls. That is not this. Year-to-date the S&P is down -5%, and the tech-heavy NASDAQ -9%. Canada’s TSX is down a minor -1%. Meanwhile Germany is up +15% with a number of European markets up double digit. Or Hong Kong at +19%. Mexico, up +6% so far this year. This is a very narrow sell-off in the market, aimed primarily at the U.S. for now. Which really makes this correction self-inflicted by their own policy blunders and/or flip-floppery.
Buy the dip?
During any period of market weakness, there is the common unanswerable question — should we buy the dip or is this just the beginning? While the speed of the correction for the S&P 500 is unsettling, this is all noise driven at the moment. Sure the economic data may have softened a smidge, but this weakness appears primarily policy driven. Perhaps MAGA is MAPA (make America poor again). While every period of weakness is unique given the confluence of factors, there are some market tools to help provide some guidance. Below we share our views on this market weakness, what has encouraged us and what has us concerned.
U.S. Centric – This is good news and bad news. The good news is for many portfolios that have a reasonable international, bond and/or alternative allocation, this S&P 500 correction is only having a minor portfolio impact. Those very overweight U.S., and it’s obviously more of an impact. So for those who want to do some U.S. dip buying, there are many parts of the portfolio that are up and can be the source of funds. The bad news is this sell-off may still go global, on which case there is more pain to come.
Sell-off or rotation – One encouraging aspect was that this past week saw selling become more widespread. During the first few weeks of weakness for the S&P 500 it was mainly a sector rotation, selling down tech-related sectors and bidding up defensive sectors. Since those tech sectors carry a much higher weight in the index, this results in a lower S&P 500 (damn you math). The following chart includes the S&P 500 contrasted against the defensive sectors (Health Care, Utilities, Real Estate and Consumer Staples) and the tech sectors (Info Technology, Communication Services and Consumer Discretionary).
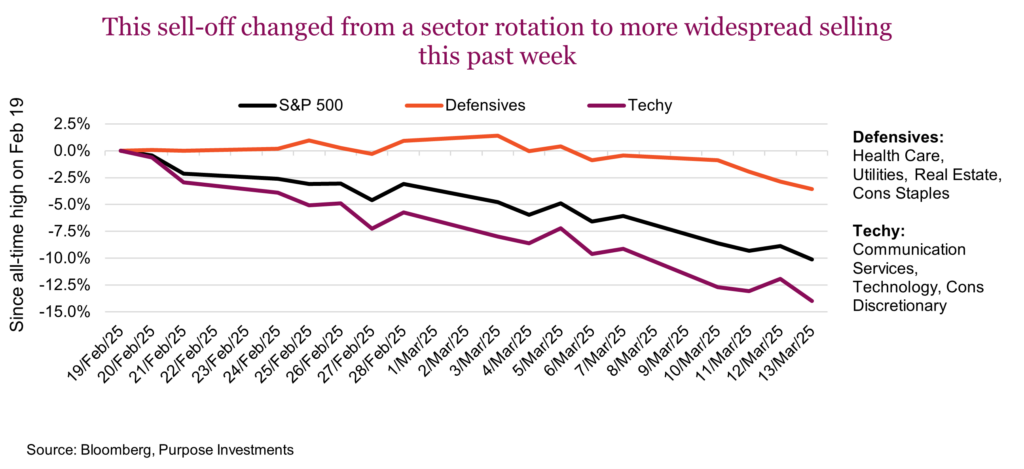
As an FYI – Consumer Discretionary is overly influenced by Tesla and Amazon. Communication Services is more about Google and Meta than traditional telecom companies.
We would point out that over the past week, everyone has been falling together. This may support the idea that the S&P is becoming oversold, something we would not believe if it was simply a continued sector rotation.
Correction watch Indicators – The following are a number of correction indicators that we often update / monitor during periods of market stress. We can safely say many of these correction watch indicators are at somewhat enticing levels for potential ‘buy the dip’ activity.
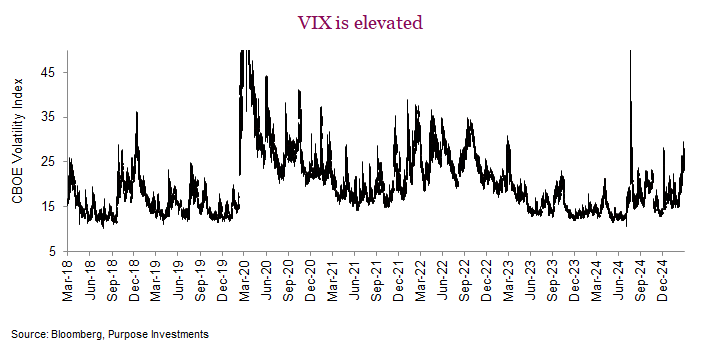
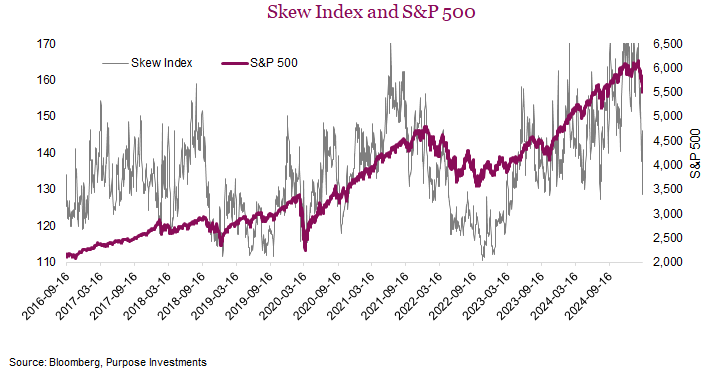
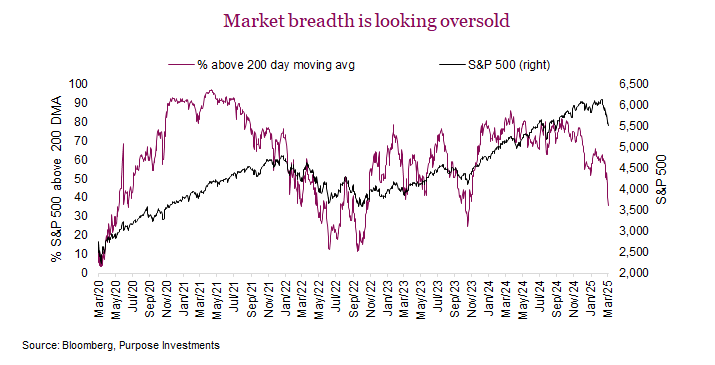
The VIX is somewhat elevated. S&P 500 skew is sufficient to be a buy signal. Market breadth, as percentage of companies in the S&P 500 below their own 200-day moving average, is attractive.
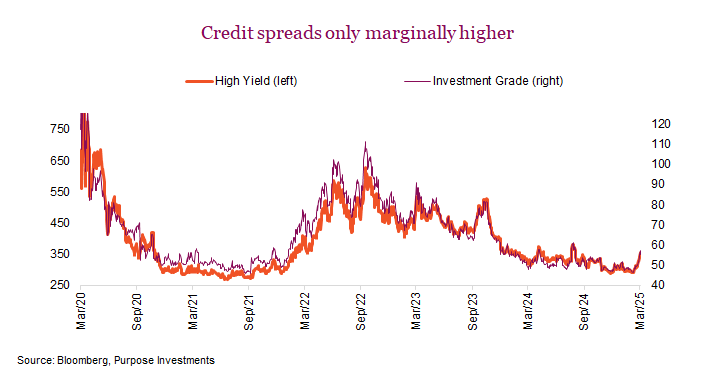
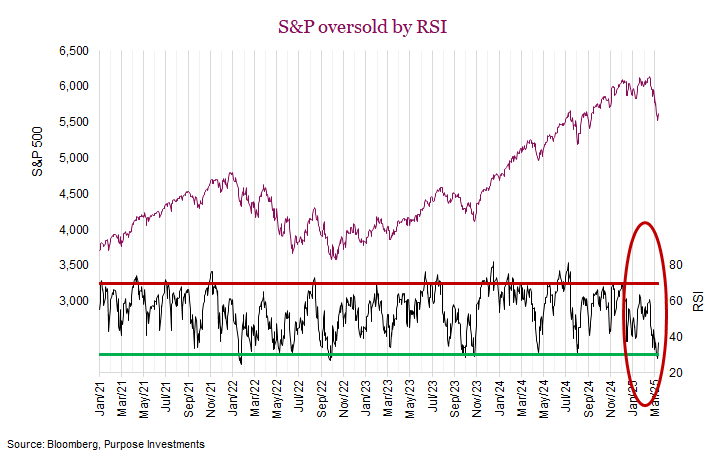
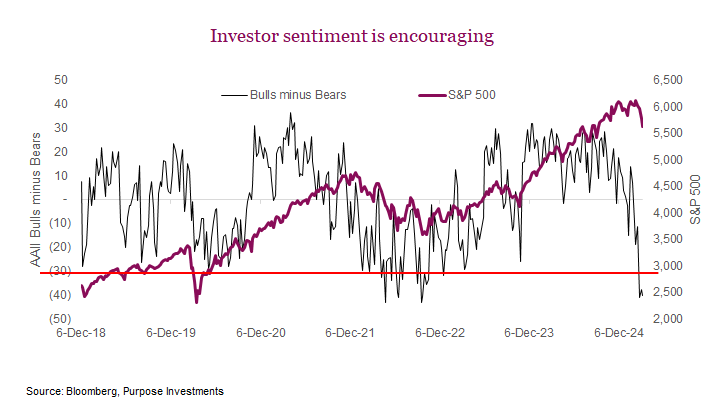
Credit spreads are not showing any stress, it would be better if they had widened more so. RSI touching 30 and very bearish investor sentiment, also encouraging.
Final note
Taken as a whole, these technical indicators are flashing ‘buy-the-dip’, as we appear poised for a bounce of some sort. That being said, the S&P is up +2.7% from the close on Thursday, which certainly tempers this view somewhat. We could get a tweet or announcement at any time that assuages market worries, or further fans the flames of uncertainty. Is S&P 5,600 the price point that makes the level of uncertainty acceptable? Maybe for some or some portion of capital, unlikely for most. Especially if there is another shoe to drop …
This correction has occurred with economic data remaining relatively fine, along with earnings. Perhaps the bigger risk is the tariffs, or the uncertainty thrust upon corporations with so many unknowns, or the layoffs under DOGE, that will all begin to show up in the economic data and earnings further down the road of 2025. If that is on the docket, this correction may just be the pregame show.