Market Ethos
15 June 2026
A tale of three markets
Sign up here to receive the Market Ethos by email.
What is top of mind these days? In this Ethos we will tackle three of the most recurring topics of late.
1) As a number of trillion-dollar companies are tapping the markets via IPOs, what does this mean for markets and indices? 2) Why didn’t oil go higher during the closure of the Strait of Hormuz and what could be next? And 3) Gold fell -25%, from $5,400 to $4,100/oz, since the outbreak of hostilities. Why? Here is our take.
Mega IPOs tapping the markets, SpaceX, and the IPO bonanza
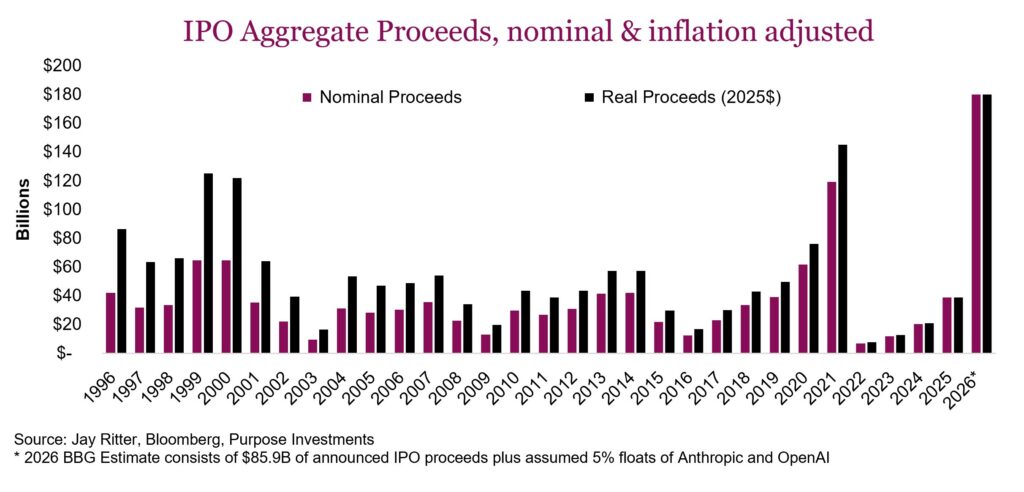
The hype surrounding the SpaceX IPO, with others to follow in Anthropic and OpenAI, is ushering in a new era. The anticipated IPO numbers this year are substantial. Bloomberg estimates around $180 billion, and that doesn’t even include the surge in secondary issuance we’ve seen, like Google’s $80 billion raise. Even adjusted for inflation over the past few decades, 2026 sits in a league of its own, as the charts below show, usurping the 2021 highs as well as the lofty amounts raised during the IPO era of the late 90s and 2000.
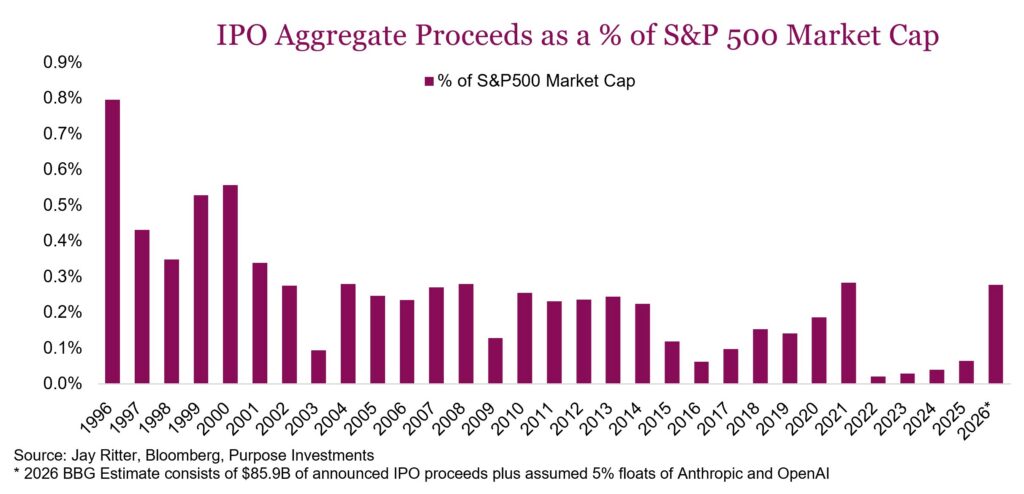
One aspect that isn’t getting enough attention, (and why would it since it dampens the hype around the big event), is putting the size of this year’s anticipated IPOs into context against the market cap of the rest of the market. With 12 trillion-dollar companies now in the S&P 500, the index’s total market cap is just under $65 trillion. That number is so staggeringly large it makes the anticipated $180 billion of 2026 IPO proceeds look somewhat unexceptional. As a percentage of S&P 500 market cap it would be 0.28%, matching the 2021 high, which was itself the highest since 2008 (the Visa IPO), but well below the highs seen during the dot-com craze. So, the “IPO surge” framing hitting the headlines is largely a market-size and inflation illusion. From this perspective, the dot-com era remains the king of IPOs.
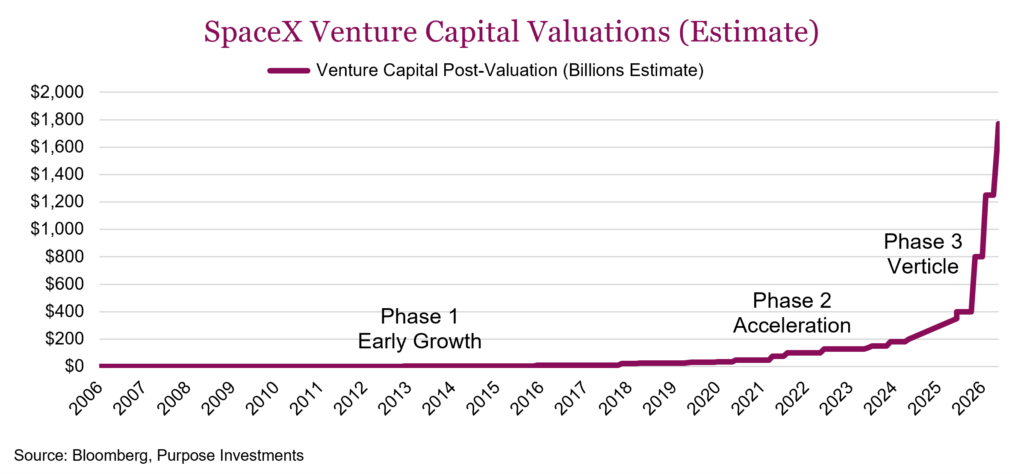
Valuation reaching for the stars – The SpaceX IPO priced at $135 a share, raising ~$75 billion at a ~$1.8 trillion valuation, and given shares are up +27% at time of writing — you do the math. It’s the largest IPO ever (roughly triple the prior record) and instantly became the world’s seventh-largest publicly traded company. This price is a massive bet on milestones and future promises, not cash flows. Even Goldman, who is leading the deal, noted that AI revenue must grow 100-fold to $322 billion by 2030 to justify the valuation. The chart below shows SpaceX’s private valuation history since inception. It has three distinct phases: early growth (~2006-2015), acceleration (~2015-2022), and the vertical (~2022-2026). When it merged with xAI in February it was valued at $1.25 trillion, and since then the price has only gotten richer, a 91% CAGR from 2022 to present.
Elon Musk is no stranger to fantastical targets, and his track record with Tesla has created somewhat of a cult following. The company was built to reach for the stars, and that’s exactly where these sky-high valuations are pointing. From our point of view, the current valuation is so extreme that you’re basically buying Starship at scale and orbital data centers at full price today, which leaves very little room for error.
Investor implications – Whether you’ll own SpaceX isn’t necessarily your choice. It comes down to which index exposure you hold, and the two big providers split the decision. If your U.S. equity exposure is an S&P 500 fund, you’ll own none of it for some time, as S&P refused to bend its rules: SpaceX can’t join the S&P 500 until June 2027 at the earliest, and only if profitable. The majority of retail investors will be sitting this out by default. But growthier portfolios almost always carry a Nasdaq carve-out, and these funds will get force-fed the stock. Nasdaq scrapped its 10% float minimum and adopted “modified market cap” weighting, handing SpaceX a ~$225 billion Nasdaq 100 weight despite the company selling less than 5% of its equity — an unusually small free float despite the huge dollar value. That weighting will drive around $3 billion of Nasdaq-related buying within 15 days of launch, just part of the roughly $16 billion in total passive demand across major indices ex-S&P. The number could grow from the first trading day, with nearly a dozen ETFs from various U.S. issuers set to launch leveraged single-stock exposure to the name.
The forced buying on a relatively small float will surely impact prices. There could be a rush from the onset to get ahead of it, at least that’s what those jumping in from the start are hoping for. The small float, though, cuts both ways. The guaranteed buying is finite, and when lock-ups expire and insiders sell, passive demand may not be enough to support the stock. Broadly speaking, index ETF buying is concentrated in June and July. In August the insider lock-ups start to come off through the rest of the year.
Governance is also a bit of a red flag. Musk will hold around 80% of the vote and can’t be removed, and shareholders waive the right to sue, with disputes going to arbitration in Texas. Before participating in any IPO, especially one this volatile and widely followed, it’s important for investors to inform themselves about exactly what they’re buying and how much they’re really paying for the underlying assets and future cash flows.
But oversubscription in no way guarantees the stock will perform after the initial demand surge once it begins trading. Retail investors, especially those always wanting to chase the hottest narrative, are likely chomping at the bit to participate. They are often derided by professionals as “price-insensitive buyers,” and that speculative demand is exactly what makes the setup exciting and fragile. No one can know where the stock will trade in the near term, but the sheer anticipation of the IPO was already being blamed for selloffs in everything from tech stocks to gold and crypto. Could it pull those assets down further? Sure. It’s plausible this IPO, and those soon to follow, will be a liquidity-drain event in the near term, but to blame it all on them is a stretch. Anything could happen. And if something scary does, an escalation in Iran or a big tech slump, that speculative demand disappears in a flash.
Oil’s baffling journey
Just our luck that as we start putting pen to paper to share our thoughts on oil the headlines are abuzz that a deal has been reached. Potential solution coming; then again, we have heard this so many times over the past few months. Let’s start with why the oil hasn’t gone higher during this Strait blockage, then get into where next.
It would seem most energy experts, those with deeper understanding of how it all flows together, largely expected oil to move materially higher to create demand destruction and alleviate the supply shock. Meanwhile, those not as deep in the energy sector seemed less concerned. This isn’t over but so far, the tourists appear to have the edge on the pros.
If taken in isolation, this blockage should have sent oil prices to the moon, but the economy often proves much more resilient and flexible than most believe. This blockage was partially offset by other pipelines maxing out capacity in the region, avoiding the strait. Most oil-producing nations globally reacted to the price spike by increasing production. This softened the impact somewhat.
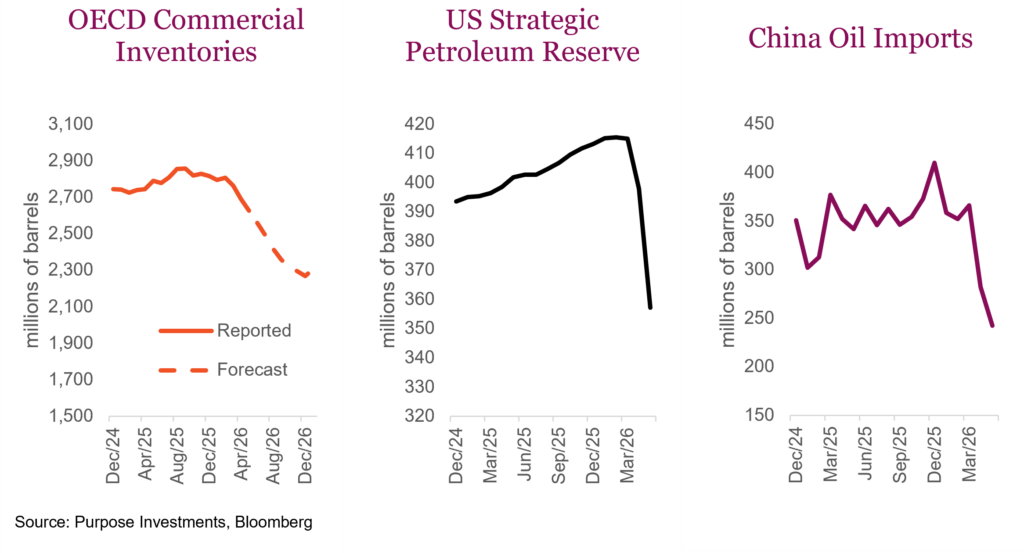
Before this conflict, the global supply/demand dynamic had been in a large surplus for a long time (years). This bloated inventories, which of course have now fallen substantially. There was also active use of strategic reserves, releasing oil into the market. The U.S. SPR (middle pane) dropped a lot. China has a very large strategic reserve, but it’s size and inventory levels are not reported. Safe to say they are tapping it as well, given a larger drop in monthly oil imports (right pane) than during COVID shutdowns. Meanwhile lots of secondary data points out of China that gas prices are not abnormally higher, people still driving, etc.
These are some of the buffers that kept oil from moving up too far. Of course, their effectiveness is being depleted, the timing of any tipping point being the big question. There is also a delay in flow even if the Strait of Hormuz opened this weekend. Muting the oil price move also comes from the demand side, as the global economy is not as sensitive to oil as it used to be. And there has been some demand destruction, mainly in countries with less wealth.
So, if this is resolved soon, maybe some continued disruptions as the system gets back towards normal but that might be it. Or if it persists much longer, the risk is we see shortages start to become more material. We have remained in the camp that a solution would be found, not necessarily to solve the dispute but to solve the flow of goods through the Strait. Still our view, but it certainly has taken longer than we expected.
Longer term, things get a bit more constructive. Hormuz as a leverage point will be greatly diminished in the coming couple of years. The number and speed of pipelines being built across the desert to avoid the Strait of Hormuz will put Canadian pipeline construction pace to shame. It will ensure the Strait of Hormuz is not as big a supply choke point in the future. That will improve supply resiliency. On the negative side, drone technology has advanced to a point that interfering with shipping channels has become much less costly.
There is likely increased oil demand out there as more countries consider holding larger inventories in the future. The world is becoming a bit more volatile, demand for more diversified supply chains is rising and holding higher inventories. This is becoming the norm for many commodities and inputs, beyond oil.
The path forward is rather binary. If this latest chatter on a deal is true, and holds, lower. If not, as the buffers deplete further, the risk of a material spike rises. At the moment, the first scenario appears to be what the market is expecting.
Gold losing its lustre
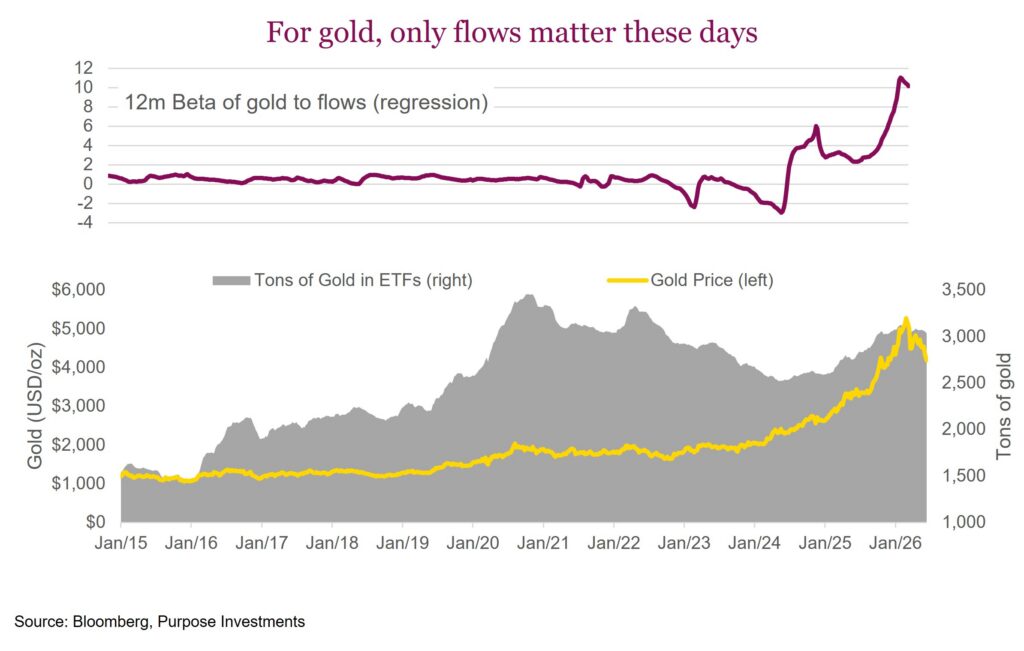
As we have said for years, “if you invest in gold, you must be prepared to be frustrated 80% of the time, not knowing why it is behaving the way it is”. This is literally why it is a good diversifier. 2026, and 2025 are no exception. Gold went up 65% in 2025, inflation didn’t accelerate, there was no big crisis of confidence, no justification from real yields or the US dollar. Even the gold bugs were having trouble justifying the move.
The upward trajectory continued, or even accelerated, earlier this year, before reversing course as hostilities broke out between the U.S. and Iran. It went down on the outbreak of war, and it kept going down as hostilities de-escalated. Gold living up to its unpredictability.
We own gold, so keep that in mind. Gold is flat this year, with equity markets up 10%. That actually seems reasonable. And the underperformance in gold may be re-installing its defensive characteristics. The 2025 rally, which was awesome, probably somewhat unjustified. And as we noted months ago, gold started trading almost entirely on flows. We have a kind of fun multi-regression model that incorporates the U.S. dollar, real yields, inflation break evens, volatility, money supply and flows. Recently, flows have been the only factor moving gold.
The good news as gold has come back down, the other factors appear to be starting to have a bigger influence. Don’t want to jinx it. This does have us starting to become a bit more constructive on the yellow metal.