
Sign up here to receive the Market Ethos by email.
June 2023.
Investor Strategy.
Executive summary
- Not everything bloomed in May
- Two tales of the same market
- Recession/no recession cross-currents
- Market message
- Market cycle
- Portfolio positioning
- The final word
The market advance certainly supports the bulls, as does continued strong employment and recovery signs in housing. On the other side are the bears, highlighting the narrow breadth and weakness in many forward-looking economic signs pointing to recession risk. This is normal. Often during economic turning points, the cross currents in data reach very high levels.
Not everything bloomed in May
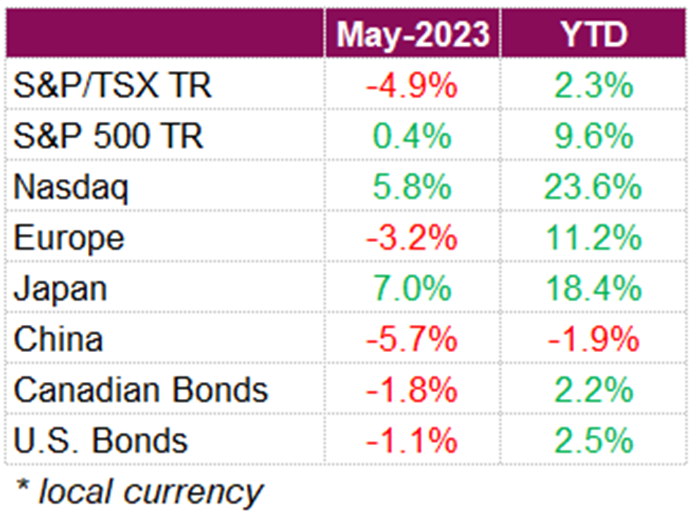
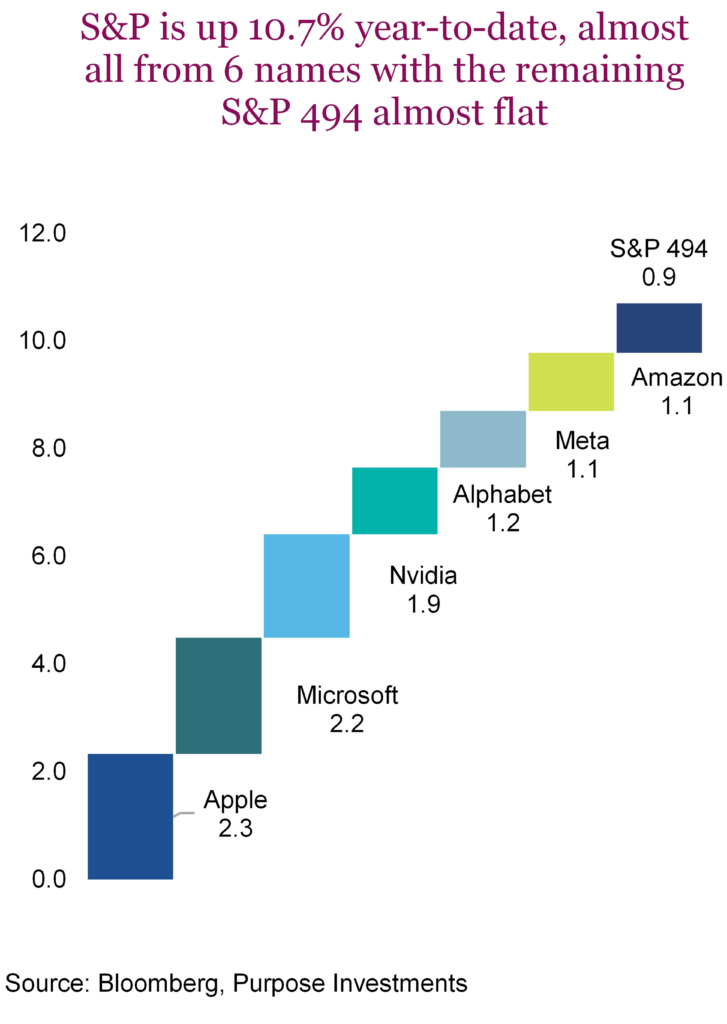
Despite a lot of concerns over the month, the S&P 500 finished the month relatively flat, up just 0.4% while the S&P/TSX was down -4.9%, led by declines in materials and energy sectors which were down -10.7% and -8.4%, respectively. Bond markets also suffered, with the Canadian Aggregate Bond Index falling -1.8% and the U.S. Aggregate Bond Index declining -1.1% for the month. The tech-heavy Nasdaq was able to continue its run and ended May with a 5.9% gain, led by top holdings Nvidia, Microsoft, and Amazon. Year-to-date, the Nasdaq composite is up over 24% on a total return basis, with the top five positions (Apple, Microsoft, Nvidia, Amazon, and Meta) contributing a staggering ~16% to returns. Outside of tech and communication services, gains have been hard to come by year-to-date as we’ve seen a very short list of names contributing to the majority of the outperformance in the U.S. More on this later in the report.
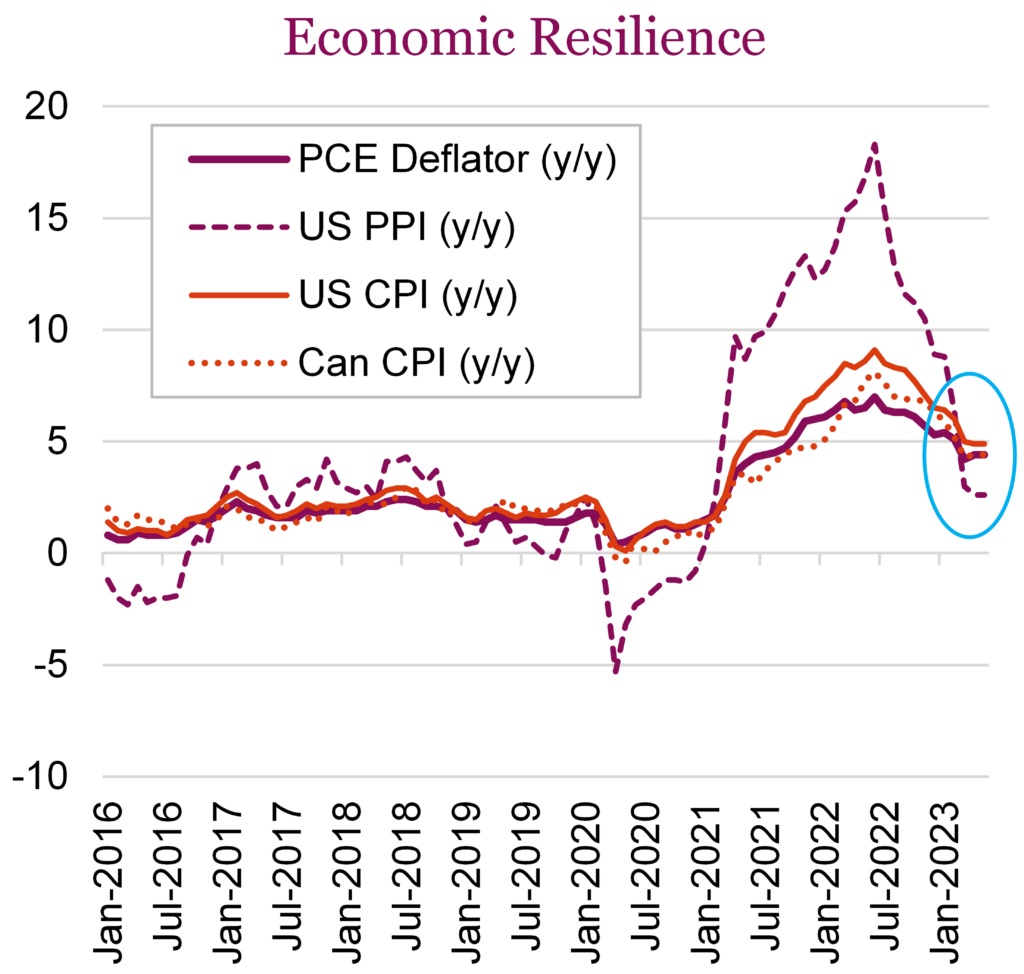
On the economics front, Statistics Canada reported in May that Canada’s economy grew at an annualized rate of 3.1% in Q1, well beyond the 2.5% economists had estimated. The economic growth suggests that Canada’s economy has been more resilient than many (including the BoC) expected, which will surely play into the central bank’s next policy decision. Adding to the argument that the BoC will need to continue to remain hawkish, was data which showed inflation unexpectedly reaccelerating in April. CPI rose 4.4% in April from a year ago, marking the first acceleration in headline inflation since June 2022. Despite headline numbers coming in higher than expected, key gauges of underlying price pressures continued to ease, with trim and median core rates continuing their downward trend in April, averaging 4.2% from a downwardly revised 4.45% a month earlier, while service inflation dropped to 4.8% from 5.1% a month earlier. For now, markets anticipate the BoC will keep rates steady at its next meeting but probabilities of a hike in coming months have started to rise with the release of resilient economic data.
Resilience continued in the U.S. as well, with data showing job creation, wage growth, and consumer spending all remaining strong over the month. The latest PPI report showed U.S. business activity surprisingly increasing in May, while the Fed’s preferred inflation gauge, the personal consumption expenditures price index, rose at a faster-than-expected 0.4% in April. The positive news was that CPI in the U.S. came in as expected. Although inflation rose in April, the pace of the annual increase provided some hope that the cost of living will head lower later this year. CPI increased 0.4% for the month, which equated to an annual increase of 4.9%, slightly less than the 5% estimate and the lowest annual pace since April 2021. So, while job growth rema ins a thorn in the side of the Fed, there are some signals that inflation is moderating, helping firm bets that the Fed will pause their hiking campaign at their next meeting.
Investors were forced to shift their concerns away from inflation in May and towards the U.S. debt ceiling negotiations, with the threat staying top of mind for investors. In the 11th hour, it appeared that a deal would be reached (and default avoided), which offered some relief to markets. With the threat of the U.S. government defaulting on its debt gone, investors went back to their regular scheduled programming of weighing economic data and trying to determine what the next central bank moves will be. The direction has become somewhat blurred again with the recent bout of stronger-than-expected economic data coming out of Canada and the U.S.
Two tales of the same market
Global equities, as measured by the Bloomberg World Equity Index, are up 9% so far in 2023. So, is it safe to give the all-clear with a soft landing and markets go higher? The market advance certainly supports the bulls, as does continued strong employment and recovery signs in housing. On the other side are the bears, highlighting the narrow breadth and weakness in many forward-looking economic signs pointing to recession risk. This is normal. Often during economic turning points, the cross currents in data reach very high levels. Confounding this is lingering inflation, which boosts topline sales growth and can mask the signs of deteriorating business activity.
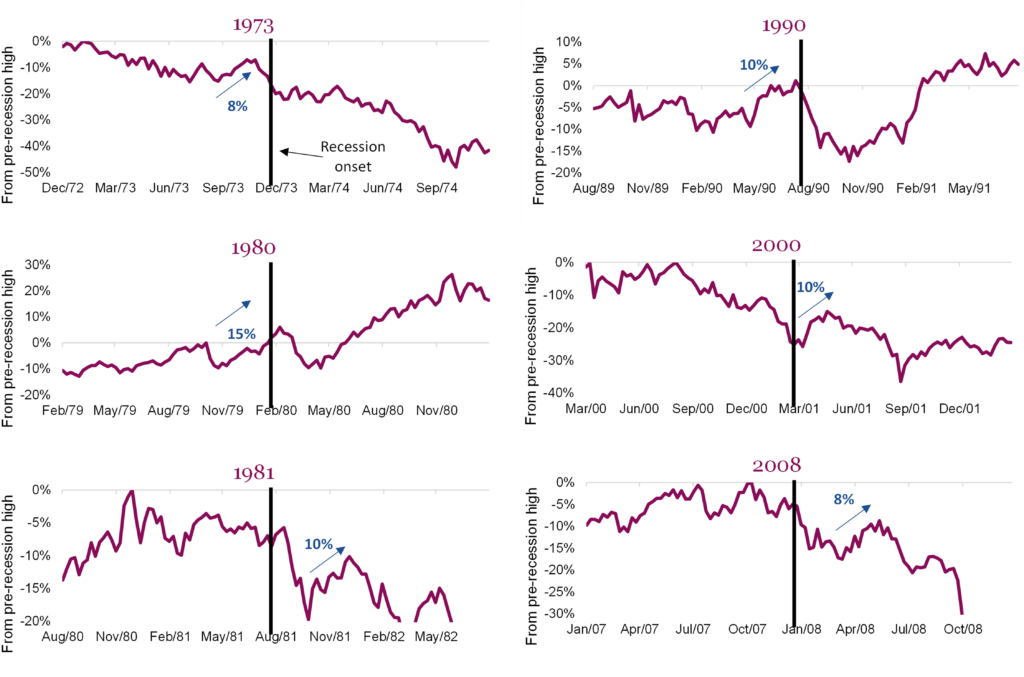
In fact, it is also common to see material equity market advances in and around economic turning points. The following chart montage measures the S&P 500 one year before and after recession onset. The percentage is measured from the pre-recession high. It is common to see decent market advances before a recession hits and sometimes even rallies after it starts, before things typically get worse. Of course, knowing when a recession has started is also something that only becomes clear many months or quarters after the fact. Kind of hard to tell in real-time.
Now if you believe the current environment is some sort of cross between 1973 (inflation+nifty 50) and 2000 (tech bubble), those years should be focused on a little more. We would point out that a +10% rally for the S&P 500 in the second quarter of 2001 was led by a +38% advance in the Information Technology sector. That did not end well. Sound familiar? The S&P 500 Information Technology sector is up +35% year-to-date in 2023, with the S&P +10%.
The crux of this is not to get too excited or complacent just because we have enjoyed a good rise in stock prices so far in 2023. But the real question remains – is a recession coming soon?
Recession/no recession cross-currents
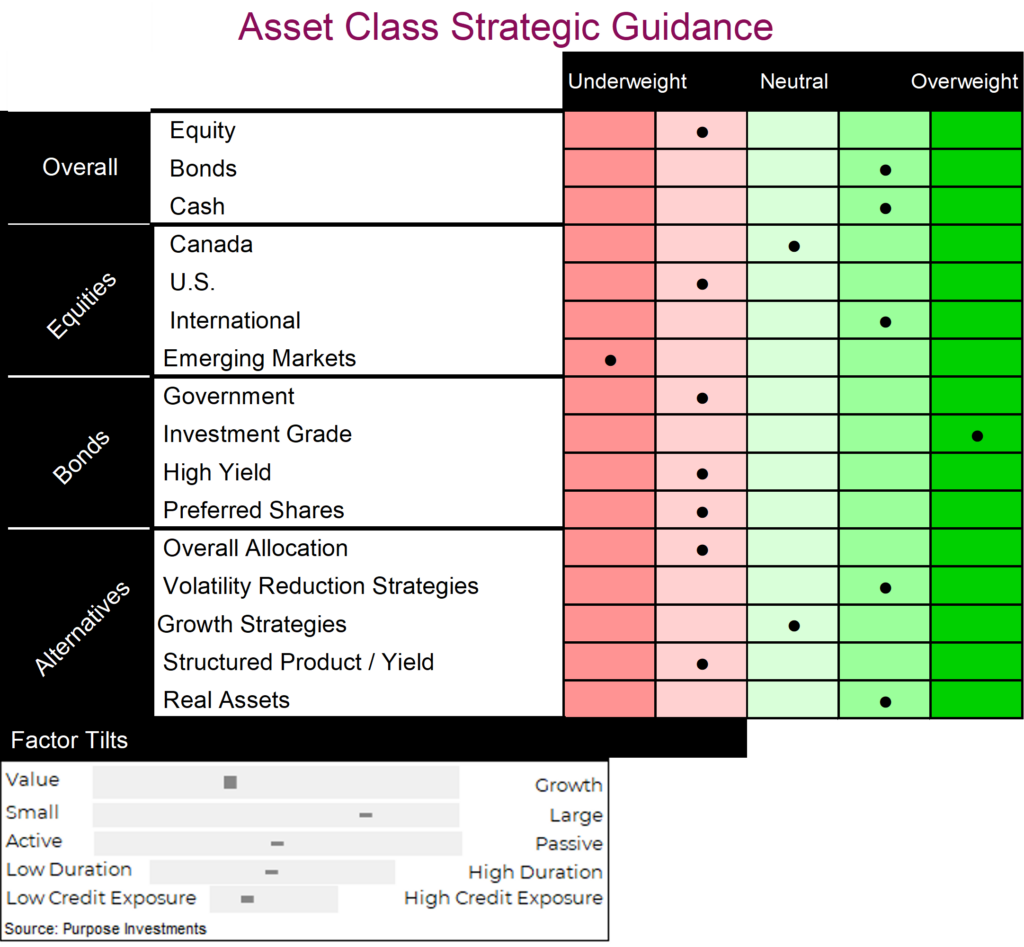
As our readers hopefully know, we are in the higher recession probability camp. Hence our moderate underweight in equities with moderate overweights in bonds and cash [see portfolio positioning below]. We are back to a neutral duration on bonds and less credit. Not super defensive, but it’s certainly tilted that way. Our multi-asset balanced model is +3.7% year-to-date and is defensive with some up-market capture. Ideally, we plan to become even more defensive as/if recession evidence builds. Which, of course, raises the most important question – what if we are wrong?
With names such as ‘pre-mortem’ or ‘bull vs bear case,’ the objective is clear: actively engage and try to see the other side’s opinion. With our defensive tilt, we believe a recession is a higher probability than no recession. Here is an attempt to convey both sides:
| Recession risk | No recession anytime soon |
|---|---|
| Rate hikes – The track record of central banks managing a soft landing is poor: given the number of hikes globally, even less likely. It takes 9+ months for rate hikes to fully impact the economy, which means pain is mostly on the horizon. And don’t forget about quantitative tightening. Leading indicators – Along with manufacturing surveys, recession probability models, or the yield curve inversion these factors all point to a likely recession in the near term. Buffers depleting – Savings during the pandemic are dwindling fast, given inflation and higher interest costs. Even with a decent labour market, this could start to change consumer behaviour. Labour – IT IS A LAGGING INDICATORS; don’t take solace in the fact that it is holding in. Temp employment is falling, often a leading indicator of total payrolls. Commodities – Dr. Copper and its other commodity friends are certainly signalling weaker demand ahead. Even with the tight supply of many commodities, prices have been declining. Inflation migration – Inflation was very positive for corporate earnings, boosting the top line while companies managed to slow cost inflation. Costs appear to be catching up now, and this is hitting margins. Earnings – We are starting to see negative earnings growth; if the economy slows and/or costs keep rising, this will get worse. Wages are up, interest expense is up, and the cost to do anything is up. Valuations – Global equities are trading 15.6x, roughly in line with longer-term averages. This means valuations are not pricing in much bad news or even higher yields available in cash/bonds. | Just normalizing, not recession – Manufacturing ran beyond full speed to catch up with shortages/bottlenecks from the pandemic. Coming off this high was always going to ‘look’ like a recession. Labour – Strong employment gains continue and remain broad-based; it’s hard to see an imminent recession. Consumer strength – Credit card spending remains strong, delinquencies low. The U.S. and European consumers have very strong balance sheets, sturdy enough to weather higher inflation and rates. Housing – Rising rates in 2022 caused a slowdown in housing, but since rates have generally stabilized, a rebound of activity is on. The U.S. economy rarely moves in the opposite direction to housing. Hard versus soft data – Much of the weak economic data is survey or other ‘soft’ data. The hard data remains much more upbeat. Better to believe in what people do (hard data) than what they say (soft data). Valuations – The TSX is 12.8x, Europe around the same, which means it’s the U.S. at 18.5x, which is making things look expensive. But the S&P is skewed by a few names, and so is its valuation; 26% of the index is trading below 12.5x, up a lot from only 18% a year and a half ago. China & Europe – China reopening and Europe avoiding an energy crisis have really set the stage for better growth on the global front. Bearishness – Investors are bearish, portfolio managers are bearish, and speculators are bearish. The market often proves the maximum number of people wrong. |
Hopefully, this highlights some of the cross-currents the market and investors are currently battling. It is no ‘slam dunk’ in either direction. That being said, we believe the left column carries more weight or a higher probability. Also worth considering is not just which side has the greater likelihood of being correct but the magnitude of the impact. If the bulls are right, given S&P 4,200 and TSX 20k, the upside may be limited. If the bears are right, but clearly early, the downside impact may be larger.
For now, we will keep our foot off the gas and hover over the brake.
Market message
Since the beginning of the year, we’ve increasingly become incrementally more defensive in our positioning. Perhaps our framework is wrong. After all, the S&P 500 is up 10% so far this year and is up 17% off of the lows from last October. International markets have performed even better, with the MSCI EAFE Index up over 25% off the lows last year. Thankfully we have been overweight international. Canada has lagged, but this, too, corresponds with the theme that last year’s worst markets are this year’s best-performing. Tech certainly fits into this theme, with the NASDAQ up a stunning 25% YTD. It’s worth noting that the NASDAQ is still 18% below its all-time high, and the S&P 500 is 12% below its high-water mark.
Is this a bear market rally or the beginning of a new bull? Unfortunately, it’s impossible to give a concrete answer without the benefit of a rearview mirror. The broad market narrative is signalling this could be the beginning of the next bull, with the S&P above all major moving averages. We don’t believe it’s a coincidence that the rally has stagnated right at the 50% retracement from last year’s fall. We saw similar bounces to exactly the 50% retracement level in both 2001 and 2008.
The four horsemen (actually six)
This is one of the thinnest rallies that we’ve really ever seen. In the late 1990’s tech bull, the “four horsemen of the apocalypse” were repurposed as the four horsemen of the Internet – EMC, Cisco, Oracle and Sun Microsystems. At times during that bull, these names represented most of the market’s advance. They were changing the world and how we communicate. Not owning them meant you lagged the market cap-weighted index. Sadly, Oracle is the only one of the four to ever exceed its 2000 peak, a feat achieved fourteen years later in 2014. Once again, we have a market that is ridiculously narrow. The S&P 500 is up 10% this year, with six companies representing almost all of the gains!! Are these the six horsemen of AI?
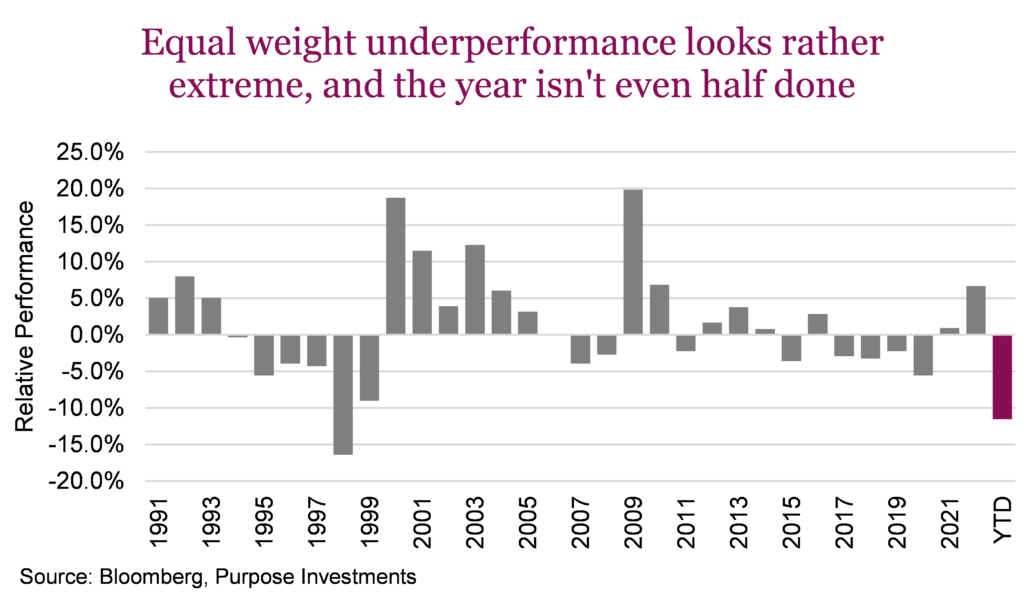
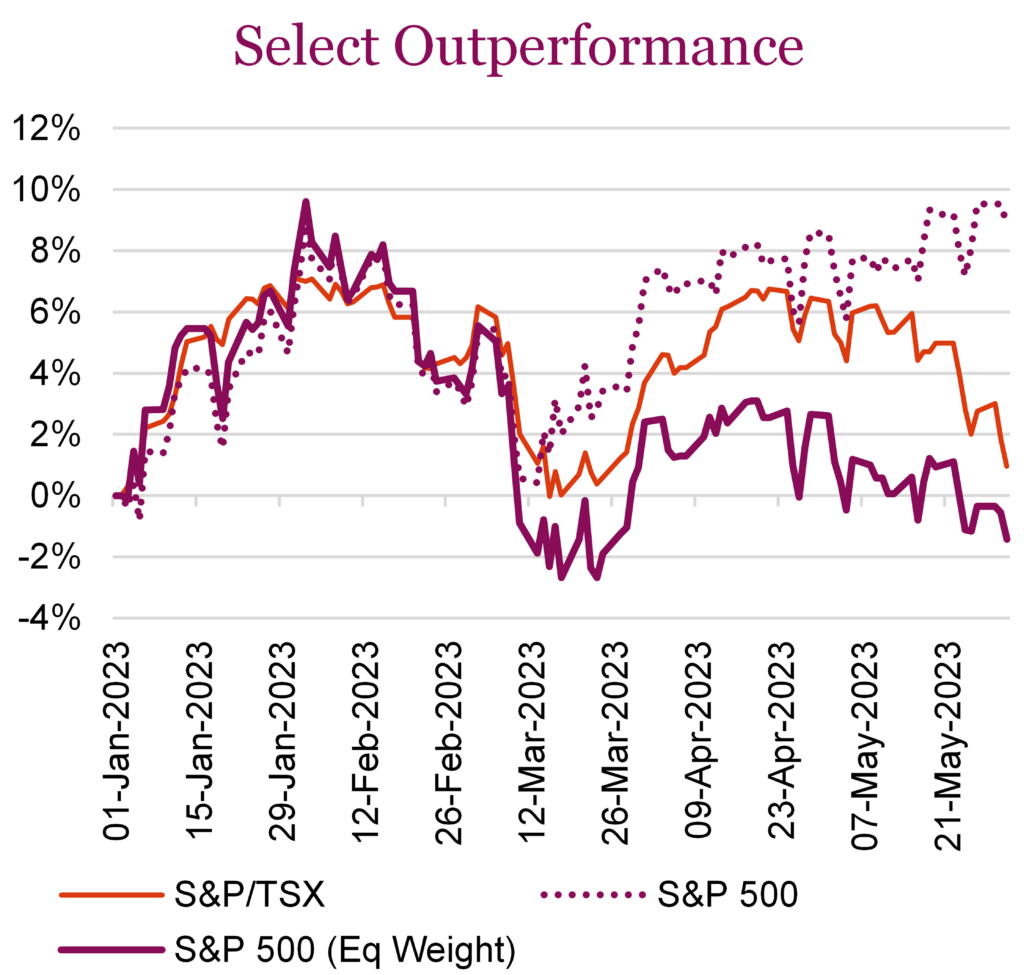
Digging further into market breadth, or lack thereof, we will highlight the performance difference between the S&P 500 equal weight vs market cap. Last year’s outperformance for equal weight has been erased, with the market cap index now just narrowly outperforming since the beginning of 2022. So far this year, equal weight is losing by the widest margin for a calendar year since Bloomberg’s data began in 1990. Returns being driven by the largest companies in an index aren’t unusual, but this does look extreme. Markets are not suggesting broad strength, it’s idiosyncratic, and this is why we don’t believe it’s really giving us an all-clear signal despite briefly breaking out of the 4,200 range.
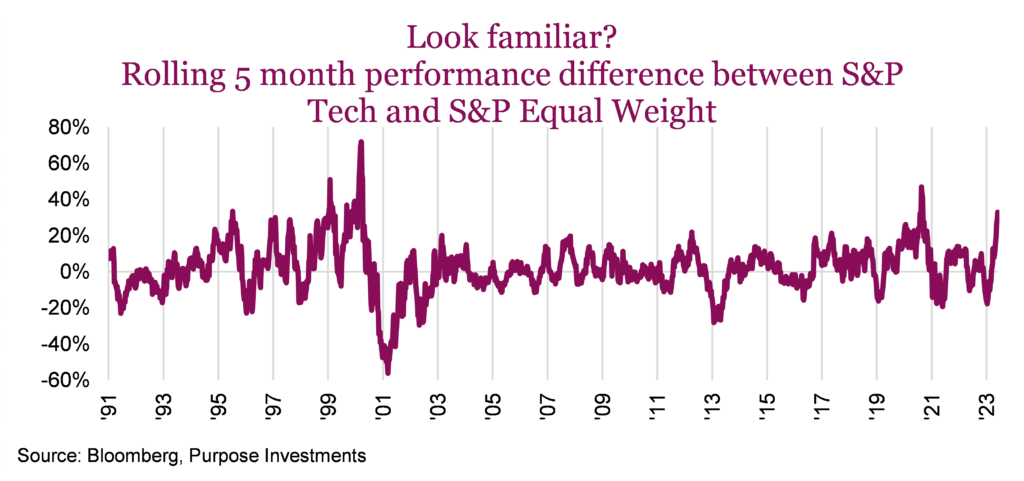
We believe it’s time to fight the momentum trade. Even the world’s largest momentum ETF seems to be late to the party once again. Its semi-annual rebalance will see its tech weight move up from just 3.2% to 20.6%. Energy and Health Care allocations will be slashed, and the Fund will once again be tilted heavily toward tech and other growth sectors, the very exposures that drove tremendous underperformance to the S&P 500 last year. Ignoring the confines of the calendar, we wanted to see just how unprecedented the past five months have been in terms of the historical five-month performance difference between the Technology sector and the equal weight index. The 33.8% difference is massive and historically rare over any 5-month period going back to 1990. The only two similar periods were a brief stint in 2020 and in the late 90s. In both periods, we believe it’s noteworthy that the relative performance then dropped in subsequent months.
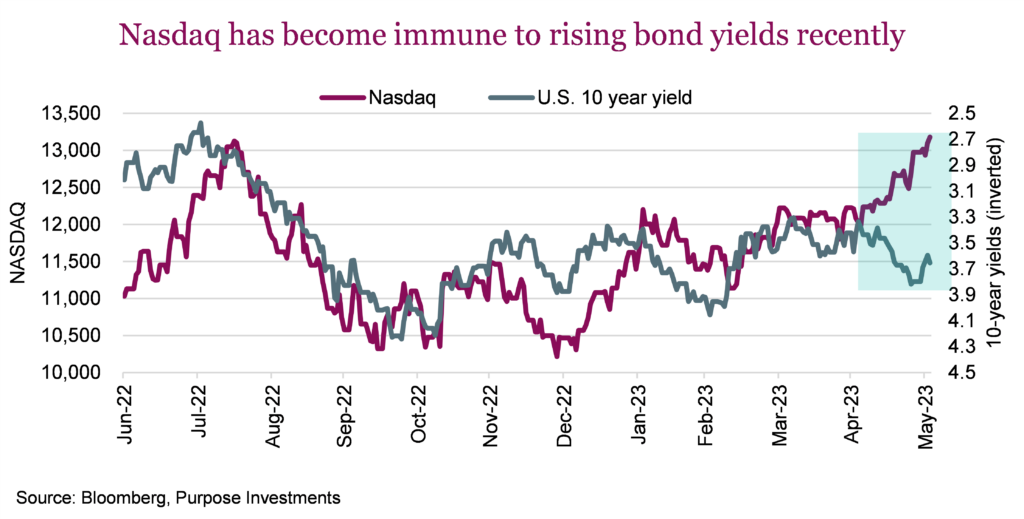
With the debt ceiling nearly behind us, investors can turn their attention more fully to central banks and the potential for further hikes. AI’s prominence in corporate updates has helped defy the gravity of rising rates which typically have an outsized impact on the tech sector and other rate sensitives. This relationship is currently broken, but we would expect that the AI boom is merely a mirage, like a bountiful oasis in the desert. We are not doubting the potential of AI, but we are doubting the near-term impact. It evokes a sense of hope and promise but conceals the underlying challenges facing not only the sector by the market as a whole.
Other concerning relationships
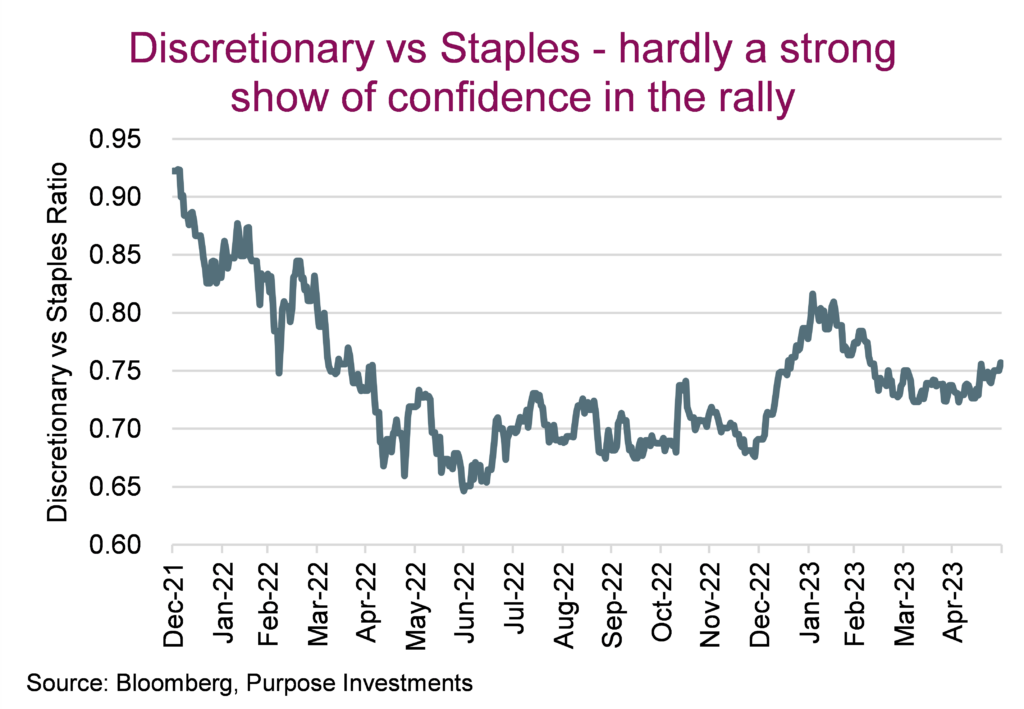
Key sectors such as discretionary stocks, transports, and banks have continued to struggle. These economically sensitive stocks are finding few buyers even at current depressed levels. The relationship between discretionary stocks and consumer staples is a useful indicator to read into risk sentiment within the market. In the chart to the right is the ratio of the equal-weighted sectors against each other to remove the outsized impact of Tesla and Amazon. Though Discretionary stocks have rebounded somewhat relative to Staples, most of this happened in January and has been all but absent the past few months.
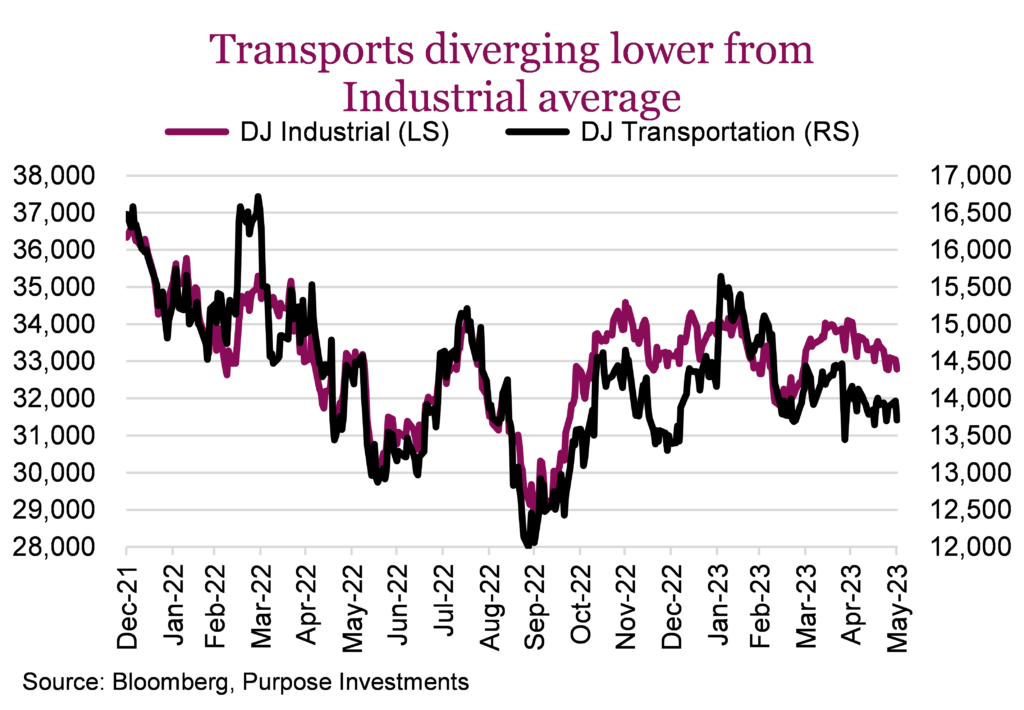
Dow Theory is a classical technical tenant, and it suggests that the movements of the stock market can be analyzed by examining the interaction between the Dow Jones Industrial Average and the Dow Jones Transportation Average. According to the theory, confirmation of a bullish trend occurs when both the DJIA and DJTA move in the same direction. Both were strongly in line in 2022 but had been diverging of late, with Transports recently making new lows for the year.
Looking ahead, we should assume there will be volatility and twists and turns in the months ahead. For now, given the underlying market signals and lack of breadth, we suggest continued defensive positioning in equity markets. The market will start to fully discount potential earnings recession and further economic weakness. We remain underweight sectors that are more cyclically sensitive and would suggest fading the tech advance.
Tech innovations such as the PC, internet and wireless proliferation have changed all our lives over the past few decades. But history shows that markets can get ahead of themselves, and it takes time to see who ultimately wins. This year’s tech blowout is not without precedent; however, these periods of outperformance have historically been followed by relative underperformance. The lack of broad participation shows that investor sentiment and confidence are concentrated in only a select few stocks, making the market more susceptible to volatility and potential downside risks.
Market cycle
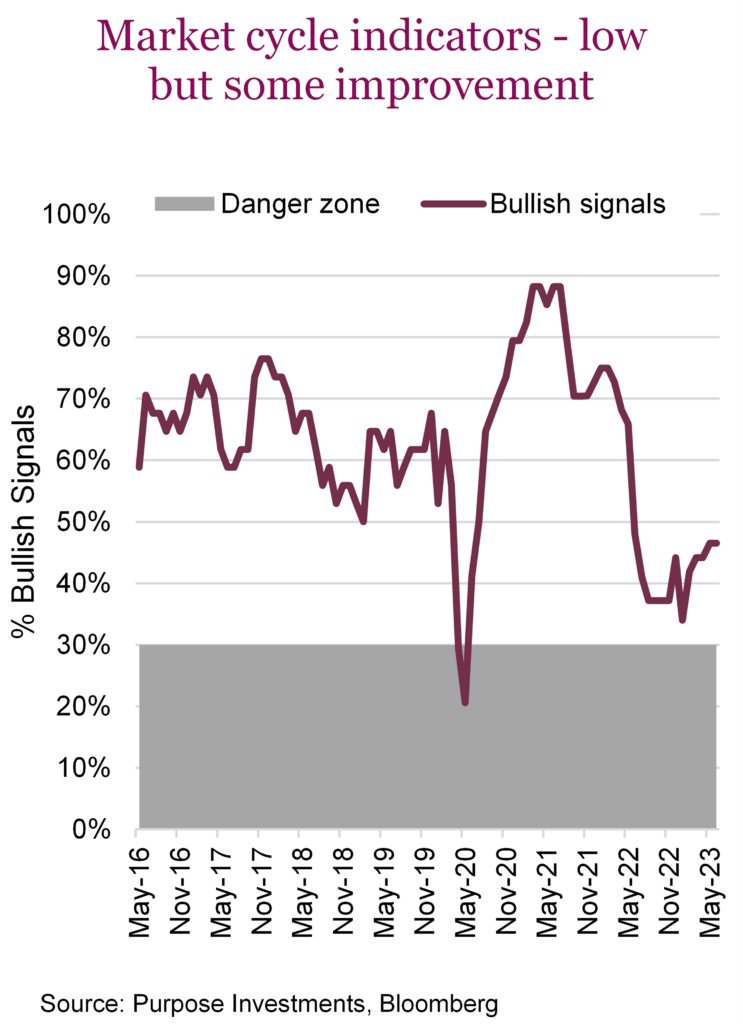
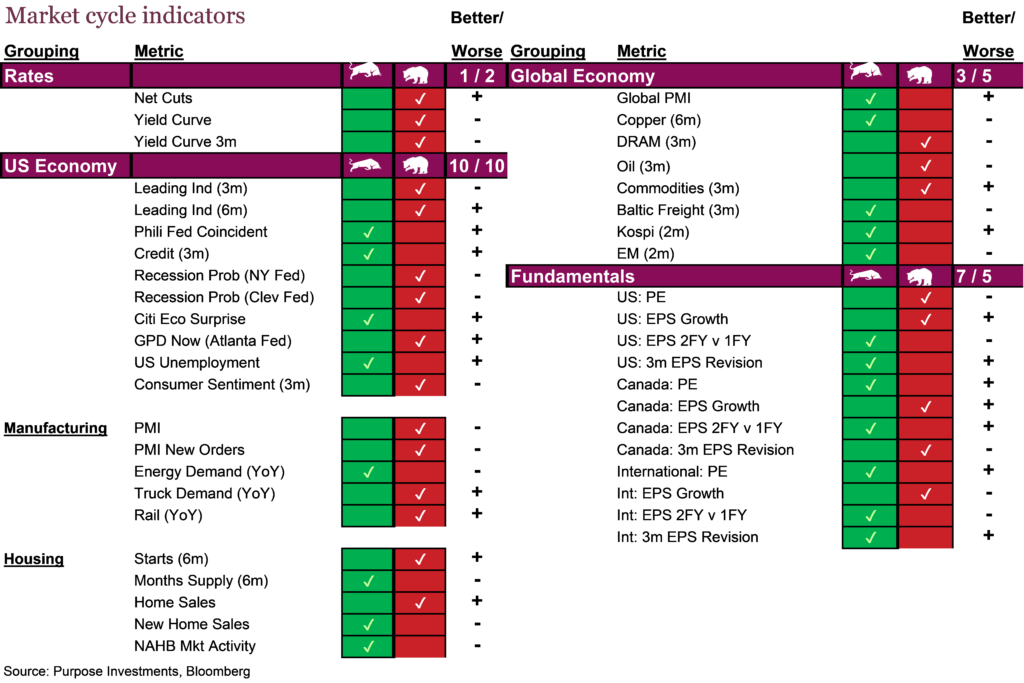
Market cycle indicators remained stable from last month with no changes off the bottoms, thanks to some improving economic data in housing. Manufacturing remains weak while global and fundamentals are mixed. Welcome to continued cross currents in the data, again a regular occurrence around potential turning points.
Portfolio positioning
No changes to our portfolio positioning this past month. We remain with a moderate underweight in equities and a moderate overweight in cash and bonds. Full underweight in emerging markets and moderate overweight in international has worked well of late. The moderate underweight in U.S. equities, not so much.
We continue to find decent value in the more conservative parts of the bond market, given the rise in yields. Again, our fear of duration has fallen as a potential recession is our base case. And among alternatives, we continue to lean on volatility or defense strategies with real assets.
The final word
We don’t know if there will be a recession or how the market may react one way or the other. But we do know there is more evidence of slowing than accelerating. Today, this does not appear to be reflected in equity prices and probably not in bond prices either, given credit spreads. The data will likely remain mixed, offering support to make either a bullish or bearish argument. Given the impact of either scenario and the probabilities in our analysis, we remain defensively tilted.
It's tough to make predictions, especially about the future
Yogi BerraSign up here to receive the Market Ethos by email.
Source: Charts are sourced to Bloomberg L.P., Purpose Investments Inc., and Richardson Wealth unless otherwise noted.
*Authors:
Purpose Investments: Craig Basinger, Chief Market Strategist; Derek Benedet, Portfolio Manager
Richardson Wealth: Andrew Innis, Analyst; Phil Kwon, Head of Portfolio Analytics; Mark Letchumanan, Research; An Nguyen, VP Investment Services
Disclaimers
Richardson Wealth Limited
The opinions expressed in this report are the opinions of the author and readers should not assume they reflect the opinions or recommendations of Richardson Wealth Limited or its affiliates. Assumptions, opinions and estimates constitute the author’s judgment as of the date of this material and are subject to change without notice. We do not warrant the completeness or accuracy of this material, and it should not be relied upon as such. Before acting on any recommendation, you should consider whether it is suitable for your particular circumstances and, if necessary, seek professional advice. Past performance is not indicative of future results. The comments contained herein are general in nature and are not intended to be, nor should be construed to be, legal or tax advice to any particular individual. Accordingly, individuals should consult their own legal or tax advisors for advice with respect to the tax consequences to them.
Richardson Wealth is a trademark of James Richardson & Sons, Limited used under license.
Purpose Investments Inc.
Purpose Investments Inc. is a registered securities entity. Commissions, trailing commissions, management fees and expenses all may be associated with investment funds. Please read the prospectus before investing. If the securities are purchased or sold on a stock exchange, you may pay more or receive less than the current net asset value. Investment funds are not guaranteed, their values change frequently and past performance may not be repeated.
Forward Looking Statements
Forward-looking statements are based on current expectations, estimates, forecasts and projections based on beliefs and assumptions made by author. These statements involve risks and uncertainties and are not guarantees of future performance or results and no assurance can be given that these estimates and expectations will prove to have been correct, and actual outcomes and results may differ materially from what is expressed, implied or projected in such forward-looking statements. Assumptions, opinions and estimates constitute the author’s judgment as of the date of this material and are subject to change without notice. Neither Purpose Investments nor Richardson Wealth warrant the completeness or accuracy of this material, and it should not be relied upon as such. Before acting on any recommendation, you should consider whether it is suitable for your particular circumstances and, if necessary, seek professional advice. Past performance is not indicative of future results. These estimates and expectations involve risks and uncertainties and are not guarantees of future performance or results and no assurance can be given that these estimates and expectations will prove to have been correct, and actual outcomes and results may differ materially from what is expressed, implied or projected in such forward-looking statements. Unless required by applicable law, it is not undertaken, and specifically disclaimed, that there is any intention or obligation to update or revise the forward-looking statements, whether as a result of new information, future events or otherwise.
Before acting on any recommendation, you should consider whether it is suitable for your particular circumstances and, if necessary, seek professional advice.
The particulars contained herein were obtained from sources which we believe are reliable, but are not guaranteed by us and may be incomplete. This is not an official publication or research report of either Richardson Wealth or Purpose Investments, and this is not to be used as a solicitation in any jurisdiction.
This document is not for public distribution, is for informational purposes only, and is not being delivered to you in the context of an offering of any securities, nor is it a recommendation or solicitation to buy, hold or sell any security.
Richardson Wealth Limited, Member Canadian Investor Protection Fund.
Richardson Wealth is a trademark of James Richardson & Sons, Limited used under license.