
Sign up here to receive the Market Ethos by email.
Investor Strategy
November 2023.
Executive summary
- October did not end so scary
- Year-end rally?
- Central banks affects FX: Who yields first?
- Market cycle, positioning, probabilities
- The final word
Markets and the economy are gradually adjusting to higher costs of capital (higher yields/rates) and less abundant capital. The process will take a long time to work its way through, causing both up and down oscillations in the stock and bond markets. This will also likely lead to a recession that may not be as soft as the consensus believes. This does have us still leaning with a moderately defense stance in our multi-asset portfolios, but still with enough exposure to benefit from a potential rally into year-end. If this does transpire, we would anticipate getting a bit more defensive on strength.
October did not end so scary
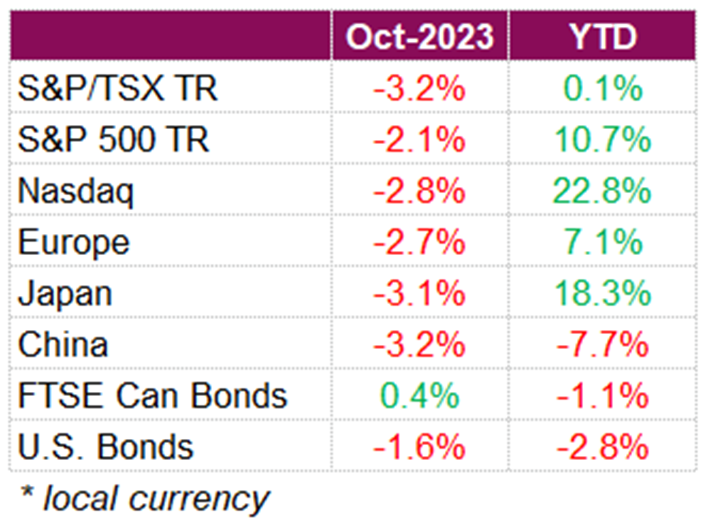
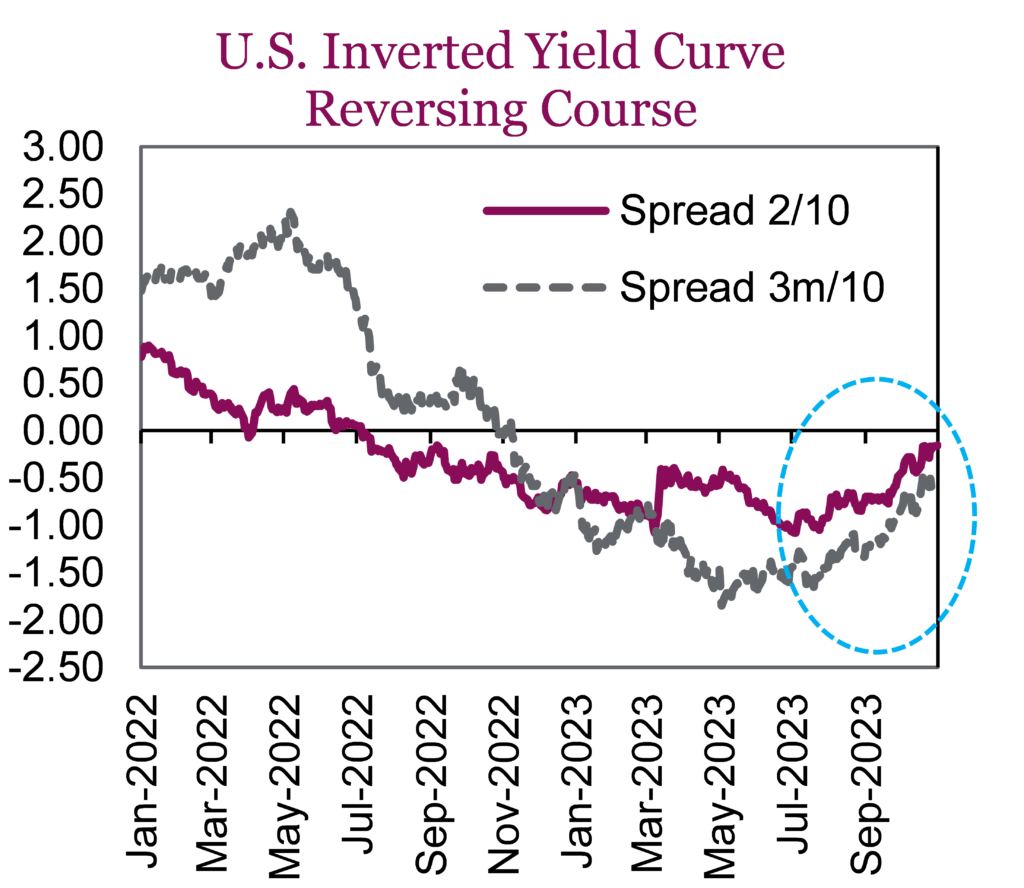
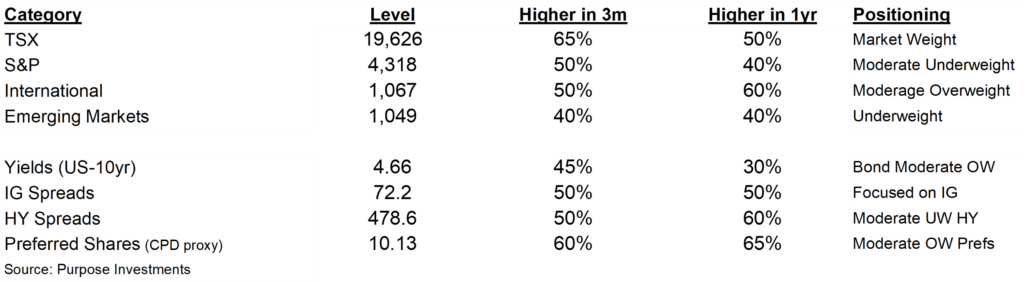
There was certainly a lot for the market to digest in October, including escalating geopolitical tensions, economic data, and a slew of quarterly earnings. When it was all said and done, North American equities continued their downward trend, notching their third straight month of declines. On a total return basis, the TSX finished the month at -3.2%, the S&P 500 -2.1%, the Nasdaq -2.8%, and the Dow -1.3% for October. Investors fled to safe haven assets in the wake of the escalating conflict between Hamas and Israel, pushing gold above $2000 for the first time since May. Yields in the U.S. also continued to climb, with the U.S. benchmark 10-year Treasury note yield breaking above 5% for the first time in 15 years, pushed by expectations the Fed will keep interest rates elevated for longer than expected. Relentless yields in the U.S. pushed bond prices lower, with the U.S. Aggregate bond index falling -1.6% over the month. Bonds in Canada fared much better, with 10-year yields decreasing on softer economic data, leading the FTSE Canada Bond index to rise 0.4% over the month. Of note, with 10-year yields rising and the shorter end anchored, there has been a significant steepening move in the inverted yield curve, particularly in the U.S.
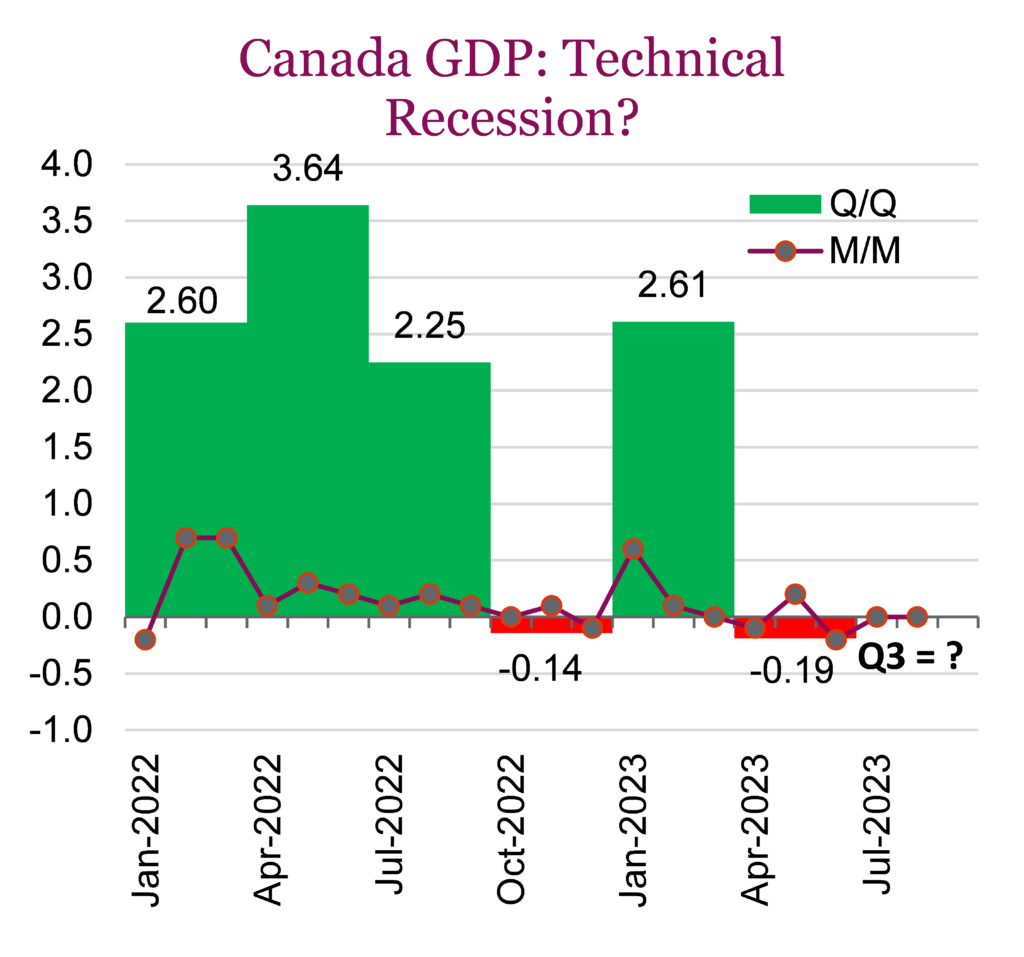
Consistent with market expectations, the Bank of Canada maintained its overnight policy rate at 5.0%, however, the central bank continues to remain cautious and has left the door open for future hikes if necessary. With inflation trending downwards and growth slowing, officials are confident that their tightening plans are working well. Well, maybe too much. The latest GDP reading out of Canada is showing that the economy may have entered a technical recession (two consecutive quarters of negative growth), with a minor contraction estimated in the third quarter, reinforcing the case for an end to interest-rate hikes. Preliminary data out Oct 31 suggest GDP was unchanged in September. The numbers point to a decline in output of 0.1% annualized for the third quarter, following a 0.2% contraction from April to June. Although the data will likely be revised, the projected pace of growth in the last quarter was much slower than the 0.8% forecast by the Bank of Canada earlier this month. The BoC was not the only one to hit pause, the European Central Bank also left interest rates unchanged at 4%, the first pause after 10 consecutive hikes, but like the BoC left the door open for further hikes if necessary.
The U.S. economy continued to buck the trend, growing at an impressive 4.9% annual rate in Q3, the highest level since 2021, as consumers continued to spend, despite rising borrowing costs and elevated inflation. The GDP numbers came along third-quarter earnings season, with more than 80% of the S&P 500 companies now having reported earnings. Of the companies that have reported so far, 80% have reported actual EPS above estimates, above the 5-year average of 77% and above the 10-year average of 74%. Consumer spending in the U.S. remains strong, surging by 4% which has driven economic growth. Still, officials are pointing to declining savings and higher borrowing costs as a sign that growth may begin to slow in the coming months.
Despite poor performance in October, equity markets rallied into the final days of October and continued into early November with data indicating that central banks may be nearing the end of their rate tightening campaigns. Historically, November and December are good months for equities and if yields continue to come down is it possible we could see a year-end rally? Let’s dig into this a little deeper.
Year-end rally?
2022 was certainly a rather painful year for investing. There were more central bank rate hikes than any of us would care to count, yields moved from ultra lows to the highest in a few decades, and markets took it on the chin. Worse yet, everything moved together as both equities and bonds fell. Sadly, that is what happens when rates, or the discount rate, go from near zero to 5%. As usual, the market went too far, and a bottom was put in about a year ago in October, after which a decent rally ensued.
And that’s the way it’s supposed to work, right? If investor memory is limited to the last few years or even the last two decades, any material sell-off is “always” followed by a recovery, which then goes even further to make new highs. That mindset was further cemented in 2020. Sadly, if you have a long memory, you may well realize this is not the norm. We are likely in a ‘repricing of everything’ environment. After more than a decade of too much capital floating around, costing too little (aka low yields), and being used for perhaps non-economical endeavors, the reversal is now on. And the reversal will likely be a long process, longer than a few months or a few quarters. Which we believe ends in a recession.
Fortunately, nothing moves in a straight line, and that is certainly the case for markets. The market rally over the past twelve months that peaked at the end of July was very impressive. This was followed by declines from August through October, a seasonally weak period. The main culprit was rising bond yields, not due to inflation concerns like in 2022, but rather a strong U.S. economy and the very aggressive issuance of U.S. Treasury bonds into a market that has some historically resilient buyers not as enthusiastic.
The good news is the strong issuance is slowing for now as the general account has been largely replenished after being bled dry during the debt ceiling self-induced stress. And economic growth, even for the mighty U.S. economy, is slowing. This has bond yields coming back down, which could very easily set the stage for a pleasant year-end rally, which may have already gotten started.
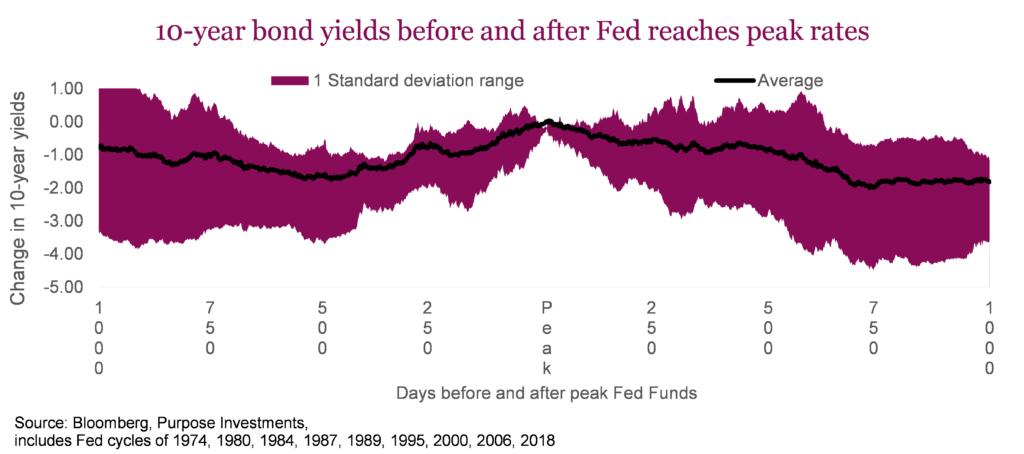
Bonds – We don’t believe the market needed to hear the Fed indicate they are likely done. If more people bothered to look at the recent data – some cracks which are increasingly showing up in the economy and the trajectory of inflation data, all of which the Fed certainly looks at – they ought to be done and may have already gone too far. That is good news for bonds; this chart shows the 10-year yield before and after the Fed stops hiking. The path is predominantly lower; yay, bonds up.
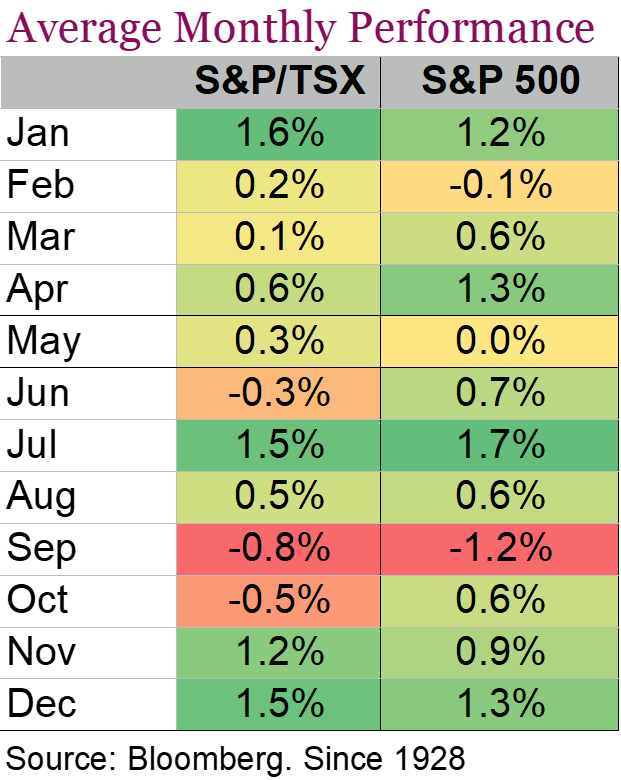
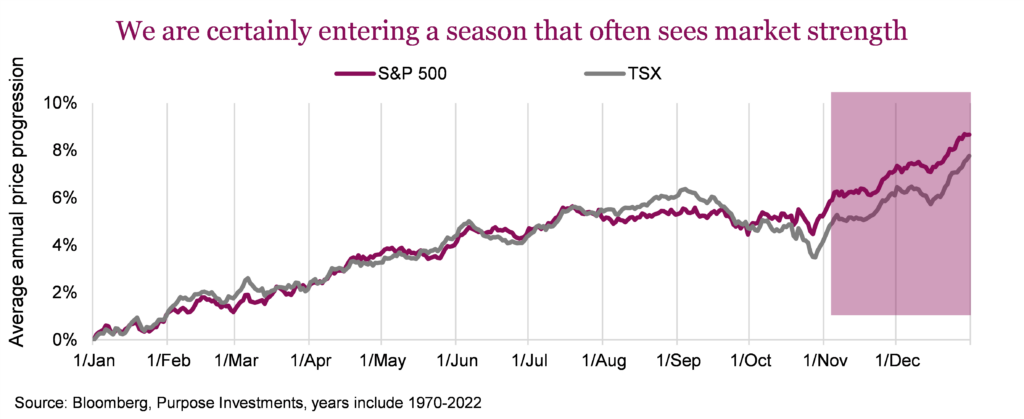
Stocks – We’re not big fans of seasonality, but we certainly are aware of it and the evidence behind it (just see the chart). The fact is, year-end rallies happen more often than not, and those gains can be impactful. Perhaps that has already started as the market, measured by global equities, had fallen 11% from August 1 through the end of October but has not ‘bounced’ 4%. Earnings season is over, company share buy-back blackouts are largely over, sentiment has turned rather negative (AAII is 50% bearish, 24% bullish), markets are oversold (less so after the past week), and one could easily argue the table is set for a year-end rally.
The data doesn’t lie, and the above chart is compelling for both the S&P and TSX. But we would temper this with the knowledge that averages often hide more than they reveal. Yes, over the past 50-some-odd years, the average price gain for the TSX and S&P has been positive and stronger than other periods. However, that range of performance goes from +13% to -10%, and it was positive about two thirds of the time, conversely negative the other third. So, the chart looks great, but there remain many outcomes.
Still, seasonality is an incremental positive. We remain in the same camp as before. We believe inflation is cooling and will fade as a near-term issue (likely to return in future years). The recent move higher in yields was driven in part by a strong U.S. economy, partly thanks to QE being turned back on temporarily back in March and a very healthy or resilient consumer. (We’re getting so tired of the word “resilient.”) The higher yields were also a short-term supply/demand issue, which is starting to fade (again, for now). Pile it all up, and yields should cool, and we may have seen peak yields.
Falling yields will help the equity market move higher. Yes, bonds and equities are moving in the same direction, up this time, so we highly doubt anyone will complain. How far it could go is a challenging question, as next year is quickly becoming the problem. 2024 recession risk is high. Corporate margin risk is high. In short, we are renters of a year-end rally.
Central banks affects FX: Who yields first?
Despite recent noteworthy moves in the currency markets, overall volatility as measured by the Deutsche Bank FX Volatility Indicator remains rather subdued. Japan has been in the news, with the Yen falling to near a 33-year low after the recent Bank of Japan’s policy move. Besides that, the moves in FX land have been more plodding along and less spirited compared to certain periods over the past few years. Global rates being higher for longer is sure to ramp up some financial drama. Higher rates have this ability to expose weaker players both at a company as well as at a country level.
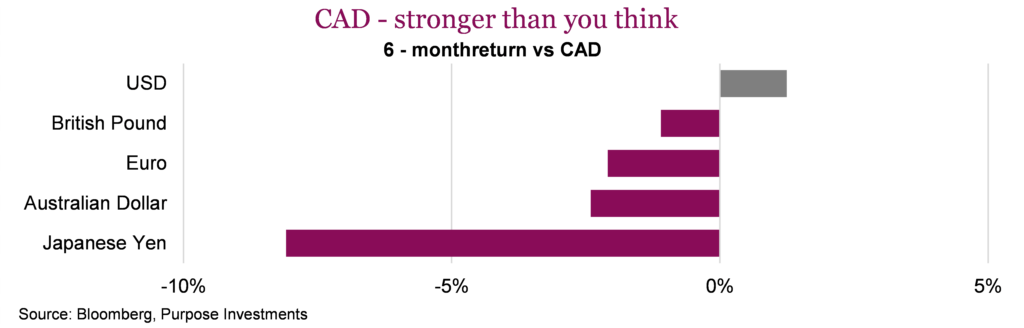
This is the primary reason why the Canadian dollar has slid against the U.S. dollar over the past four months, declining as much as 5.8%. Quite the move in currency land. Surprisingly, the Canadian dollar has shown more resilience against other currencies than it might seem. In the chart below, we plot the loonie’s returns against several other key currencies over the past six months, and it’s actually held up rather well, outperforming the Pound, Euro, Aussie dollar and the Yen. So no, the loonie isn’t in peril, but Canada does face a number of challenges.
Whether it’s credit losses, liquidity crunches, or simply exposing high leverage and weak hands, tighter financial conditions can impact countries just as much as companies. This would explain the swift shift in sentiment for the Canadian dollar in both futures as well as spot markets. The critical question is which central banks will yield first? Both the Fed and BoC have expressed caution, saying it’s too early to wave the victory flag after their battle with inflation. While both have moved in tandem over the past year and a half, Canada was the first to pause and may be the first to cut. The market is making its bets, but such big shifts are inherently unpredictable.
The surprisingly resilient economy south of our border in recent months has helped push the U.S. dollar higher. Mounting recession fears and lower growth expectations across Europe as well as in Canada have pushed these currencies lower. Nonetheless, the market is still pricing in more rate cuts for the Federal Reserve than other major central banks despite the reality of a more resilient U.S. economy. This is highly incongruous. If the Fed is indeed cutting, we believe others, such as the BoC, will be cutting first.
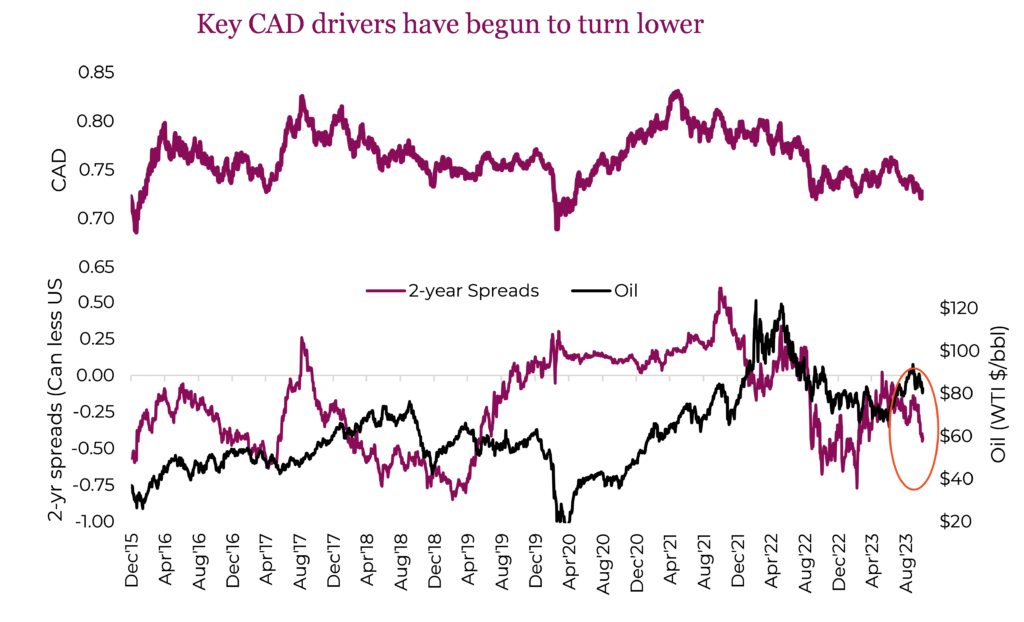
Key drivers of the CAD-USD relationship remain economic factors, commodity prices, market sentiment and monetary policy. These factors manifest in the bond market. In the chart below, we can see that despite oil moving higher since the summer, rate differentials have trended lower, placing the Canadian dollar at the lower end of a year-long range. Previously, this would be an area that might have prompted the consideration of partial hedges. However, we continue to hold a near-term positive view of the USD due to several factors. Rate differentials make the U.S. a relatively attractive destination for investment. This favours the USD. The spread – or gap – between the yield on benchmark Canadian and U.S. debt was 42 bps this week, the highest level since the spring. To think that in June, the spread had all but evaporated.
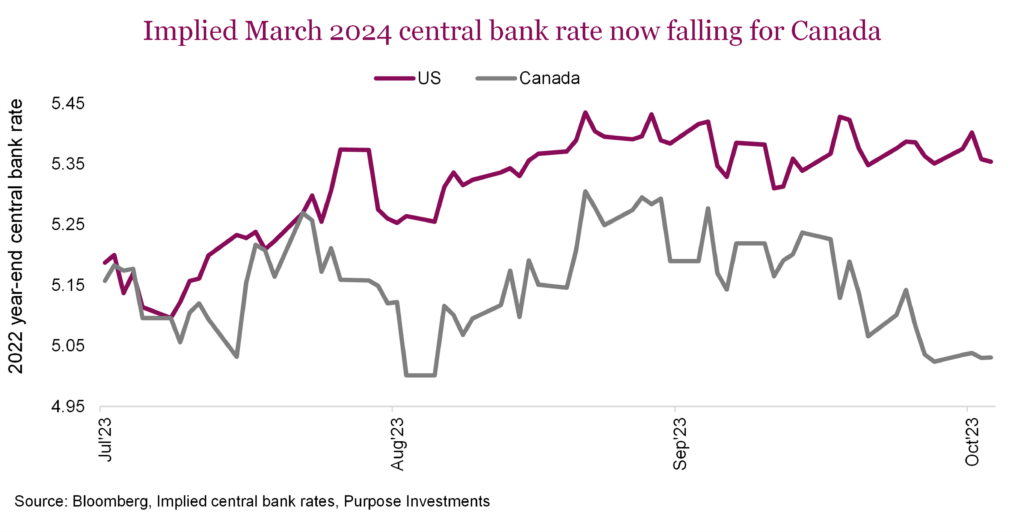
This graph illustrates the market’s increasingly dovish expectations of the BoC growing over the past few months. The implied March 2024 central bank rate for the U.S. and Canada was nearly equal in the summer; however, the market is pricing in a 32 bps difference within the next four months, suggesting that the BoC will act first.
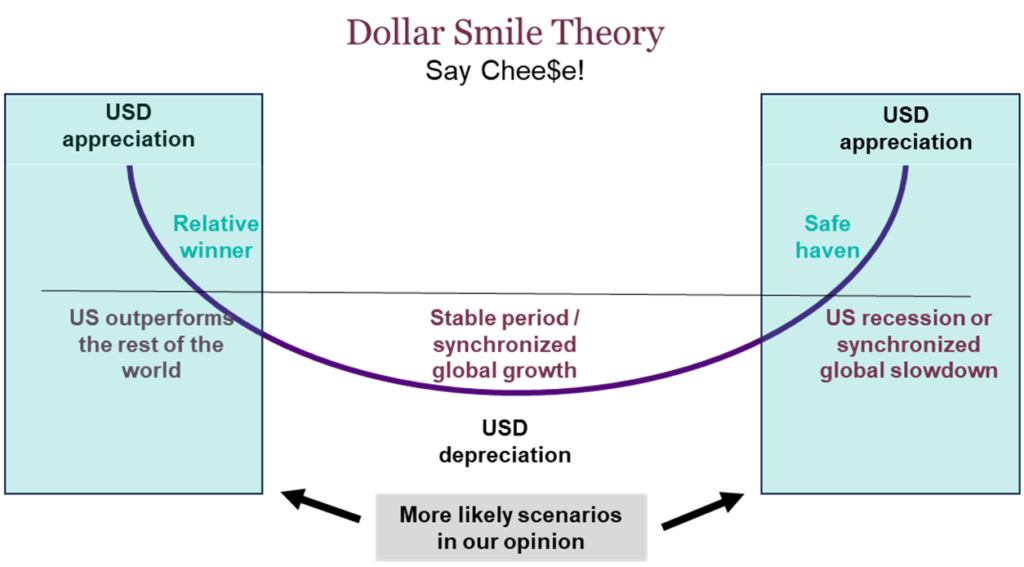
The Dollar Smile Theory, although somewhat theoretical, remains a core currency concept. The graphic is a simplified version that outlines three broad scenarios for the dollar and everything else. A stronger dollar occurs when the US is the big relative winner versus everyone else in terms of growth. This is pure American exceptionalism. The other side is when the dollar benefits from a global downturn, sparking safe-haven demand for the U.S. currency. Two opposite ends of the spectrum, but both resulting in a strong dollar. The dip in the middle is when the dollar is weaker, indicating global economic stability or synchronized growth. Given these scenarios, our base case remains a looming recession. It could be global but possibly less synchronized. In either case, we believe the more likely scenarios will result in sustained dollar demand.
Our outlook for the CAD is more cautious, with a downside bias. Although, near-term, we could see a technical bounce from oversold levels, there remain several major factors that present risks. Chief among them is the potential that Canada is likely to experience a deeper economic slowdown. Though fluctuation in commodity prices may have an impact in the near future, we don’t see the recent strength in the energy market to provide enough of an updraft for the loonie to fly. For now, we prefer unhedged U.S. exposure, believing the Bank of Canada will maintain a relatively dovish stance compared to the Federal Reserve, which will weigh on the Canadian dollar.
Market cycle, positioning, probabilities
There is some good news out there, and that good news is things have gotten a little worse. Yes, we are all living and investing in the upside-down (thankfully, no Demogorgon for those Stranger Things fans). It is upside down because signs of weakening economic data is a good thing. It further alleviates inflation concerns, which we believe will continue to fade. The weaker data also helps bring those bond yields back down a bit, and given much of the equity market weakness over the past few months was largely caused by higher yields, weaker data equals good news … for now.
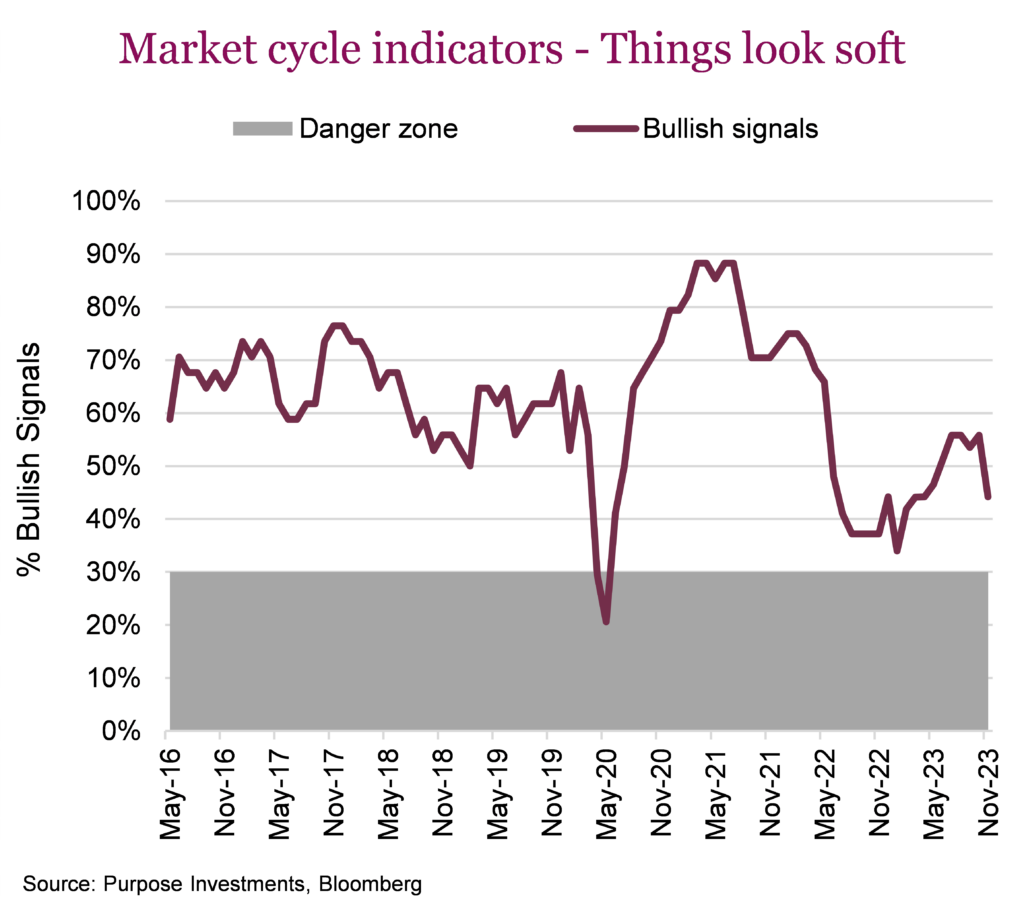
And the data is getting weaker. Yes, we have all heard how resilient the U.S. economy is, and it did just post a 4.9% annualized rate for Q3. We would also point out that everyone had come around to seeing the U.S. economy really take a step up in the summer, which is embedded in that GDP print. More recently, though, the strength appears to be oscillating back to weakness. The October U.S. labour report was a miss. We are also seeing further weakness in a number of our Market Cycle Indicators.
Three Market Cycle indicators for the broader U.S. economy flipped to bearish. GDPNow from the Atlanta Fed recently dropped; this GDP measure doesn’t track GDP but instead uses a number of more timely inputs to gauge how the economy is doing, ‘today.’ The official GDP, which was just released in late October, tells us how the economy was doing all the way back in July, August and September. Consumer sentiment also dropped, and unemployment ticked higher. The unemployment one is a big deal; it has risen to 3.9%. This may sound inconsequential, but unemployment is now +0.5% from its cycle low of 3.4% back in March. A half percent move in unemployment has been a very reliable early indication of a recession.
Add in a drop in housing starts that flipped from bullish to bearish, and the drop in all the indicators came from America. Our belief is the economy is slowing, more outside North America, but it’s coming back closer to home now, too. The U.S. enjoyed a positive economic growth bounce in the middle of this year, which everyone jokingly attributes to the Barbie movie and Taylor Swift. But now, with the movie fading and Taylor focused on the Chiefs, things are slowing down. Ok, now I’m really kidding. More likely, quantitative easing was turned back on in the spring to help out U.S. banks. This likely injected capital, suppressed yields and led to this uptick in growth. Whatever the cause you prefer, we believe growth will fade into 2024.
Portfolio positioning
In terms of portfolio positioning, we did add a bit to bonds when yields spiked higher, so we’re clearly happy to see them coming back down a bit. This change increased our government and duration a little, as we used cash to fund the change. In equities, we prefer safer vehicles with an affinity toward dividend-yielding shares, which we view as attractive value. We remain overweight international. Within the fixed income space, we prefer the safety of investment grade bonds and government debt, believing the risk/reward trade-off in the high yield space is not yet tilted in the investor’s favour. Despite the continued sell-off in emerging market shares, we’ve yet to even dip our toe into this asset class. Within alternatives, we prefer real assets and defensive strategies.
Probabilities
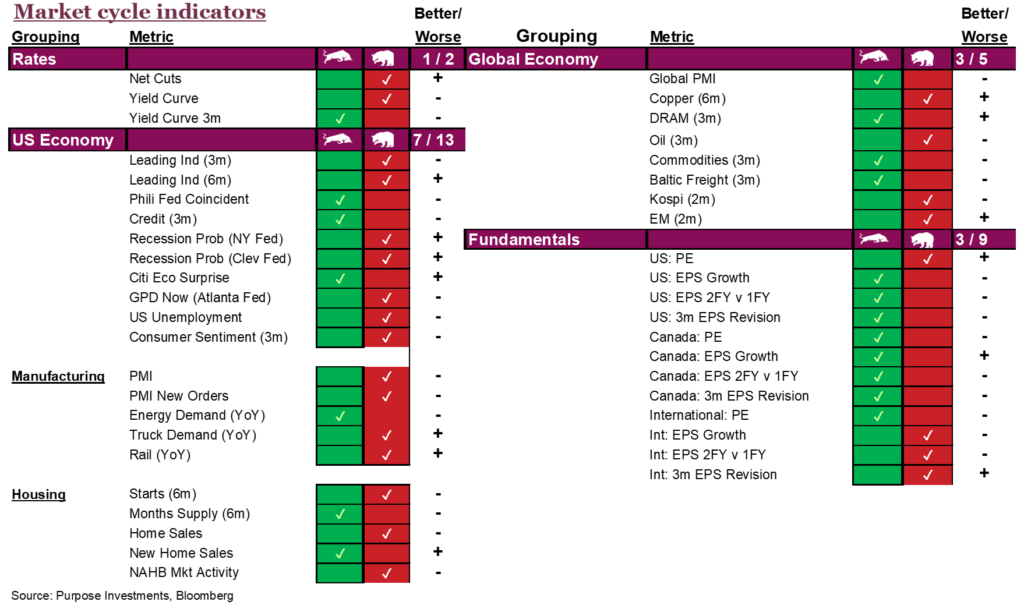
Markets have come down in August, September and October as bond yields have risen (aka bond prices down). Things certainly became oversold on a short-term basis, and we believe the bounce has started. We slightly increased our probability of equity markets moving higher in the next three months. However, longer-term views have not moved.
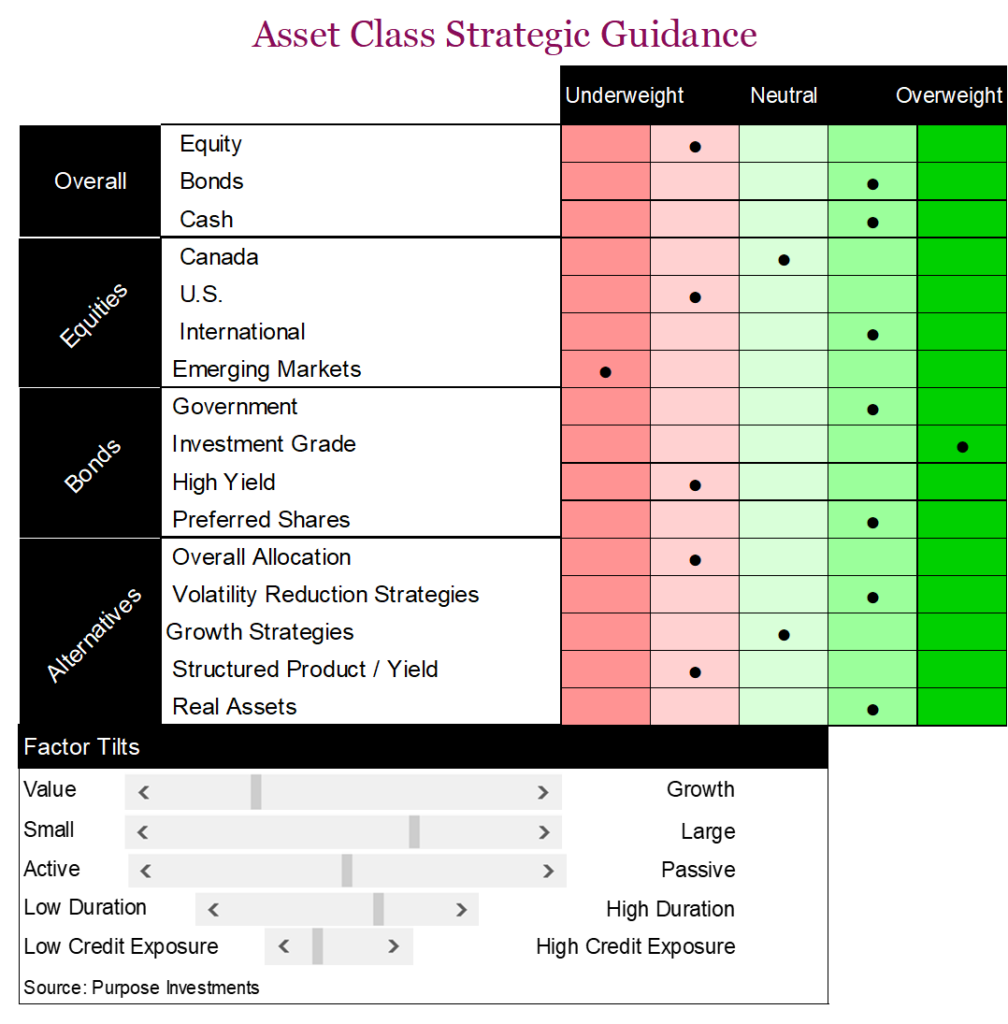
The table is a synopsis of some of our behind-the-scenes debates, analyses, and even arguments. We hope this provides some added insight into our process but also into our conviction on current positioning. This will become a standard component of future updates so we can all monitor changing views, opinions and, of course, positioning.
The final word
Markets and the economy are gradually adjusting to higher costs of capital (higher yields/rates) and less abundant capital. The process will take a long time to work its way through, causing both up and down oscillations in the stock and bond markets. This will also likely lead to a recession that may not be as soft as the consensus believes. This does have us still leaning with a moderately defense stance in our multi-asset portfolios, but still with enough exposure to benefit from a potential rally into year-end. If this does transpire, we would anticipate getting a bit more defensive on strength.
Year-end rally or not, hard, soft or no landing, either way, markets are making progress and steadily getting closer to being in a much better place to start the next cycle.
Sign up here to receive the Market Ethos by email.
Source: Charts are sourced to Bloomberg L.P., Purpose Investments Inc., and Richardson Wealth unless otherwise noted.
*Authors:
Purpose Investments: Craig Basinger, Chief Market Strategist; Derek Benedet, Portfolio Manager
Richardson Wealth: Andrew Innis, Analyst; Phil Kwon, Head of Portfolio Analytics; An Nguyen, VP Investment Services
Disclaimers
Richardson Wealth Limited
The opinions expressed in this report are the opinions of the author and readers should not assume they reflect the opinions or recommendations of Richardson Wealth Limited or its affiliates. Assumptions, opinions and estimates constitute the author’s judgment as of the date of this material and are subject to change without notice. We do not warrant the completeness or accuracy of this material, and it should not be relied upon as such. Before acting on any recommendation, you should consider whether it is suitable for your particular circumstances and, if necessary, seek professional advice. Past performance is not indicative of future results. The comments contained herein are general in nature and are not intended to be, nor should be construed to be, legal or tax advice to any particular individual. Accordingly, individuals should consult their own legal or tax advisors for advice with respect to the tax consequences to them.
Richardson Wealth is a trademark of James Richardson & Sons, Limited used under license.
Purpose Investments Inc.
Purpose Investments Inc. is a registered securities entity. Commissions, trailing commissions, management fees and expenses all may be associated with investment funds. Please read the prospectus before investing. If the securities are purchased or sold on a stock exchange, you may pay more or receive less than the current net asset value. Investment funds are not guaranteed, their values change frequently and past performance may not be repeated.
Forward Looking Statements
Forward-looking statements are based on current expectations, estimates, forecasts and projections based on beliefs and assumptions made by author. These statements involve risks and uncertainties and are not guarantees of future performance or results and no assurance can be given that these estimates and expectations will prove to have been correct, and actual outcomes and results may differ materially from what is expressed, implied or projected in such forward-looking statements. Assumptions, opinions and estimates constitute the author’s judgment as of the date of this material and are subject to change without notice. Neither Purpose Investments nor Richardson Wealth warrant the completeness or accuracy of this material, and it should not be relied upon as such. Before acting on any recommendation, you should consider whether it is suitable for your particular circumstances and, if necessary, seek professional advice. Past performance is not indicative of future results. These estimates and expectations involve risks and uncertainties and are not guarantees of future performance or results and no assurance can be given that these estimates and expectations will prove to have been correct, and actual outcomes and results may differ materially from what is expressed, implied or projected in such forward-looking statements. Unless required by applicable law, it is not undertaken, and specifically disclaimed, that there is any intention or obligation to update or revise the forward-looking statements, whether as a result of new information, future events or otherwise.
Before acting on any recommendation, you should consider whether it is suitable for your particular circumstances and, if necessary, seek professional advice.
The particulars contained herein were obtained from sources which we believe are reliable, but are not guaranteed by us and may be incomplete. This is not an official publication or research report of either Richardson Wealth or Purpose Investments, and this is not to be used as a solicitation in any jurisdiction.
This document is not for public distribution, is for informational purposes only, and is not being delivered to you in the context of an offering of any securities, nor is it a recommendation or solicitation to buy, hold or sell any security.
Richardson Wealth Limited, Member Canadian Investor Protection Fund.
Richardson Wealth is a trademark of James Richardson & Sons, Limited used under license.