
July 3, 2024
Investor Strategy
Second half challenges ahead
Sign up here to receive the Market Ethos by email.
Executive summary
- Summer is cutting season
- First half recap
- Second half – continuation or reversal?
- Market cycle
- Final thoughts
The trend is your friend, or so the saying goes. If this holds, the second half (2H) should be some pretty smooth sailing, given the 1H. And there is good news out there, albeit with some challenges. Here are our big highlights for the second half:
- Economy: Improving global economy continues for a while even as U.S. growth slows. Then likely beyond 2H, everything slows
- Inflation: Generally falls further, even with some counter trend scares. Yields likely remain stuck in a range
- Volatility: Political risk causes periods of higher volatility and uncertainty.
- Divergence: Diverging economic activity will continue to drive diverging market performance. 2H gains will be more variable, likely even some markets giving back some of the earlier gains.
Summer is cutting season
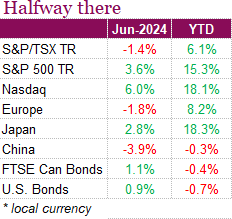
We are now at the halfway point of the year, with equities (at least in the U.S.) continuing to see strong gains. On a total return basis, the S&P 500 rose 3.6% in June while the Nasdaq advanced an impressive 6%, with the indexes taking their cues from the few tech names that have dominated the headlines this year. It’s worth noting that fewer names are driving the gains though, with the Magnificent 7 shedding a few names, with Nvidia, Apple, Microsoft, and Alphabet doing most of the heavy lifting in June. Despite more of the big tech names beginning to weigh on the markets, the S&P 500 has clocked 31 all-time highs this year and is now up 15.3% YTD. The tech heavy Nasdaq continues to lead the pack, up 18.6% YTD, a very impressive feat when you compare it to the Canadian market. The S&P TSX has trailed its peers this year, and June was no exception. The index was down -1.4% on a total return basis in June, weighed down by Financials, Utilities, Energy, Communications, and Materials. Overall, the index is up a respectable 6.1% YTD, a good number but not great when compared to our friends south of the border. Overall, equity markets have seen impressive gains so far this year, yet recession risks still linger. Political uncertainty has been stoking volatility, and economic data continues to point to a weakening economy, creating some unease in the markets.

There was a notable shift in the markets in June, with the Bank of Canada cutting its benchmark interest rate by 25 bps to 4.75%, becoming the first G-7 central bank to initiate an easing cycle. Adding to this, officials signaled that additional cuts are likely if inflation shows further signs of slowing. Hopes of an additional cut in July were challenged though, after Canada’s inflation rate reaccelerated to 2.9% in May, up from 2.7% in April, primarily driven by higher service prices. This increase, exceeded economists’ expectations and put a stop to the four-month trend of easing prices. Core inflation measures also rose, averaging 2.85%, suggesting underlying price pressures remain. Even with investors adjusting the rate cut path, bond markets finished the month higher, with the FTSE Canada Universe Bond Index up 1.1%, although the index remains in the red YTD, down -0.4%.
The main event this month was the Fed’s interest rate decision. In a widely expected move, the Federal Reserve kept its benchmark rate steady yesterday between 5.25% and 5.50%. Still, the market was more focused on Fed officials’ new summary of economic projections (dot plot), which earmarked just one rate cut for 2024, down from the previous median projection last quarter of three cuts. Fed Chair Powell however, left room for more cuts as he continued to emphasize a cautious data dependent approach. The median rate cut projections for 2025 came in at four, highlighting the intention to maintain higher borrowing costs to combat inflation. The latest Fed decision came only hours after data showed the core consumer price index was essentially flat for the month, rising by 0.2% in May, and 3.4% compared to last year. The encouraging data highlights some progress made towards the Fed’s 2% inflation target. Other data also supported the idea that the Fed could cut rates more than once this year, with the Fed’s preferred inflation measure, the core personal consumption expenditures (PCE) price index, increasing by 0.1% in May, marking the smallest rise in six months. Year-over-year, it rose 2.6%, the lowest rate since early 2021. The market may be at odds with the Fed once again, expecting more rate cuts than what the central bank is implying. When it was all said and done, bond markets were up over the month, with the US aggregate bond index rising 1% over the month, with the index now nearly flat YTD, down just -0.7%.
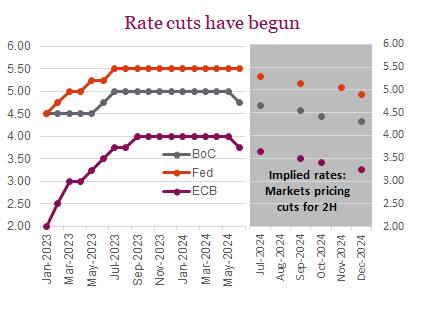
The EBC joined the BoC in cutting interest rates this month, putting a bit more pressure on the Fed to do the same. ECB President Christine Lagarde announced a quarter-point cut in the key deposit rate to 3.75%, citing a noticeably improved inflation outlook despite higher price projections. Despite markets responding positively to the move, volatility struck the eurozone after French President Emmanuel Macron’s decision to call a snap election. The decision has cast some doubt on the stability of the French economy and Macron’s pro-business agenda, leading to a sharp selloff, with French bonds seeing their highest yields relative to German bonds since December. The uncertainty surrounding the elections has raised fears of prolonged fiscal deficits and prompted credit rating downgrades, contributing to market volatility and weakening the euro.
First half recap
There isn’t too much for investors to complain about as we pass into the second half of 2024. Equities are up nicely, the Bloomberg World Equity Index is about +15%, darn good for the halfway point. Bonds are flat to up a bit. Not great, but remember if equities are up strongly, we want bonds to be behaving a bit differently, and they are. Commodities are also up.
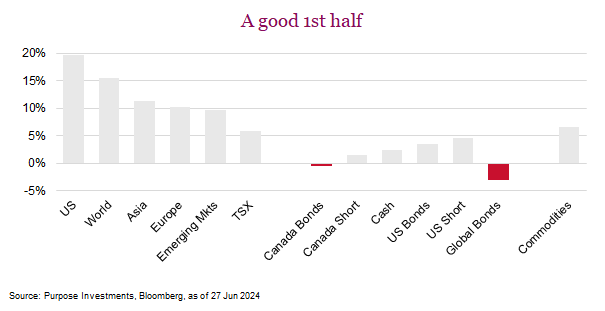
On the economic front, inflation is down pretty much everywhere. A basket of 10 major economies show 8 have seen inflation improvements in 2023, and continue in 2024. Japan and Denmark were the outliers. A weakening yen is certainly keeping inflation higher in Japan and if you have been to Copenhagen, nobody notices inflation because everything already costs ridiculously too much (all worth it though). Canada has added +200k jobs this year, based on nonfarm payroll survey results, while the U.S. has added about 1.2M jobs. By most general measures, reasonable economic growth was the norm – certainly strong enough to have economist recession probabilities drop nicely.
The only real challenge was the narrowness of the market and the divergence among some markets. Canada’s TSX is up about 6%, which isn’t bad but certainly not as good as many others. Europe is up about 10%, as is Asia, and the U.S. S&P 500 is ahead just under 20% [all total return in CAD]. The U.S. becomes a bit more challenging due to its narrow leadership as just five companies contributed half of the market’s gains.
That’s a quick summary of the first half – just about everybody made money. And generally, the surprises were to the upside.
Second half – continuation or reversal?
The trend is your friend, or so the saying goes. If this holds, the second half (2H) should be some pretty smooth sailing, given the 1H. And there is good news out there, albeit with some challenges. Here are our big highlights for the second half:
I. Economy: Improving global economy continues for a while even as U.S. growth slows. Then likely beyond 2H, everything slows
II. Inflation: Generally falls further, even with some counter trend scares. Yields likely remain stuck in a range
III. Volatility: Political risk causes periods of higher volatility and uncertainty.
IV. Divergence: Diverging economic activity will continue to drive diverging market performance. 2H gains will be more variable, likely even some markets giving back some of the earlier gains.
I. Economy – Goldilocks for now
The manufacturing recession or slowdown of 2022/2023, which fooled most of us into thinking a real recession was imminent, appears to be over. Take your pick from industrial activity, PMI surveys or global trade, there is a rising trend of activity globally. Better global economic activity has certainly pushed folks’ recession probabilities lower and yet has not been too strong to reverse gains on inflation. That is Goldilocks, just the way she likes her porridge.
We do not question the improvement in manufacturing activity, however we are not convinced of its longevity. The chart below is global trade over the past few years with a number of large rises and drops. Pandemic drop was followed by an unprecedented spike as we all sat at home and ordered stuff. Then a big drop as mobility returned, we all went out to revenge travel and stopped ordering stuff as much. So is the latest rebound just a bounce back as people’s spending on services/goods gets closer to normal or is it a sign of rising global aggregate demand?
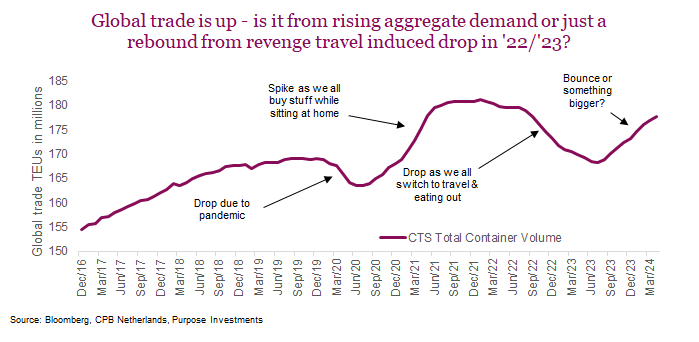
We just don’t see where a sustainable increase in demand would come from. The consumer, helped by wage gains and decent employment growth, appears to have blown through accumulated savings from the pandemic years and inflation/higher rates have eroded things further. Now the job market is starting to falter a bit. How about credit growth? Well that has slowed due to higher borrowing costs. Then there is government. Fiscal spending, looking at deficits, remain robust given a global economy that is reasonably healthy. But it is the rate of change that matters, and this too is starting to slow.
Add it all up, this rise in global economic growth will likely falter down the road a bit. In the near term though, it will likely continue. Trade continues to rise, with Korea and Taiwan exports growing decently. These are two canary economies for global economic activity given their higher leverage to exports. And PMI survey data in major economies continues to firm.
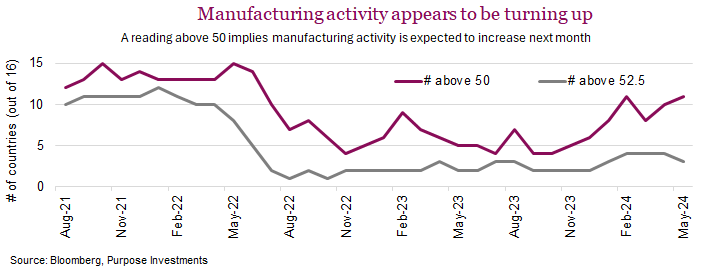
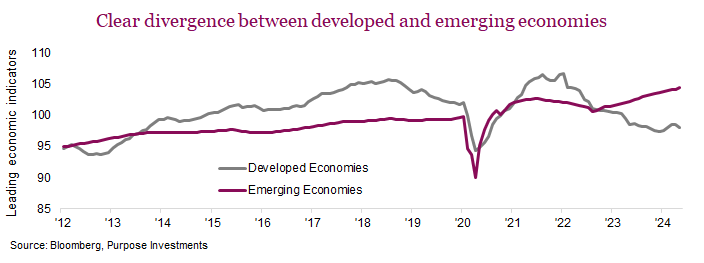
We are encouraged that 12 of 16 major manufacturing economies have a PMI survey over 50, expansion territory. Yet the number of 52½, let’s say more robust activity is still pretty low. Call it a healthy manufacturing environment but not gangbusters. Equally interesting is divergence in the economic activity. In the following chart we have a weighted (based on size of economy) leading economic indicator score for developed economies and developing/emerging economies. The sample size is smaller given not every country creates a leading economic indicator measure. Still, it’s worth noting the trend for developed economies is flattish, while emerging economies appear to be doing better.
The global economy is doing better, and we do believe this could last for a bit. However, given increasing cracks in the U.S. consumer, rolling over of stimulus momentum and ongoing drag from higher yields/inflation, we don’t believe this recent uptick in growth is the start of an extended economic expansion.
Portfolio thoughts – We remain a mild underweight in equities and holding more cash. Still at the party but standing closer to the door and not cutting a rug on the dance floor. It also has us looking more outside North America, including an existing international developed market overweight and a recent increase in emerging markets exposure. Tilted to where the growth is improving and not slowing.
II. Inflation & yields – improving and rangebound
Inflation should continue to moderate in the second half of the year. The faster moving components continue to elicit disinflationary pressure and the stickier components, which are still elevated, are starting to roll over. This is a good news story. This would have us believe bond yields should move lower, however the improving economic activity and large issuances to fund deficit spending will limit this trend and likely keep yields rangebound.
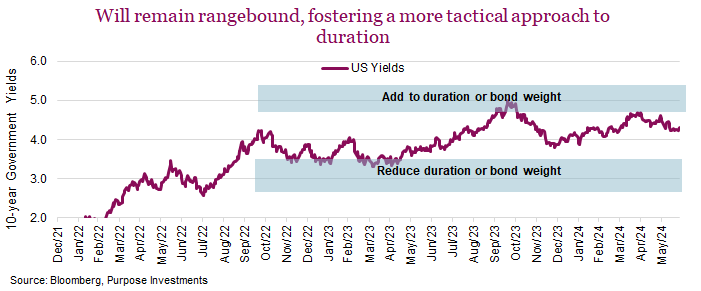
The chart above is for U.S. 10-year yields; our view is similar for Canada albeit with lower yields. For now we believe yields will remain rangebound. When/if elevated, there will be an opportunity to add duration. When/if yields reach the lower bound, we’ll see an opportunity to reduce bonds/durations.
If this current spate of improved economic growth slows, yields should come lower. And in the meantime, the current yields provide an adequate risk/return trade-off.
Portfolio thoughts – We do remain a very mild overweight bonds and are carrying a healthy duration. Some credit exposure is ok but not too much given spreads are historically tight.
III. Volatility – enter politics
Guessing the outcome of politics is not our strong suit. Even if you can guess right on who wins which election, how the market reacts is another variable that often makes correct guesses end up being disappointing from an investment perspective. As a result, we do like to ignore politics. Besides, politics frustrates us.
That being said, it is not lost on us that the market reaction to elections so far this year has added a lot of volatility to markets. Surprise results in India led to a sudden drop, which recovered quickly. In Mexico, a less market- friendly elevation has caused equities to drop and not recover. Now we have political risk elevated in France with a drop and partial recovery.
The takeaway: politics is adding to market volatility this year. And that is likely going to increase as the more important U.S. election nears. Based on campaign talk, a republican sweep would likely be positive as corporate tax cuts could be extended. A democrat sweep could be troubling. But again, you never know how markets would react. If there was a split in control of the White House, Congress and Senate, probably the best result as that limits the likelihood of policy changes. Most often no interference is best as then the economy remains more important.
Portfolio thoughts – We are in a world that has been gradually reverting to more protectionism, economic war/conflict between major nations and even some regional hot wars. With elections this year, political risk is rising as well. We believe this supports tilting towards some more defensive strategies and holding gold. Maybe things will not devolve into a market that requires crisis alpha stabilizers, but we would err on the side of caution.
IV. Divergence of returns equals some bad some good
The divergence of stock market returns, particularly across geographical regions this year is much larger than investors have gotten used to. It presents a compelling dynamic for portfolio construction. While it can introduce challenges, particularly that of performance chasing, it also unlocks valuable opportunities for investors.
Performance and uncertainty – The past few months have brought a significant bout of volatility across international markets. While most had kept up with the S&P 500 this year, that all changed earlier this month. June was election season, and perhaps a reminder that elections can be a harbinger for volatility. Surprise results in India and Mexico rattled investors. Elections especially when there is a surprise result can quickly impact investor appetite and create a period of uncertainty. Sometimes this is short- lived, such as in India where the Nifty 50 fell nearly 9% in a day, but quickly recovered and moved on to new highs and an impressive return of 12% off the lows. Other times, the results can be longer lasting. The Mexican market is still trading at the lows and is down by nearly 14% over the past month. The elections in June were a not so subtle reminder that markets don’t always move as one.
This return divergence has caught our attention. Looking across various major international market ETFs, covering both individual countries and regions, the spread in returns is quite large so far this year. There’s a 35% difference between the top-performing markets (US, India, and Taiwan) and the bottom-performing market like Brazil and Latin America. Much of this occurred in the latter half of the second quarter. In the chart below you can see how returns across international markets have diverged in Q2.It was an easy excuse to blame the poor Canadian markets on outsized selling pressure due to the change in tax laws, however Canada was not alone. Many markets began to weaken as the U.S. continued to make new highs. During the past three months, [as of June 27] Canada declined -2.7%, while the U.S. was up around 5.0% – solid but far from the best. A trio of Asian countries Taiwan, India and China – take the podium.
![Large divergence in global equity returns in Q2. In the chart below you can see how returns across international markets have diverged in Q2. It was an easy excuse to blame the poor Canadian markets on outsized selling pressure due to the change in tax laws, however Canada was not alone. Many markets began to weaken as the U.S. continued to make new highs. During the past three months, [as of June 27] Canada declined -2.7%, while the U.S. was up around 5.0% – solid but far from the best. A trio of Asian countries Taiwan, India and China – take the podium.](https://richardsonwealth.com/wp-content/uploads/2024/07/global-equity-returns-chart.png)
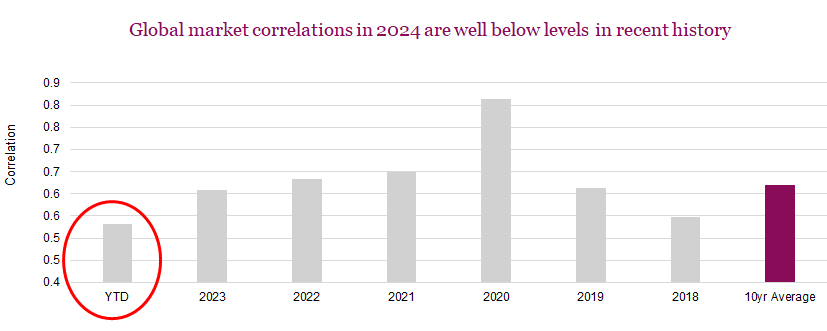
Correlations – A key metric for understanding the synchronization of global markets is correlation, which quantifies the degree to which two markets move together. Historically, correlations between developed markets have been trending upwards, meaning their movements tend to be more synchronized. This peaked in 2020 when global markets moved nearly all as one. The average correlation between a basket of developed markets in 2020 was 0.81. This was well above the 10-year average correlation between developed markets of 0.62. That period was exceptionally high and well above the 10-year average, essentially all markets moved as one. This reduced the diversification benefit of international investing to some extent. However, recent market conditions have seen a decrease in correlations compared to historical averages. Year-to-date, the average correlation among the same group of markets is only 0.53. This could be a result of deglobalization, but most likely a reduction in synchronized growth. This is a positive development for portfolio construction. Lower correlations between geographically diverse markets amplify the benefits of diversification. When one region experiences a downturn, another might perform well, offering a natural hedge and mitigating overall portfolio volatility.
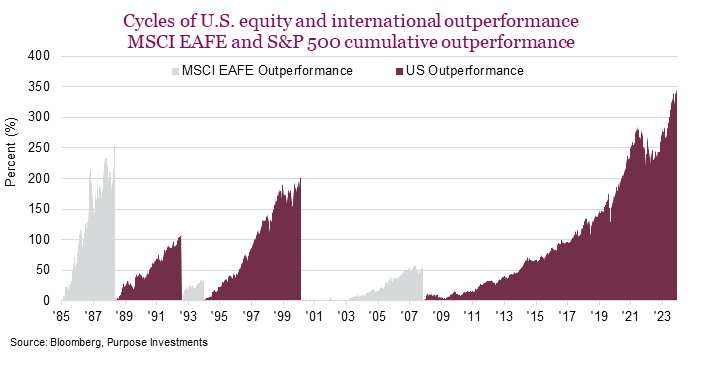
Concentration Risk – Concentration risk is a hot topic in 2024. Typically, it’s mentioned alongside the Mag 7 and how concentrated the U.S. market is. Concentration risk can also appear across a portfolio with an excessive tilt toward a particular country. More often than not, it’s the U.S. and why not, it’s had a stellar run the past decade plus relative to international markets. The chart below shows the historical periods of U.S. dominance. The current run of relative outperformance began in 2008 and since then the S&P 500 has outperformed the MSCI EAFE by over 350%. Significant by any standard, but at 16 years the stretch of U.S. exceptionalism is stretched by historical standards. Ignoring the behavioural aspects of performance chasing and excessively tilting portfolios to the U.S., from growth alone U.S. allocations are likely overly concentrated without rebalancing. Geographical concentration in a portfolio can exacerbate risk. The solution is simple, rebalance and diversify.
Portfolio thoughts – From a portfolio construction standpoint, divergence is at the root of diversification. As we’ve seen in 2020, when all correlations approach one, portfolios don’t behave as designed. The divergence of stock market returns across international regions presents is actually a good thing for portfolio construction. Not every country gets to stand on the podium each quarter, but with proper diversification the odds improve that portfolios can gain some exposure to the winners while balancing risk and return.
At this point in time, we still like an overweight in international equities due to growth prospects and relative valuations. We’ve also warmed to Emerging Markets. While certainly higher risk, we believe that emerging markets offer the potential for higher growth. With the U.S. election in November, perhaps it too could bring about some volatility as we’ve seen with other elections around the globe.
Market cycle
Our market cycle indicators, which total a little over 40, help provide a picture on the health of the market and economy. No signal or indicator works every time and the goal is to identify if the backdrop is eroding or improving. This helps differentiate between market weakness that could be a buying opportunity to deploy cash or lean into it, and those that may have worse to come.
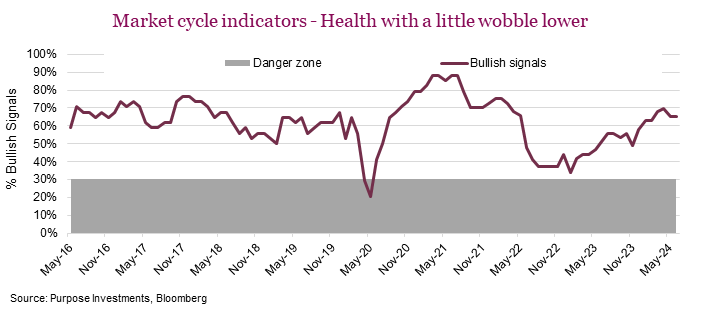
The indicators range from economic data, yields, spreads, commodities, markets and fundamentals. The good news is the number of bullish signals continued to rise in 2023 and this continued into 2024, with a bit of softening in the past few months. This lines up nicely with markets moving higher. The question is whether the recent tick back lower is the start of deterioration or just a little bobble. For now, we are not concerned, Market Cycle remains supportive of markets.
Digging into the specific indicators there have been a number of changes. While clearly more remain bullish than bearish, the bearish signals have ticked a bit higher. Even more impactful is the trend in the signal strengths for the U.S. economy (softening) and Fundamentals (improving). The ratio of signals improving last month for the U.S. economy was 7 better, 12 worsening. This past month that eroded more to only 2 improving and 17 worsening.
Countering this trend was an uptick in fundamentals, as a lot of the earnings data has improved over the past month. We saw 9 improving with only 3 deteriorating, compared to a month ago, when it was at 4 vs 8. The better economic data year-to-date appears to be making its way into earnings estimates for growth, a positive.
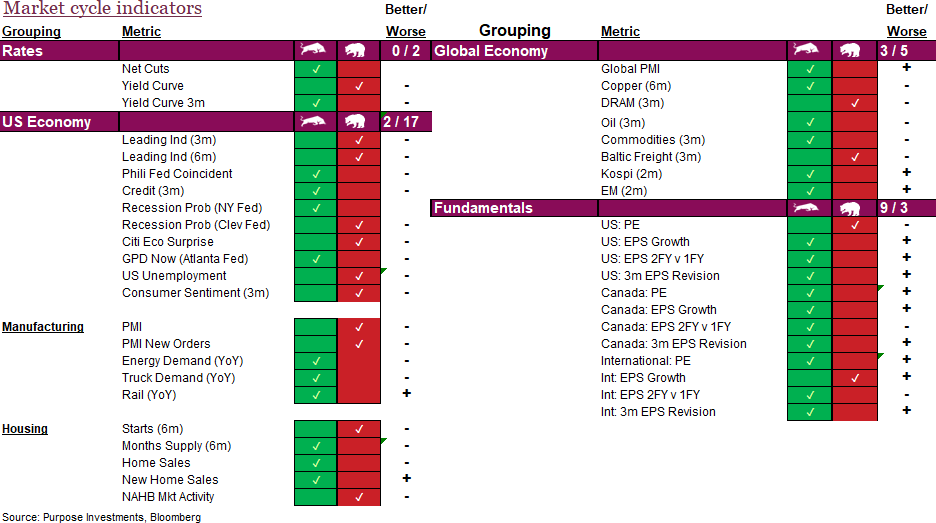
Overall, Market Cycle remains supportive, with a bit of a wobble of late.
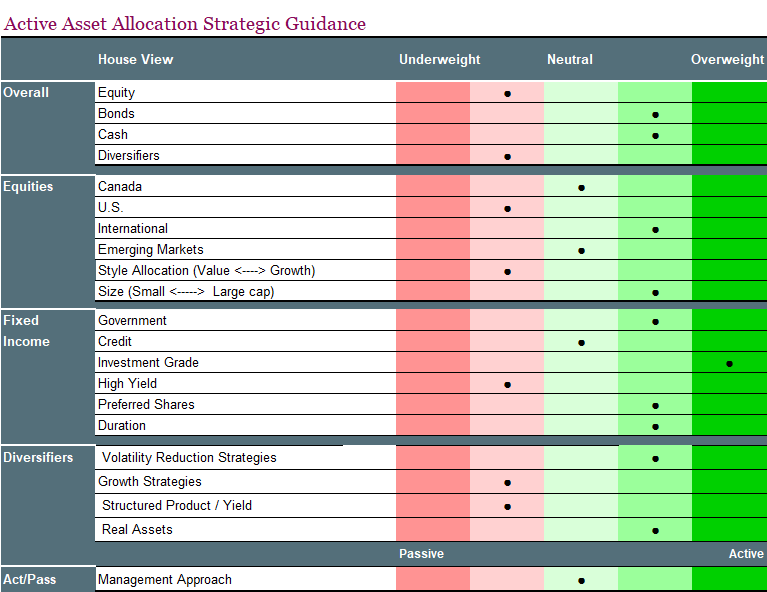
No recent changes to our overall portfolio recommendations. We have a mild underweight on equities, very mild after our last few changes. Very mild overweight in bonds and holding a bit extra cash; certainly a bit of a defensive lean. This carries into diversifiers as we are more focused on real assets (gold) and volatility reduction strategies.
The two changes in the past few months included:
- Splitting our gold bullion into a 50/50 split between bullion and gold miners in early March. We like gold for the second half and the miners have lagged the metal creating a good opportunity. It has closed somewhat over the past few months.
- In early May we trimmed Japan and Canadian equities to open a new position in emerging markets. As economic growth picks up internationally, and potentially slows in North America, we believe emerging markets continue to offer a good opportunity.
Final thoughts
The first half by just about every measure was a pleasant experience for investors. Inflation better, economy better, earnings better, and subsequently markets better. While we don’t like to be negative, the second half will certainly have greater challenges as this market has priced in a healthy dollop of good news. Election risk and divergence among economies may prove to be the biggest challenge for a smooth 2H.