
Sign up here to receive the Market Ethos by email.
August 2023.
Investor Strategy.
Executive summary
Time often seems to slow down during market sell-offs or corrections, as the volatility creates a more news-filled world. On the flip side, when markets keep going up, time flies. So, if you are wondering why this summer seems to have flown by quickly, blame the stock market. The S&P 500 is now up about 20% on the year and within 5% of its all-time high set back in January of 2022. The TSX, which has enjoyed more modest mid-single-digit returns this year, is about 7% away from its 2022 high. Really, there isn’t much to complain about so far this year. Even if you are a bit more defence positioned, like we are, returns are pretty good.
No summer doldrums in July
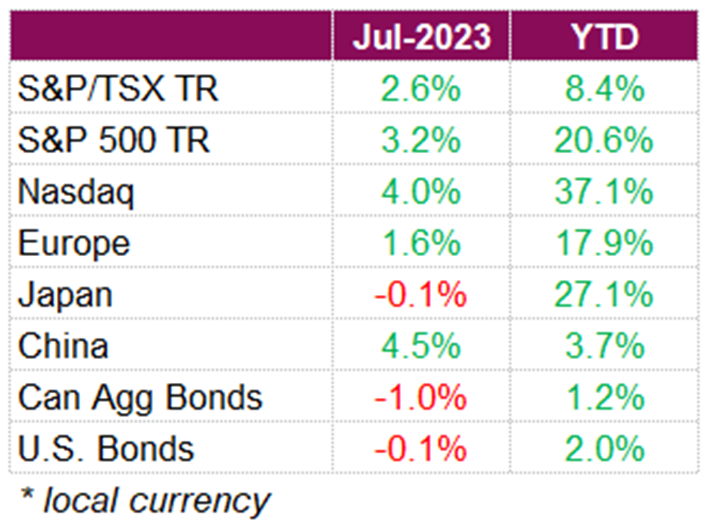
Investors took solace in economic data points and a positive start to earnings season, which helped equities continue their rally. It was all about streaks this month. The S&P 500 finished the month up 3.2%, its fifth positive month in a row for the first time since its seven-month streak ending August 2021. The Nasdaq gained in July, also its fifth straight winning month, while the Dow finished the month up 3.4% and posted 13 consecutive days of positive performance, matching a record streak from 1987. Although there is a little more to be worried about in Canada, investors shrugged off their concerns which helped propel the TSX to a July total return of 2.6%.
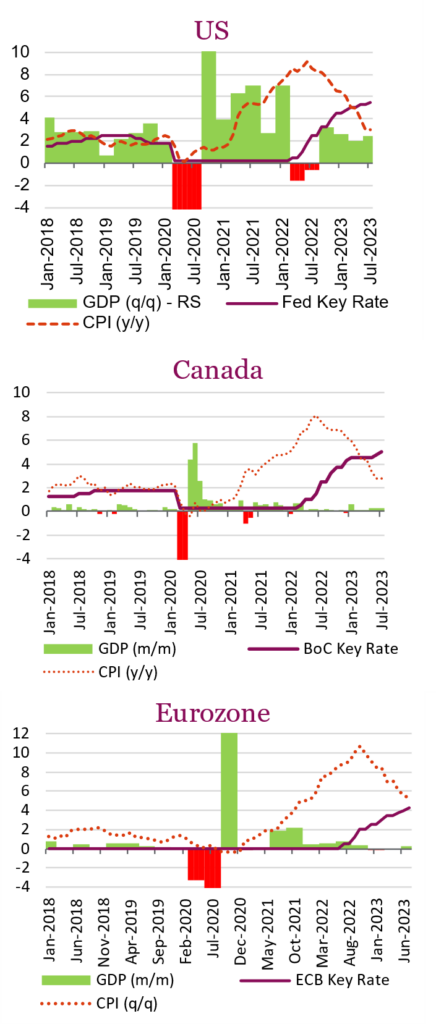
It was not so long ago when Fed Chair Jerome Powell announced that an economic soft landing was “still possible”. Markets scoffed at the idea that the Fed (and other central banks for that matter) could successfully navigate their way to that scenario, but investors seemed to change their tune throughout July. Economic growth without inflation was the goal, and data released this month showed that it was in fact possible (at least for the U.S.). The first estimate of Q2 GDP for the U.S. released this month showed GDP rising 2.4% on an annualized basis, well above the 1.8% estimates, while inflation fell to its lowest annual rate in more than two years in June. The numbers indicated that the U.S. is moving in the right direction, but just to be on the safe side, the Fed (as expected) went ahead with a 25bps rate hike. While another rate hike remains possible, markets are currently projecting just a 40% chance of another move in either September or November. On top of that, the Conference Board Consumer Confidence Survey showed consumer confidence rising to a two-year high while consumer inflation expectations fell to the lowest level since November 2020. Officials and markets alike are being careful not to declare victory over inflation just yet, but from what we saw last month, there may be hope in sight.
Inflation in Canada continued to moderate, with June CPI falling within the BoC’s control range for the first time since March 2021. The consumer price index rose 2.8% in June compared to the previous year, slightly lower than economists’ expectations, however, underlying pressures in core inflation have remained stubbornly high, with the trim and median core rates averaging 3.8%. The central bank now expects to reach its 2% inflation target by mid-2025, with inflation forecasted to remain around 3% for the next year. The central bank has highlighted elevated services inflation and uncertainty about expected inflation as factors contributing to sustained underlying price pressures. Despite prices trending lower, stronger-than-expected economic data has led the BoC to raise its benchmark rate by 25 bps to 5.0% in July, with officials remaining open to further hikes. There are some warning signs that we may not see the same soft landing as the U.S., after early readings for June GDP show the economy contracting -0.2%, indicating that the economy is cooling.
The ECB also delivered another interest rate hike at its July meeting, taking the deposit rate to 3.75% from 3.5%. During the post-meeting press conference, ECB President Christine Lagarde reiterated that policy decisions are data-dependent, and was noncommittal on a September hike, implying that all options may be on the table at the ECB’s next meeting. And while the ECB continues hiking, underlying inflation pressures persist, with consumer prices rising 5.3% from a year ago in July.
Rate hikes paired with diminishing economic risks continues to be a drag for fixed income investors, with the U.S. and Canadian aggregate bond indexes falling -0.1% and -1.0% respectively for the month. Soft-landing chatter, strong employment, sticky core inflation, and possibly more tightening means there will likely be no doldrums for the rest of the summer.
Time flies
Time often seems to slow down during market sell-offs or corrections, as the volatility creates a more news-filled world. On the flip side, when markets keep going up, time flies. So, if you are wondering why this summer seems to have flown by quickly, blame the stock market. The S&P 500 is now up about 20% on the year and within 5% of its all-time high set back in January of 2022. The TSX, which has enjoyed more modest mid-single-digit returns this year, is about 7% away from its 2022 high. Really, there isn’t much to complain about so far this year. Even if you are a bit more defence positioned, like we are, returns are pretty good.
Markets this year have wrestled through a number of headwinds. Some U.S. bank turmoil, debt ceiling, continued geopolitical tensions, slowing earnings and a ton of recession warning signals. But some big positives too. Inflation hasn’t gone away, but the trend appears in the right direction. Yes, parts of the economy are slowing, but other parts are proving rather resilient. Adding to this, positioning in options/futures markets, investor sentiment and fund flows were very negative a couple of months back. Part of this recent uptick in markets appears to have been a partial unwinding of some of these bearish bets.
Over the past couple of months, one big positive has been the broadening of the market advance. A couple of months ago, when the S&P 500 was up a more modest +15%, all of this advance was attributed to the big mega-cap technology names. While the market leadership is still tilted and concentration risk remains, we have seen the laggards finally start to participate over the last bit.
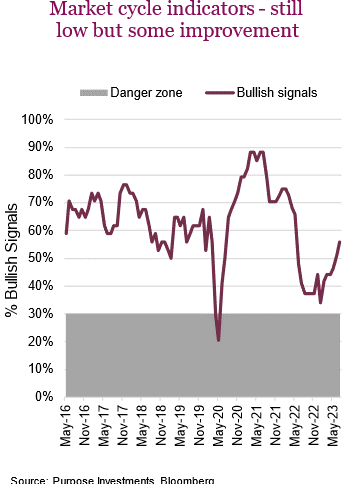
This chart, covering the past five years, plots the percentage of S&P 500 constituents trading above their respective 50-day moving average. At the end of May, this was below 30% as the market moved higher on the backs of just a few companies. Now we are knocking on the door of 90% market breadth. This has been helping the equal-weighted index catch up a bit to the more popular market cap-weighted index.
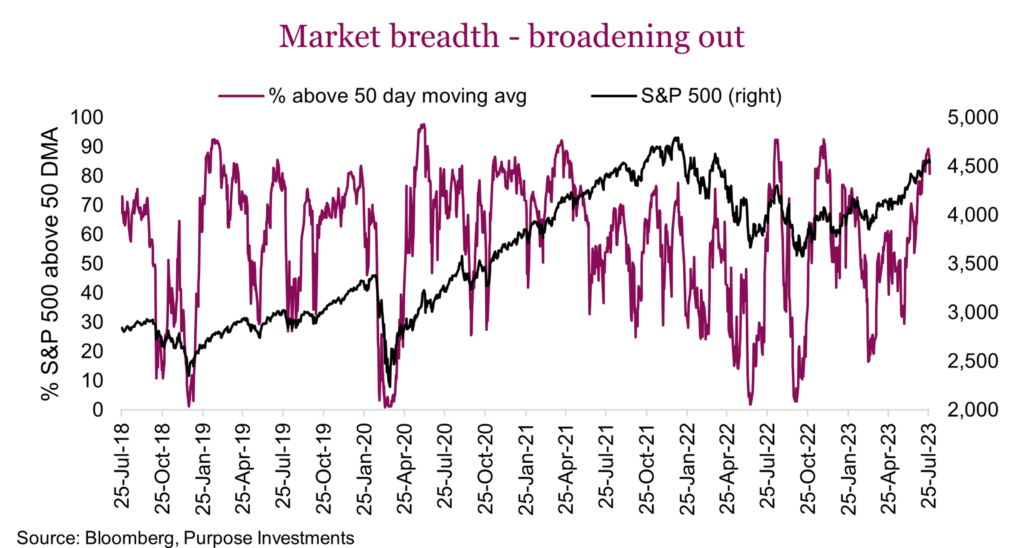
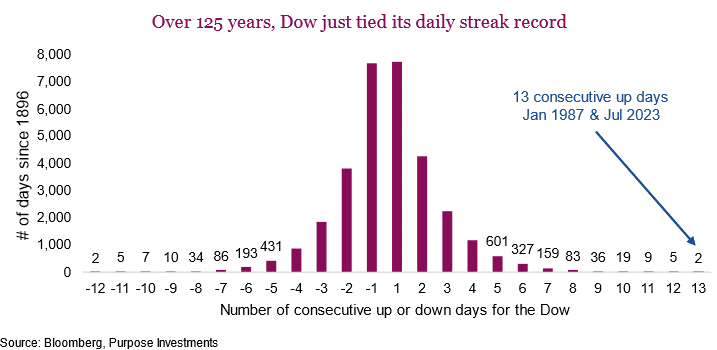
Interestingly, when this measure of market breadth reaches the 90% area, it often stalls. In other words, this rally is getting deeper into overbought territory. But that shouldn’t be a surprise given the Dow rose 13 consecutive days in July, which Brett says ties the previous record set in 1987 over the Dow’s 125+ year history.
If this is just a bear market bounce off of last year’s sell-off, it is one helluva bounce. Certainly noteworthy, the biggest gainers this year from a market perspective are the biggest droppers last year. In order, last year’s biggest decliners were crypto, NASDAQ, international equities, S&P 500, and then the TSX down the least. This year the biggest gainers are crypto, NASDAQ, international equities, S&P 500, and then the TSX up the least.
Can’t go down forever
Investors have grown to have a love/hate relationship with preferred shares, tilted more towards hate of late. High after-tax adjusted yields are enticing, yet the volatility in the space can prove detrimental. Downside volatility of the preferred share asset class over the past year has been particularly acute. From January 2022 to the beginning of June 2023, the TSX/Preferred Share Index fell over 20% from a total return basis before recovering a few points.
Despite this, a convergence of factors suggests that preferred shares now present an attractive opportunity for investors seeking income and potentially capital appreciation. We look at technical, fundamental, and value drivers, highlighting the potential for increased yields and capital appreciation. Though there remain risks associated with this asset class, current conditions offer a compelling case to add into multi-asset portfolios.
Fundamental drivers
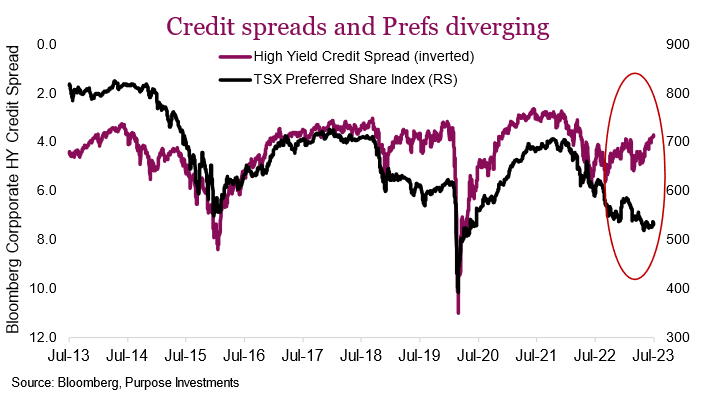
Despite the recent weakness, several fundamental drivers suggest a positive outlook for preferred shares. Two primary drivers, credit spreads and interest rates, play a crucial role in determining the performance of this asset class. Credit spreads and preferred shares have a strong correlation, yet there is a growing divergence. The current rally in credit spreads contradicts current sentiment, implying a more favourable environment for preferred shares.
Normally, higher yields result in higher trading levels in Canadian preferred shares since the index is now predominantly made up of rate-reset preferreds whose coupons float periodically on a fixed reset schedule. Rate reset coupons will be resetting preferred coupons significantly higher at current levels given the large move higher in 5yr bond yields. Currently, the Canadian 5yr bond yield is 3.9%, the highest it’s been since 2007, when the average preferred share coupon will be adjusted significantly higher in the future, considering reset spreads average 2.84%. This equates to an average yield for rate resets of 6.7% over the next few years. This is an attractive yield on its own, but considering these are dividend payments, the interest-rated adjusted yield of 8.8% is quite attractive on an after-tax basis.
Technical factors
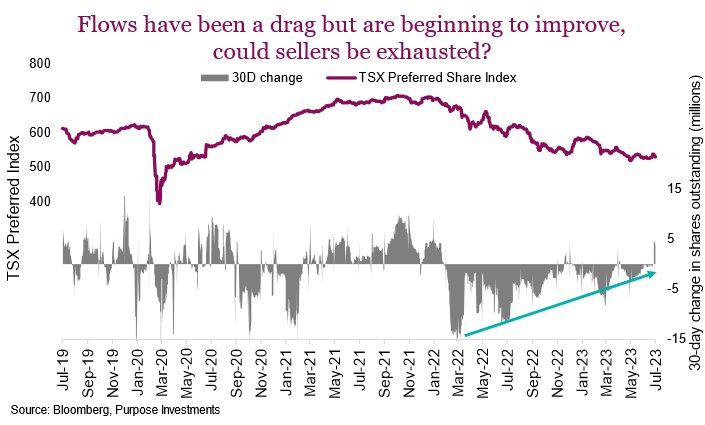
In June, despite risk assets continuing to shine, preferred share returns were weaker (1.3%) compared with equities and higher beta credit segments. This underperformance can be attributed to various technical factors, including outflows from the asset class and an apparent “buyers strike.”
Fund flows have taken over as the main technical driver of the market, which is magnified given less liquidity. The chart on the right details the cumulative outstanding shares of the three largest preferred share ETFs in Canada as well as the 30-day change. Thanks to a solid rebound following the pandemic, fund flow peaked in late 2021. Since then, there have been 16 months of outflows out of the past 17 months. This consistent selling pressure in a rather illiquid market was sufficient to overwhelm bids and drag the asset class lower, even suppressing what should be positive fundamental drivers. The good news is that there are some green shoots. Fund flow turned positive last week, and as you can see from the chart, the intensity of the selling pressure has gradually been calming down over the past few months.
Risks to keep an eye on
Investors must be mindful of the risks associated with preferred shares. The asset class is exposed to credit risk and is sensitive to movements in interest rates. A significant decrease in interest rates could negatively impact preferred shares. Additionally, the illiquidity of preferred shares results in increased volatility at times. One other notable concern is that the proposed tax treatment of dividends received by banks and insurance companies may have deterred these potential buyers from entering the preferred share market. Opportunity rarely comes without risk, but at present, we believe there is a favourable risk/reward ratio.
The current market environment presents an intriguing opportunity to increase exposure to preferred shares in a portfolio. Despite recent weakness, technical and fundamental drivers indicate a potential upswing for the asset class. The rate reset feature, solid credit quality coupled with attractive current and even better future yields offer a compelling proposition. For those seeking income and capital appreciation, the time seems ripe to reevaluate preferred share allocations within their portfolios. Another intriguing aspect is with the market rally broadening; it’s beginning to expand to areas of the market that have long been neglected.
Market cycle
Market cycle indicators continued to improve a bit over the past month and are getting close to a more neutral stance (still mildly bearish). The yield curve became a bit less inverted, and housing data improved a bit. Meanwhile, international and fundamental metrics remained stable.
Let’s talk yield curve as measured by the 3m vs 10yr yields. This has one of the best recession indication track records and remains pretty deeply inverted but has become a bit less inverted. The short end, of course, went up once again with the Fed raising overnight bank rates but the longer end picked up a bit more. Could the bond market be coming around to the equity market’s view of ‘no recession’? The old adage is the bond market is much better at sniffing out a recession or no recession, while the stock market keeps the party going longer than it usually should. Right now, there is no denying this stock market is in party mode.
What to do when the most reliable recession indicators continue to flash red danger signals and the more coincidental economic metrics show resilience? That is the question of 2023. The yield curve, Federal Reserve recession probability models, and leading indicators are but a few that are in the red zone. Yet companies are making money, jobs are still decent (albeit less abundant), flights/restaurants are full, and the U.S. market is inching towards its all-time high. What to do, what to do.
The answer is the same as before. Tilt to be mildly more defensive, simply because ignoring all those red flags is not responsible. Mildly defensive enables you to participate in the stock markets party; just think of it as leaning against the wall near the door sipping your Michelob Ultra. You are not the life of the party, but should it end suddenly, you are ready to make a quick exit.
Portfolio positioning
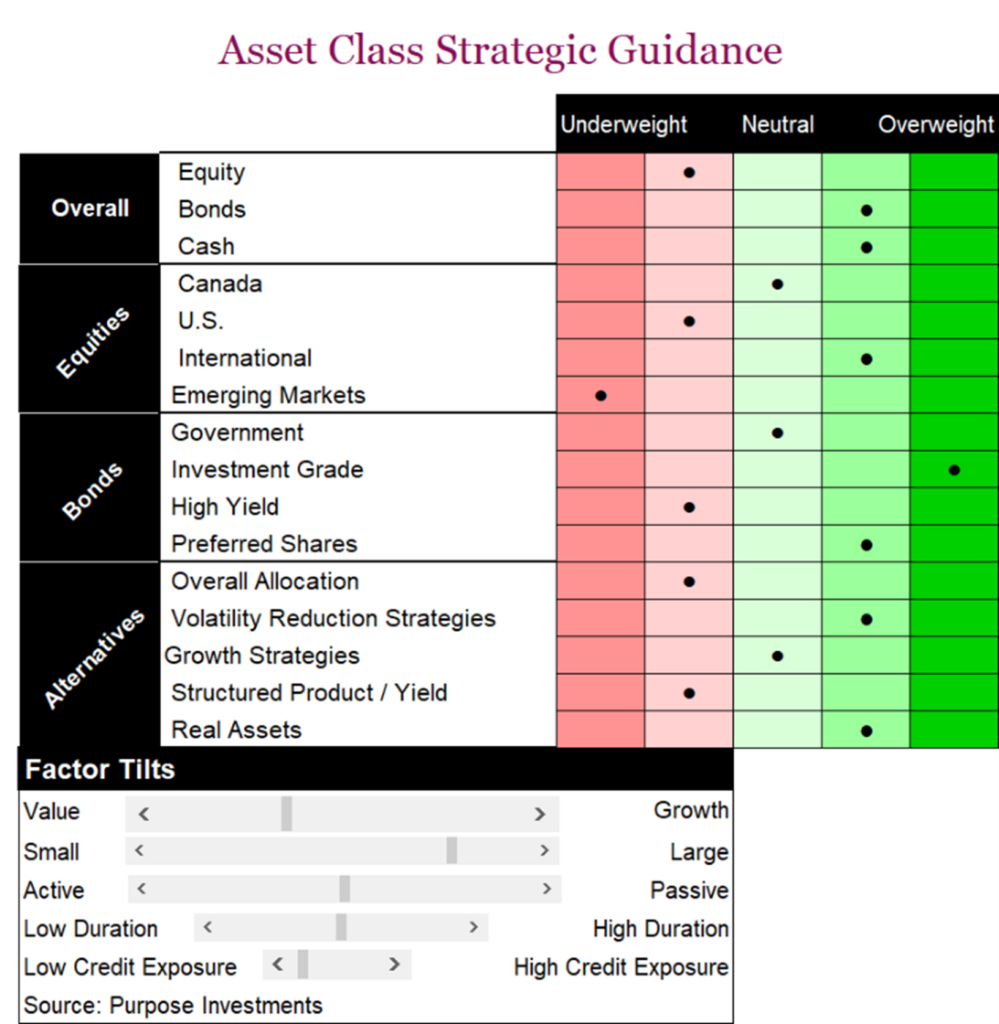
As you have seen above, we have become more positive towards preferred shares. This is included in our bond allocation bucket, which has increased our bond allocation from neutral to mild overweight. Otherwise, no other changes. We remain a bit defensive on equities, a bit heavier bonds and cash. Equity allocations have a more international tilt than neutral, focused on developed markets. Yes, emerging markets are cheap and certainly have some appealing characteristics, but we believe there will be a more timely entry point. Bond allocations are more focused on quality, albeit a little less now with the preferred share increase. Within alternatives, we focused more on real assets and defence.
The final word
Often when a new bull cycle begins, just about everyone doesn’t believe it and remains cautious for quarters and sometimes years. New cycles begin on hope, with the initial rally lacking fundamental improvement, which catches up later. This could be that. But usually, there is a stabilization in the fundamentals, such as earnings or economic indicators. Today these are still gradually deteriorating.
If the new bull cycle has started, time will keep flying by, and it will be Christmas before we know it. That is not our expectation, though, as we believe the divergence between the market and fundamentals will resolve to some sort of corrective action. When? Who knows but certainly more comfortable remaining a bit more defensive, standing near the door.
Sign up here to receive the Market Ethos by email.
Source: Charts are sourced to Bloomberg L.P., Purpose Investments Inc., and Richardson Wealth unless otherwise noted.
*Authors:
Purpose Investments: Craig Basinger, Chief Market Strategist; Derek Benedet, Portfolio Manager
Richardson Wealth: Andrew Innis, Analyst; Phil Kwon, Head of Portfolio Analytics; Mark Letchumanan, Research; An Nguyen, VP Investment Services
Disclaimers
Richardson Wealth Limited
The opinions expressed in this report are the opinions of the author and readers should not assume they reflect the opinions or recommendations of Richardson Wealth Limited or its affiliates. Assumptions, opinions and estimates constitute the author’s judgment as of the date of this material and are subject to change without notice. We do not warrant the completeness or accuracy of this material, and it should not be relied upon as such. Before acting on any recommendation, you should consider whether it is suitable for your particular circumstances and, if necessary, seek professional advice. Past performance is not indicative of future results. The comments contained herein are general in nature and are not intended to be, nor should be construed to be, legal or tax advice to any particular individual. Accordingly, individuals should consult their own legal or tax advisors for advice with respect to the tax consequences to them.
Richardson Wealth is a trademark of James Richardson & Sons, Limited used under license.
Purpose Investments Inc.
Purpose Investments Inc. is a registered securities entity. Commissions, trailing commissions, management fees and expenses all may be associated with investment funds. Please read the prospectus before investing. If the securities are purchased or sold on a stock exchange, you may pay more or receive less than the current net asset value. Investment funds are not guaranteed, their values change frequently and past performance may not be repeated.
Forward Looking Statements
Forward-looking statements are based on current expectations, estimates, forecasts and projections based on beliefs and assumptions made by author. These statements involve risks and uncertainties and are not guarantees of future performance or results and no assurance can be given that these estimates and expectations will prove to have been correct, and actual outcomes and results may differ materially from what is expressed, implied or projected in such forward-looking statements. Assumptions, opinions and estimates constitute the author’s judgment as of the date of this material and are subject to change without notice. Neither Purpose Investments nor Richardson Wealth warrant the completeness or accuracy of this material, and it should not be relied upon as such. Before acting on any recommendation, you should consider whether it is suitable for your particular circumstances and, if necessary, seek professional advice. Past performance is not indicative of future results. These estimates and expectations involve risks and uncertainties and are not guarantees of future performance or results and no assurance can be given that these estimates and expectations will prove to have been correct, and actual outcomes and results may differ materially from what is expressed, implied or projected in such forward-looking statements. Unless required by applicable law, it is not undertaken, and specifically disclaimed, that there is any intention or obligation to update or revise the forward-looking statements, whether as a result of new information, future events or otherwise.
Before acting on any recommendation, you should consider whether it is suitable for your particular circumstances and, if necessary, seek professional advice.
The particulars contained herein were obtained from sources which we believe are reliable, but are not guaranteed by us and may be incomplete. This is not an official publication or research report of either Richardson Wealth or Purpose Investments, and this is not to be used as a solicitation in any jurisdiction.
This document is not for public distribution, is for informational purposes only, and is not being delivered to you in the context of an offering of any securities, nor is it a recommendation or solicitation to buy, hold or sell any security.
Richardson Wealth Limited, Member Canadian Investor Protection Fund.
Richardson Wealth is a trademark of James Richardson & Sons, Limited used under license.