
Investor Strategy
April 2, 2024
The importance of asking ‘why’?
Sign up here to receive the Market Ethos by email.
Executive summary
- Marching on
- Why
- Why moderate underweight equity and holding more cash
- Why we’re warming to emerging markets
- Market Cycle
There was very little to complain about in Q1. Bonds were down a smidge, but really only on the longer end of the curve. Add some credit, or shorter duration and returns were roughly flat or up a bit. Hey, a boring bond market is actually kind of nice given what we have experienced over the past few years. All the real excitement was in the equity markets. The S&P 500 is up over 10%, an impressive feat for a mere quarter. But it wasn’t just America; Europe and Japan both rose even more during the quarter, with Japan making a new all-time high– something not accomplished since its bubble high of 1989. Just to bring back the memories, in 1989 National Lampoon’s Christmas Vacation was the top box office hit … oh the Griswolds. Canada’s TSX was a bit of a laggard, up less than 10%.
With the first quarter of 2024 now in the rearview, this report dives into a couple of portfolio tilts and why we are positioned the way we are. Let’s jump into it.
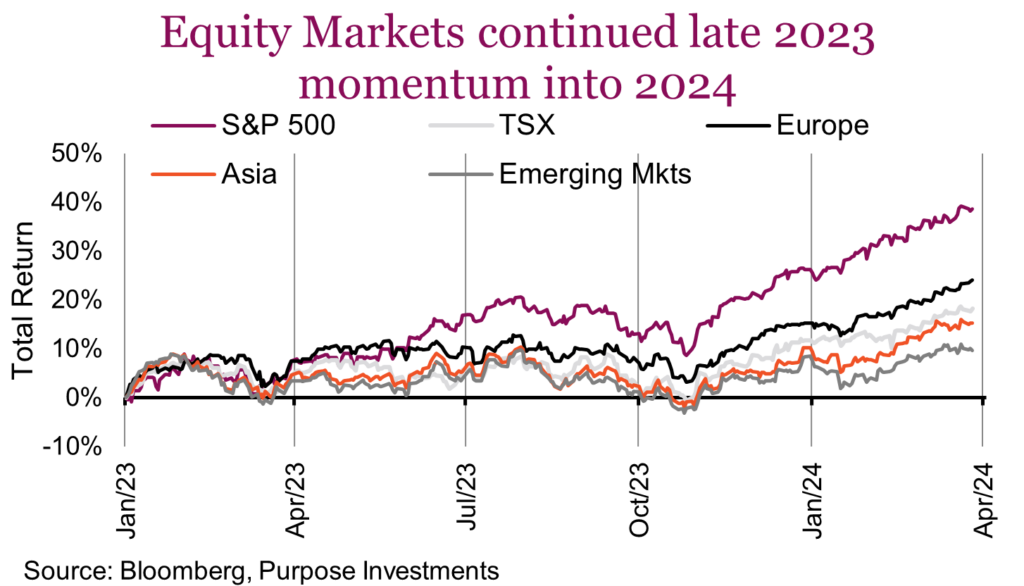
Marching on
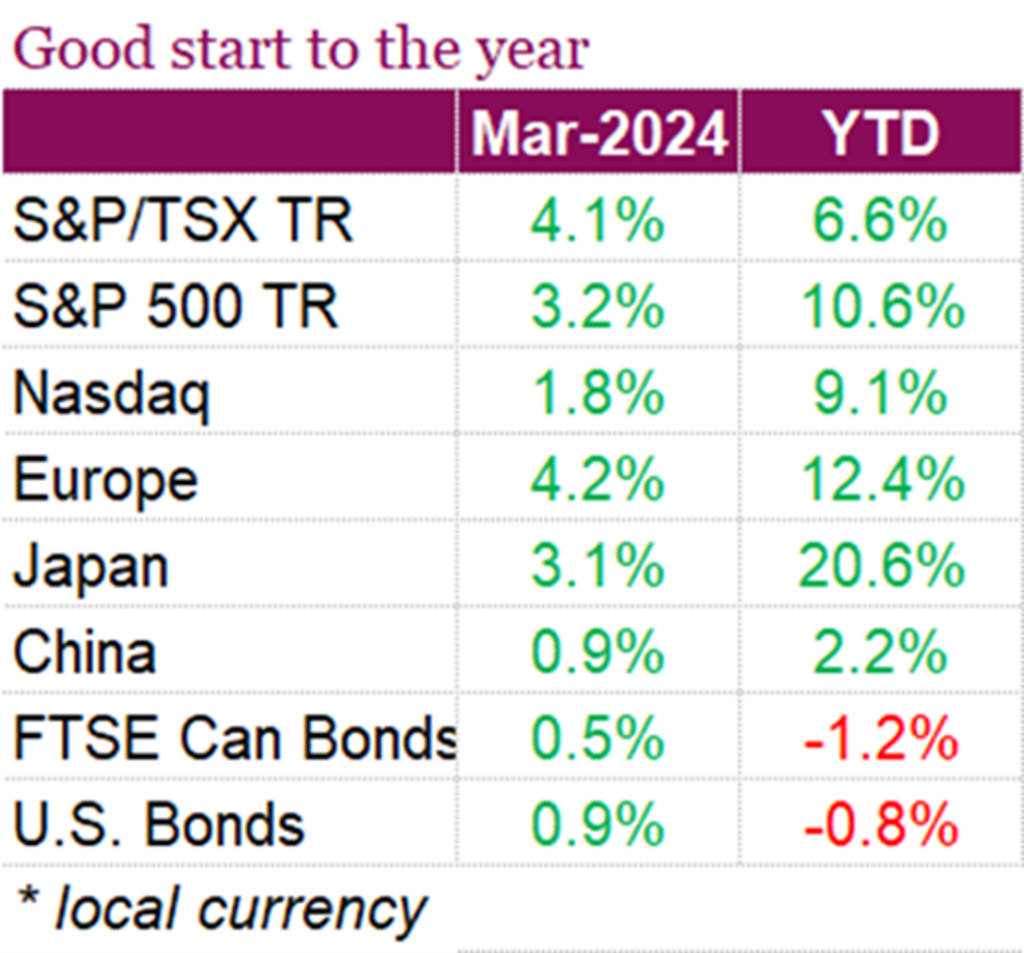
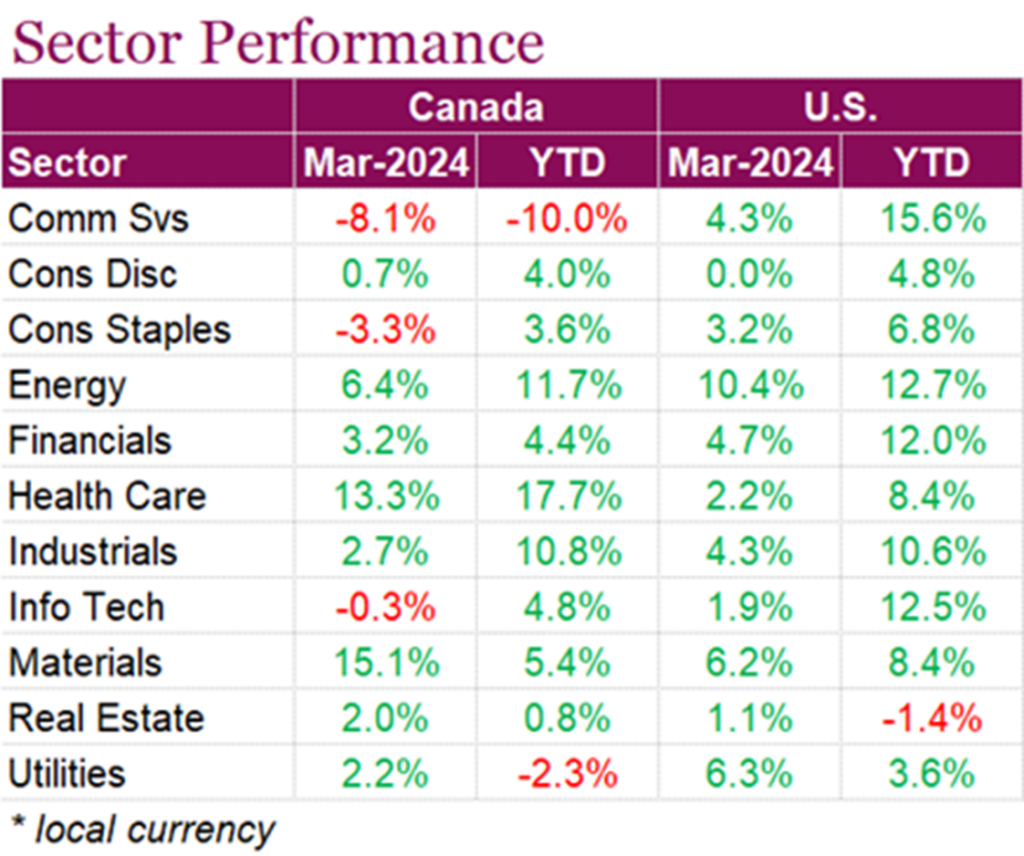
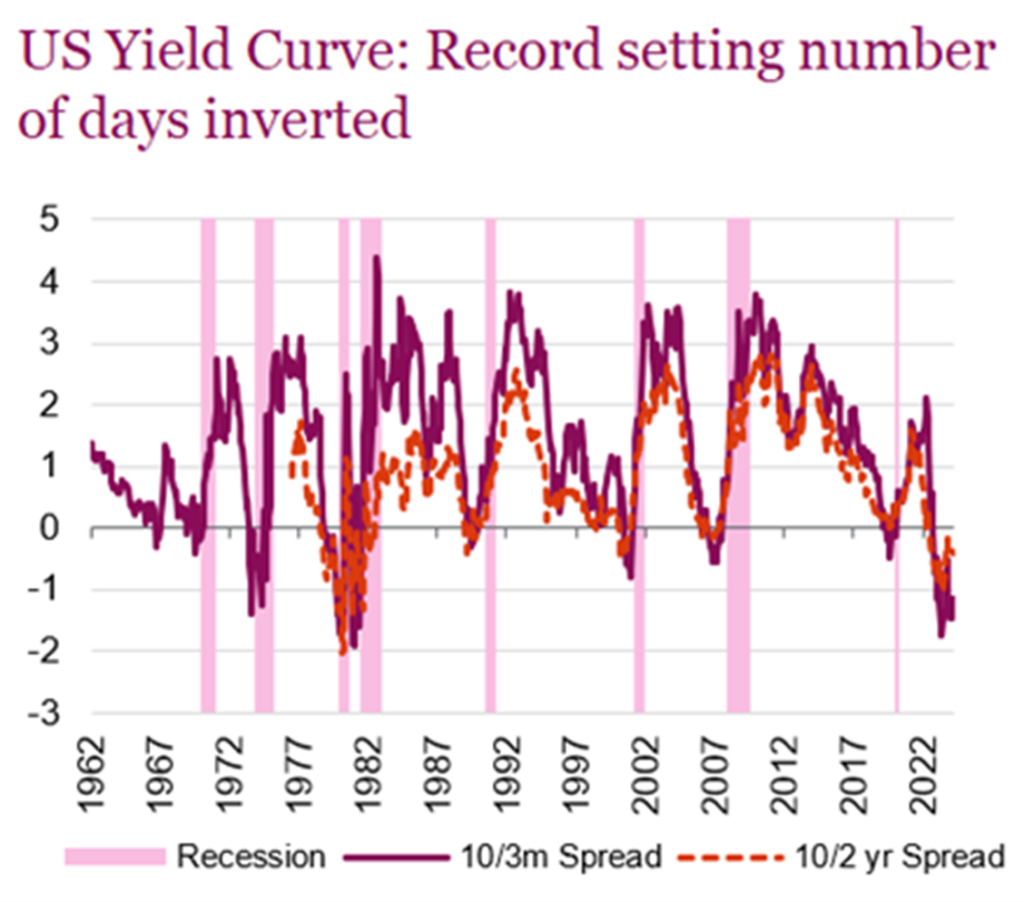
North American equity indices are coming off a winning first quarter, which saw all major averages hit all-time highs. On a total return basis, the S&P 500 jumped 10.6% for its best first-quarter performance since 2019, while the Nasdaq rose 9.3%, and the TSX gained 6.6%. In March alone, the S&P 500 rose 3.2%, helped by ongoing bets on AI and expectations that the Fed will soon begin cutting interest rates. The TSX also saw strong gains, rising 4.1% on a total return basis for the month, helped by financials, energy, and materials. Markets are now expecting central banks to begin cutting rates as early as June, which pushed yields lower during the month and helped the FTSE Canada Universe Bond Index rise 0.49% over the month while the U.S. Aggregate Bond Index rose 0.92%. It was not only equity markets posting records this month, gold and cocoa hit all-time highs as well, and now the U.S. yield curve has reached a record number of days being inverted.
Investors were encouraged by economic data which signaled that central banks may soon be able to cut interest rates. In Canada, inflation data came in lower than expected with CPI (y/y) at 2.8% vs 3.1% forecast, and down from the prior month’s reading of 2.9%, while core inflation also came in below consensus. The latest Canadian GDP print indicated that the economy is showing growth momentum in the first two months of 2024, with preliminary data indicating a 0.4% expansion in February following a 0.6% increase in January. These gains, led by sectors like energy, manufacturing, and financials, exceeded expectations and point to the strongest growth since early 2022. Overall, the numbers suggest an annualized growth rate of 3.5% for the first quarter, significantly outpacing earlier estimates. Overall, the higher-than-expected performance provides support for the BoC’s patient approach to interest rate adjustments, with policymakers awaiting further data to confirm sustained progress towards inflation targets before considering policy changes.
The U.S. economy is continuing to show resilience, with GDP rising at an upwardly revised annualized rate of 3.4% while consumer spending, which makes up two-thirds of GDP, increased at a 3.3% pace. The figures reported both came in higher than previously reported with the U.S. labour market continuing to show its strength. Additionally, gross domestic income surged by 4.8%, marking the most significant increase in two years. It’s not all positive data; inflation continues to be a major headwind for the U.S. economy, with core inflationary pressures coming in hotter than expected in February. Month-over-month CPI rose in February, in line with the consensus forecast, while core prices rose 0.4% m/m, matching January’s gain and coming in slightly above consensus, making it two consecutive months of stronger than expected readings on core inflation. The Fed’s preferred measure of underlying inflation, the core PCE price index, did, however, moderate last month, rising by 0.3% compared to the previous month’s 0.5% increase. Despite this cooling, inflation-adjusted consumer spending exceeded expectations, helped by strong wage growth. The data has led Fed officials to reiterate that the central bank does not feel rushed to cut interest rates, with some economists warning that a rate cut in June may be a little too optimistic.
Even more impressive, the equity market advance is rather broad based. The S&P 500 still has a concentration problem, with the top 10 names representing 33% of the index, levels not experienced outside the dotcom and nifty fifty bubbles. Perhaps even higher concentration today. Some of those megacaps certainly helped drive performance in the first quarter of 2024 including Nvidia, Microsoft, Meta and Amazon. Yet, which companies do you think were the biggest drags on Q1 performance? Apple and Tesla were the biggest detractors – it is almost as if the Mag 7 has been split.
AI remained all the rage in Q1, in fact you would argue the separation of the Mag 7 is sort of based on those companies that appear to have an edge in AI so far compared others. But make no mistake, this market advance was broad based and it was helped by the economic data. The U.S. economy, which had already been proving very resilient continued in a similar fashion. It was more the global economic data front that improved in Q1.
Why
Financial literacy is predicated on asking the question, why? Why does this market keep moving higher, why is inflation fading so slowly, why are home prices high, given low affordability? A stronger financial literacy or understanding likely leads to fewer investing mistakes; nobody likes mistakes. Our weekly publication often attempts to answer questions on various topics, dive into it, explain it, provide some context and share our views on what could happen next. In the past few weeks we have talked IPOs, gold and inflation, hopefully improving our readers financial literacy, and our own in the process of researching and writing.
Sometimes the questions being asked are not macro topics such as the economy or inflation or upcoming elections, but more focused on portfolio construction and positioning. Why are our portfolios overweight Japanese equities, why did we add preferred shares, why is our credit exposure low, why are we moderately underweight U.S. equities? Most are working out well, some not so much. Even with strong financial literacy, mistakes still happen.
With the first quarter of 2024 now in the rearview, this report dives into a couple of portfolio tilts and why we are positioned the way we are. Let’s jump into it.
Why moderate underweight equity and holding more cash
No denying we are a bit more cautiously tilted, even with improving economic data. Our analogy is we are still at the party standing closer to the door – not cutting a groove on the dance floor. We don’t believe this most recent market advance has the foundation to prove resilient.
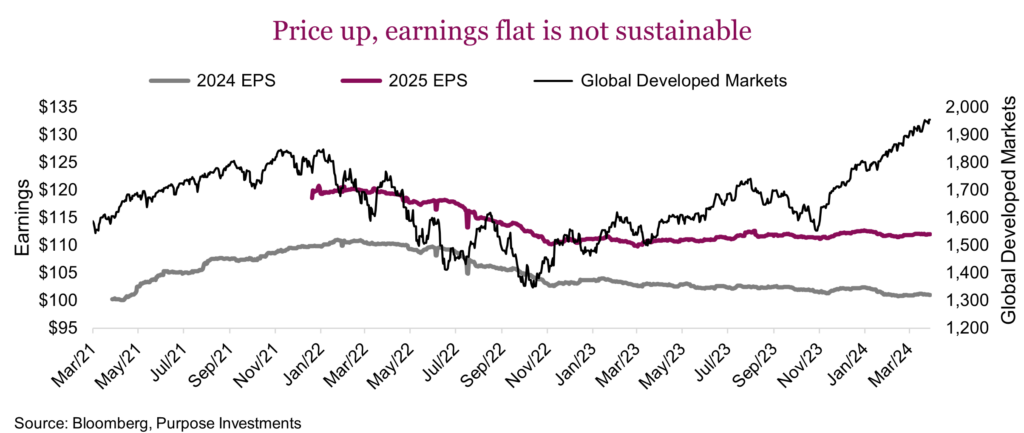
Earnings are a concern. If the economy were truly improving, why has this not translated into earnings forecasts? This chart shows global developed markets and headline consensus earnings estimates for 2024 and 2025. Earnings revisions and the market often move in tandem. Yet over the past year, we have seen markets up and earnings flat, which means this is almost all multiple expansion.
We believe there are a number of headwinds for earnings growth. Higher rates and yields have a delayed impact on company income statements, which is starting to bite. Two years ago, S&P 500 companies paid about $50 billion in interest expenses during the quarter. In the latest quarter that has increased to $70 billion. This will likely continue rising as fixed term debt matures and is refinanced at higher rates.
Wage growth also remains elevated. The Atlanta Fed Wage Growth tracker is running at +5%, that is higher than inflation as a proxy for companies’ ability to raise prices. In fact, if inflation continues to cool, this too will be negative for earnings growth as a sign that the ability to pass through higher costs is hitting some resistance.
Our other near-term concern is liquidity. The Federal Reserve is steadily reducing its balance sheet (quantitative tightening) and bank loan trends have been anemic. This should have resulted in less liquidity in Q1 had it not been for the draining of the reverse repo market. The repo market has fallen from almost $3 trillion to $750 billion over the past year, helping inject liquidity into the market. Now there are many moving parts in these liquidity flows, but safe to say it has been positive for markets over the past couple quarters. The problem is this may start to reverse in Q2 as the repo dwindles, the QT (quantitative tightening) and other negative factors will likely become more impactful.
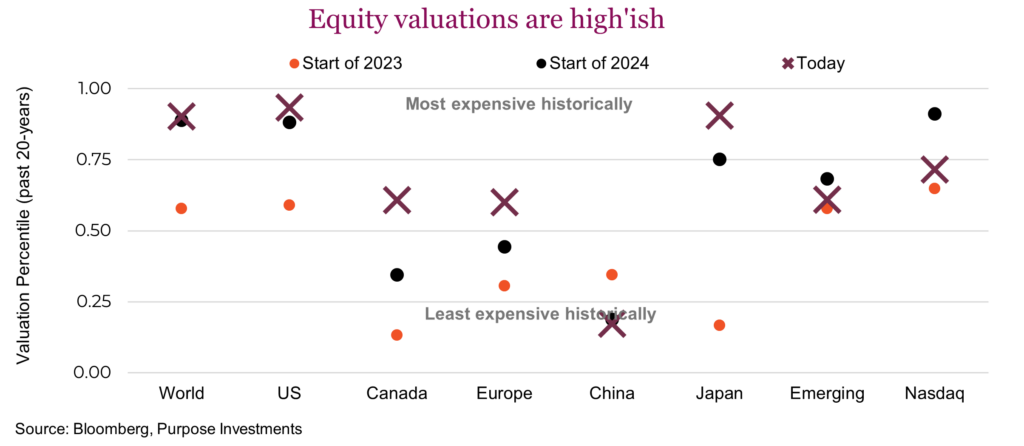
Add to this sentiment that appears extremely bullish (often a contrarian indicator) and very quiet market volatility. Plus valuations everywhere have become rather rich. The rapid rise in prices without earnings growth has pushed valuations higher. Not just in the U.S., even markets that had been on the cheaper side have become less so.
Put all this together, it remains prudent in our opinion to maintain a more conservative asset allocation. That includes holding some extra cash as dry powder should we run into market weakness in Q2.
Why we’re warming to emerging markets
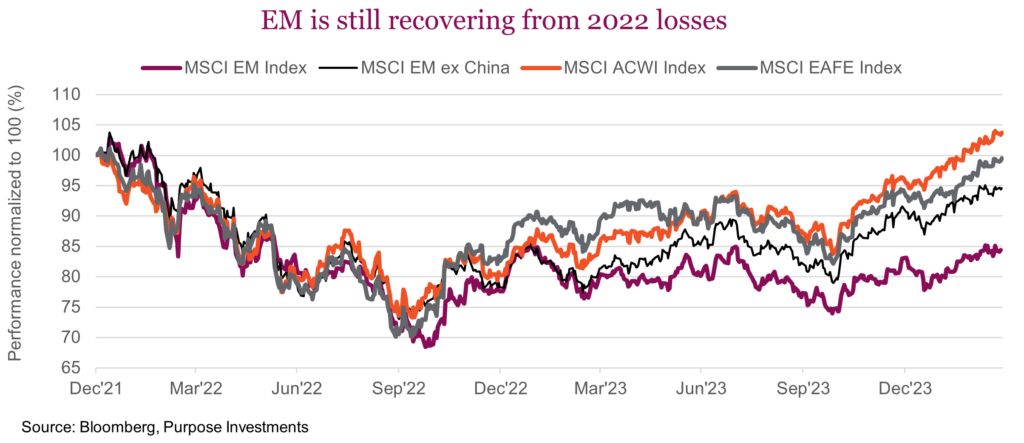
We’ve been underweight emerging markets (EM) for some time. Our reasons were simple: given global growth concerns the risks simply didn’t seem worth the reward. Over the past three years, emerging markets have lost 17%, while the S&P 500 has gained 38%. It gets worse the longer you look back. The performance spread over the past decade is over 200%. Because of this, emerging market equities remain markedly under-owned, while at the same time are becoming attractively valued and perhaps mis-priced.
We continuously evaluate our positions and monitor the data. This monitoring is essential to prevent status-quo bias and remain entrenched in our view. As John Maynard Keynes said, “when the facts change, I change my mind – what do you do, sir?” Well, the facts are beginning to change, and the position is worth a deep re-evaluation to consider increasing exposure to emerging markets. While the past decade saw lacklustre performance in EM compared to developed markets (DM), several factors suggest a potential reversal is nearing.
Reasons for optimism
Central bank pivot: After a period of tightening liquidity, central banks in developed economies are nearing an inflection point, potentially shifting towards rate cuts in mid-2024. This shift from monetary tightening to easing typically benefits emerging markets. It can help stimulate global growth and with inflation falling financial markets are stabilizing. In addition, many emerging markets have already begun their easing cycles as inflation measures across emerging markets continue to trend lower thanks to lower commodity prices, support from currency appreciation and tighter monetary policy.
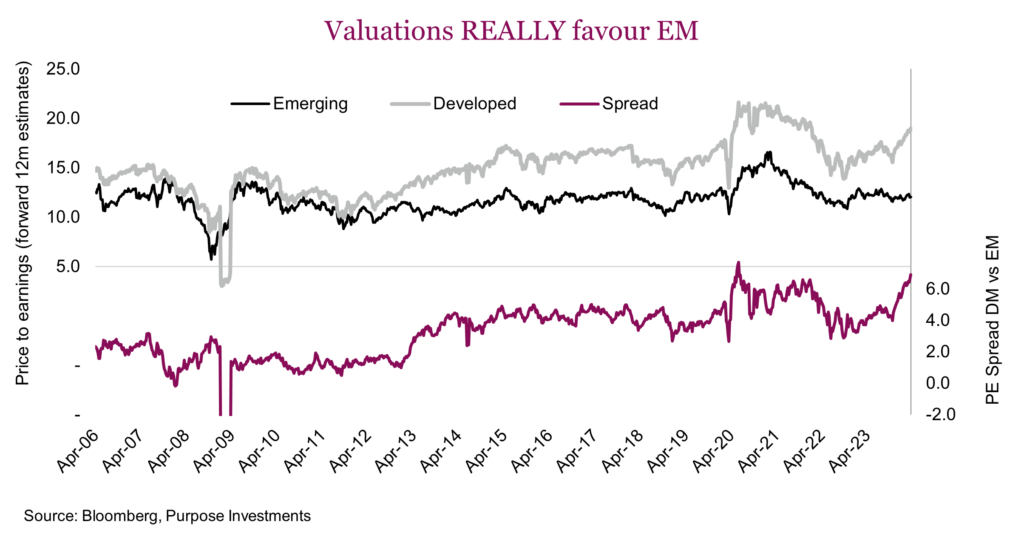
Undervaluation: Valuations in emerging markets are currently at a significant discount compared to developed markets. The valuation gap recently reached a 6-point spread, historically a good indicator of future outperformance for EM.
Earnings growth: Emerging market companies are expected to see higher earnings growth compared to developed markets in the coming years. While this hasn’t translated to price performance yet, it suggests potential for future appreciation.
Recovering global trade: Global trade growth, which has been sluggish, is starting to show signs of improvement, particularly in export-driven economies like Korea and Taiwan. This trend is positive for emerging markets that are heavily reliant on trade. We expect the positive trend in global economic momentum to continue, although top-line U.S. GDP growth will likely moderate from its recent very strong pace. Global PMI continues to show signs of stabilization and is on the cusp of re-entering growth once again. The key factor for capital markets will be the improving breadth of global growth, encompassing not only the three major economies of the U.S., euro area and China, but also the bulk of the emerging economies as global trade recovers.
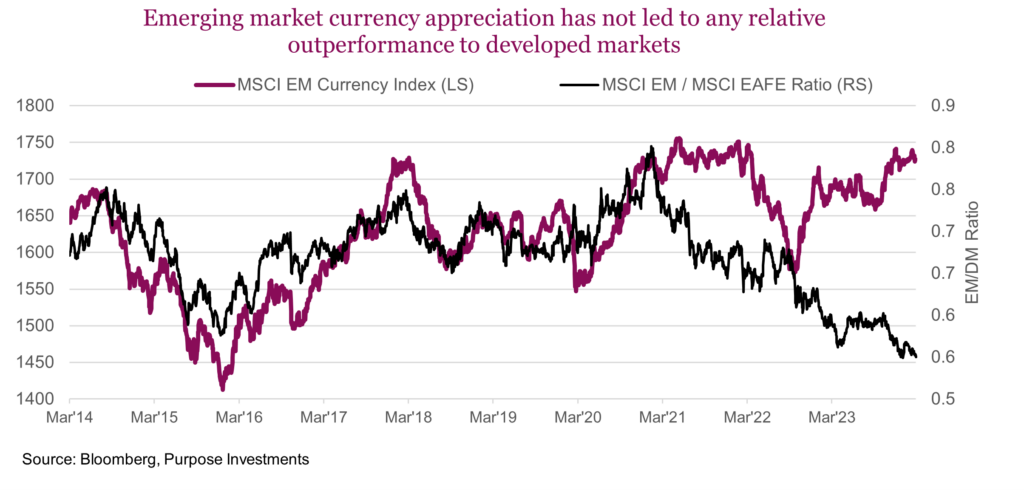
Currency appreciation: Local currency debt should get an added boost from EM currency appreciation this year. The MSCI Emerging Market Currency Index sets the weights of each currency equal to the relevant country weight in the MSCI EM Index. It’s seen considerable appreciation recently, which historically coincides with EM outperformance, but this has not been the case recently.
No question, emerging markets have experienced considerable challenges recently. But the key question is whether EMs offer better growth prospects than DMs? Big questions surrounding the direction and magnitude of global growth remain, especially with technical recession in key developed countries. By contrast, EMs offer have shown considerable resilience weathering higher borrowing costs, strong USD, inflation and worsening trade conditions.
China, the shrinking elephant in the room
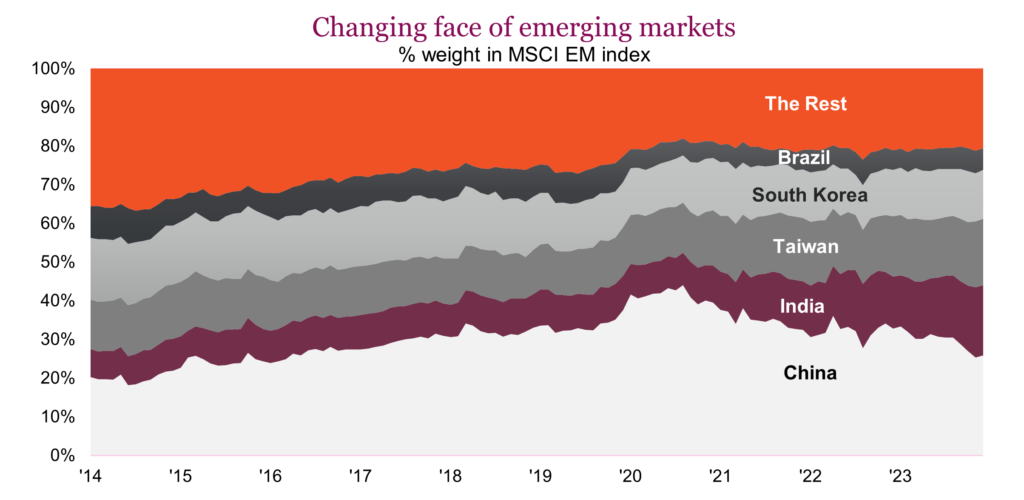
From a granular standpoint, many emerging markets have done quite well, including India, Taiwan and Brazil but the index has been held down by China. It’s impossible to hide the elephant in the room when considering emerging market exposure. Within the MSCI EM Index, China represents 26% of the index, including Hong Kong, with a considerable amount of direct exposure. Indirectly it also carries significant influence due to its influence in Asia and its impact on global commodity markets. Back in 2020, China peaked at nearly 44% of the index; its weight has shrunken considerably since then. Conversely, India is now up to 18%; ten years ago it was just 7.2%. If these trends continue, India could overtake China in the EM index. This is noteworthy considering India overtook China in terms of population a year ago.
So, what could turn China around? Unlike the U.S., Europe and Canada changes in China’s economic policy tend to not be communicated prior to implementation. Within Asia, Japan and Indian markets are flying, but China is the exception. Its stock market is among the weakest and the economy remains under pressure.
Coming out of Covid, the market expected a big rebound from China that never materialized due to the imploding property market, along with the crackdown on big tech. Most of the recent pressure began when the government tried to crack down on the buildup of leverage in the housing industry. The result starved developers of capital and the reverberations continue to be felt today. Though recent announcements have tried to stimulate the economy, it’s been more of a few warning shots compared to the bazooka credit impulse we’ve seen previously from China. Simply put, government efforts to reignite the growth engine have been insufficient, and a country which increasingly relies on the consumer still has very low consumer confidence.
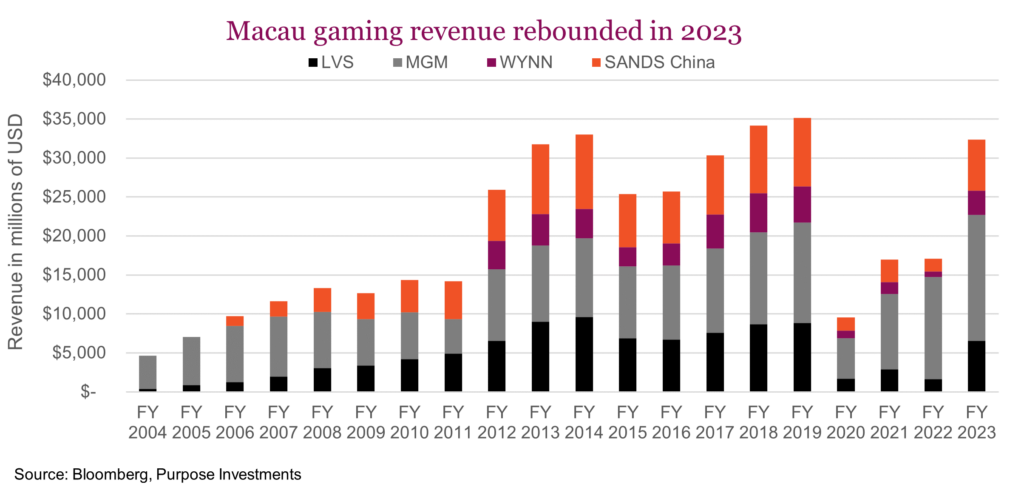
But this is beginning to change. While the Chinese consumer may not be buying Chanel handbags or iPhones at quite the same pace, gaming revenues in Macau have rebounded nearly to 2019 levels. This is a positive development. Good spending may still be hampered, but experiential spending is healthy. Chinese air travel had already recovered and will likely extend its growth in 2024.
Chinese growth will lag peers like India. However, it’s very cheap, approaching near historic multiple spread to developed markets and stands to potential rapidly benefit from any shift in government policy or inflection point in consumer spending. In addition, bearishness around Chinese equities may have reached a local peak. While far from uninvestable, the climate remains challenged, especially with the prospect of Trump returning to the Oval Office. Investors have tempered pessimism on China recently. Over the past couple of months, Chinese equites have matched the S&P 500. This is a good first step, but a full-on bullish tilt remains a bold contrarian call. Buy, like all contrarian calls, it can pay off generously to get in before the rest of the crowd.
Portfolio thoughts
Overall, we believe the potential benefits of emerging markets are beginning to outweigh the risks. The combination of attractive valuations, improving economic fundamentals, and a potential shift in global monetary policy creates a compelling opportunity for investors seeking long-term growth.
We think there is promise for China and believe it presents one of the few contrarian opportunities in global markets right now, for some it is simply uninvestable. If this is the case, there are EM ex China funds that would also be attractive. India, Tiawan and South Korea combine for 64% of this index but are all positioned favourably to benefit from strengthening economic prospects.
Market Cycle
The improved economic data has been picked up in our Market Cycle framework, potentially alleviating broader near-term recession risk. The Market Cycle is comprised of over 40 indicators, all of which have historically had some efficacy on showing turning points in the economic cycle. Some signals are from the bond market, U.S. or global economic data, some from sentiment, fundamentals, etc. The view is nothing works in every cycle, so we have a diversified approach with many signals.
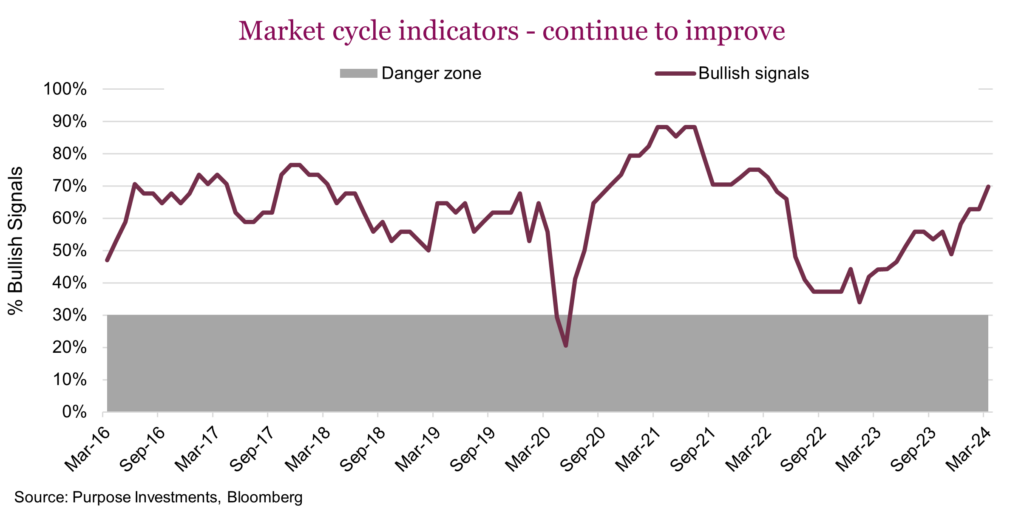
Equally important as the total bullish signal trend is what is happening underneath. It has been a big improvement from indicators associated with the global economy that has led the more recent improvement in signals. Global manufacturing surveys, copper prices, semiconductor price trends, commodities and emerging market price behaviour are all bullish now. These were all bearish six months ago.
This doesn’t mean the market will keep going up. The Market Cycle is not a market timing tool, it is more an indicator of recession risk. If it’s healthy during a period of market weakness, safer to view that as a buying opportunity. Now we just need some market weakness.