
Investor Strategy
5 May 2026
V is for victory, for now
Sign up here to receive the Investor Strategy by email.
- No April showers
- Recovery shapes: W’s to V’s
- The P word is price, not politics
- America strikes back
- Market cycle & portfolio positioning.
- Final note
No April showers
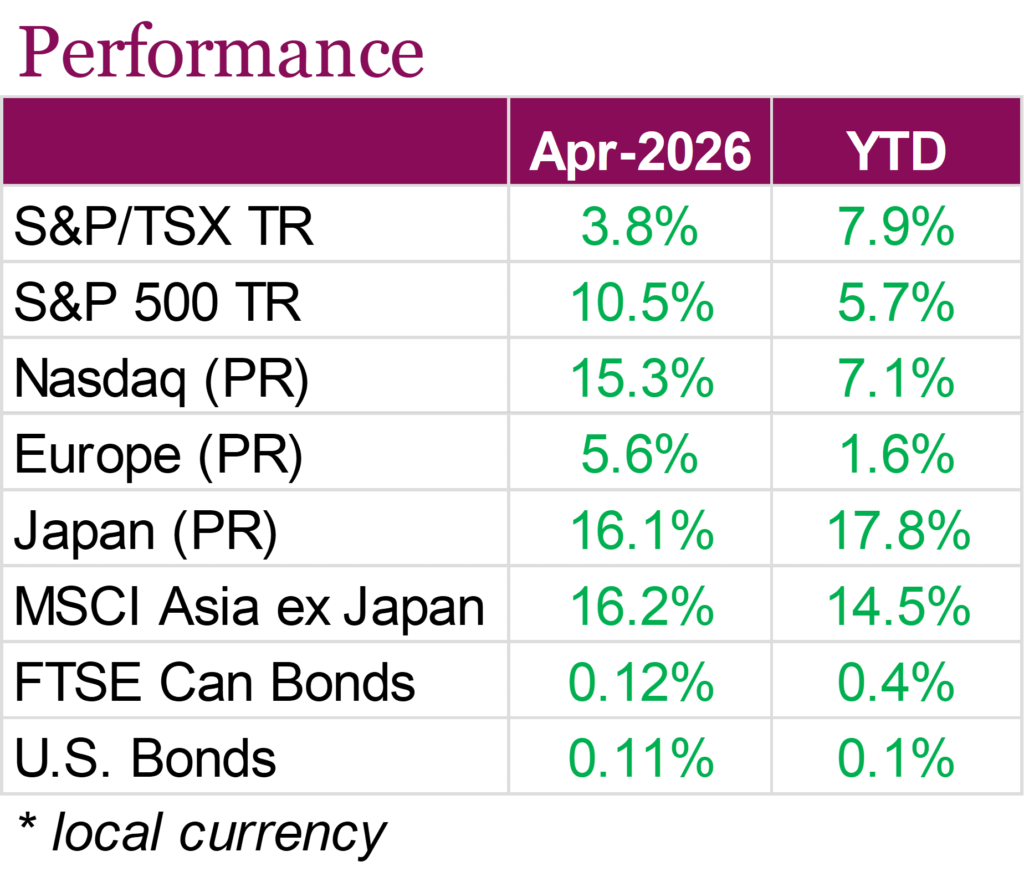
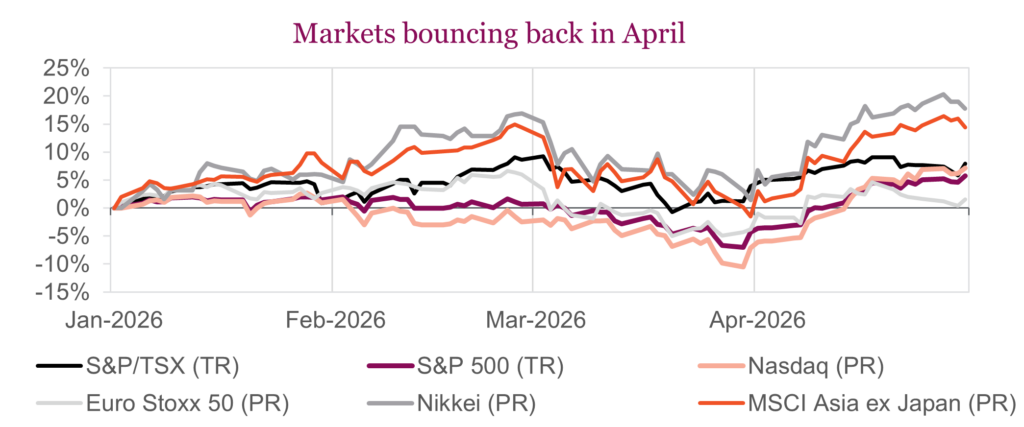
Equity markets staged an impressive recovery in April, with stocks rallying as resilient economic data, strong corporate earnings, and easing geopolitical tensions helped restore investor confidence. The S&P 500 saw its best monthly return since 2020, rising +10.5% during the month on a total return basis, bringing year-to-date gains to +5.7%. The Nasdaq posted an even stronger rebound as AI-driven mega-cap tech names led markets higher, with the index rising +15.3% during the month. More on this buy-the-dip V-shaped correction later in this report. Canadian equities saw more modest gains, with the TSX rising +3.8% on a total return basis, helped by strength in financials. Still, the TSX is beating its U.S. counterparts year-to-date, with the index now up +7.9%.
Investor sentiment improved following the U.S.-Iran ceasefire, although the continued disruption of the Strait of Hormuz kept global oil prices elevated and inflation concerns in focus. Despite softer pockets of economic data, stronger-than-expected Q1 GDP growth in both the U.S. and Canada, as well as solid corporate earnings in the U.S., reinforced the view that North American economies remain more resilient than anticipated. S&P 500 earnings growth is tracking near 19% year-over-year, with profit margins reaching their highest level in over a decade, helping justify elevated valuations despite concerns surrounding aggressive AI-related capital spending.
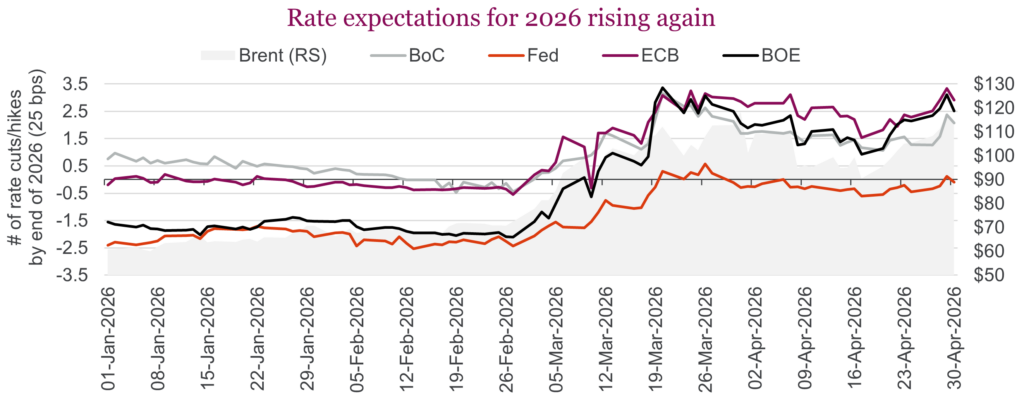
At the same time, central banks, including the Fed, Bank of Canada, ECB, and Bank of England, held rates steady but collectively shifted toward a more hawkish tone as persistent energy inflation and geopolitical uncertainty complicated the path forward. Inflation fears crept back into the market at the end of the month and rate expectations for 2026 are rising again as peace talks between U.S. and Iran remain deadlocked. Bond markets reflected these concerns, with government yields drifting higher throughout April, limiting gains for fixed income investors. U.S. Aggregate Bonds rose just +0.11% for the month, while Canadian Aggregate Bonds gained +0.12%.
While April delivered an impressive rebound for global equities, markets remain cautious as major risks remain unresolved. The Iran conflict has yet to reach a lasting resolution, keeping energy prices elevated and creating significant upside inflation risk. At the same time, massive capital expenditures tied to AI continue to fuel market enthusiasm, but questions remain over whether this spending will ultimately generate returns sufficient to justify valuations. While April’s strength was a breath of fresh air for many investors, the combination of geopolitical uncertainty, stretched valuations, and a more fragile macroeconomic backdrop remains front on mind.
Recovery shapes: W’s to V’s
Pavlovian conditioning, discovered by giving dogs lots of treats, is a behavioural learning process in which an event is paired with an automatic response. Ring the bell, give a treat, ring the bell, give a treat. After a few repetitions, you can ring the bell and the dog salivates in anticipation of the coming treat. It would seem investors have been similarly conditioned: experience some market weakness and begin salivating to buy the dip — with the treat, in this case, being a market that quickly bounces back up.
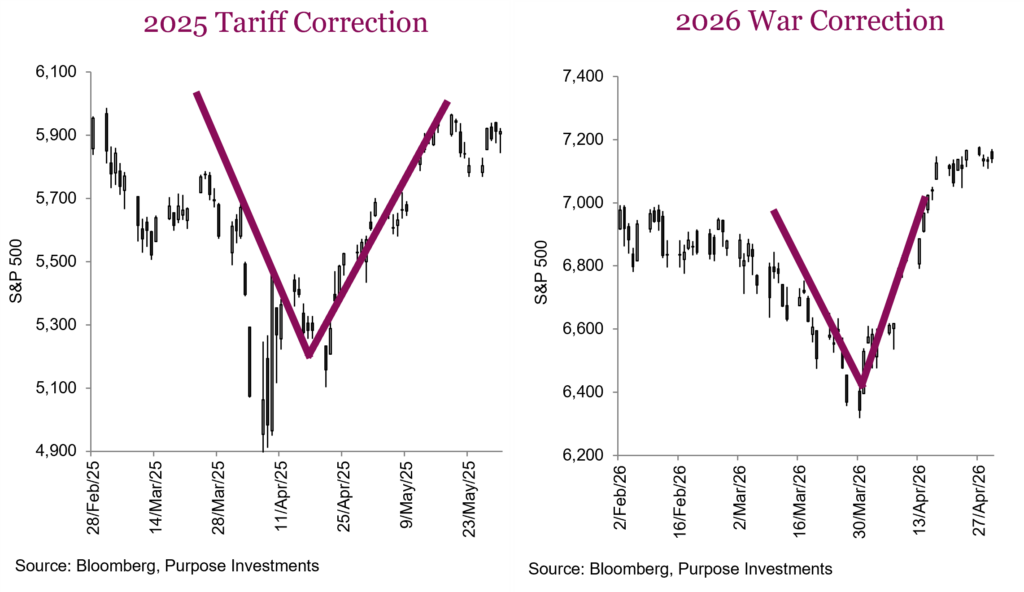
In fact, since late 2018, almost all periods of market weakness took on a V-shaped recovery. Sure, some were deeper than others and the duration varies, but four of the five corrections were V’s. And if you include more minor pullbacks in the 5-10% drawdown range, the frequency is even higher. This wasn’t always the case. Before 2018, W’s were the rule. A period of market weakness almost always experienced a retest of lows, commonly referred to as a double bottom. We looked all the way back over 70+ years, and about 90% of corrections experienced patterns more closely looking like a W, with very few V’s.
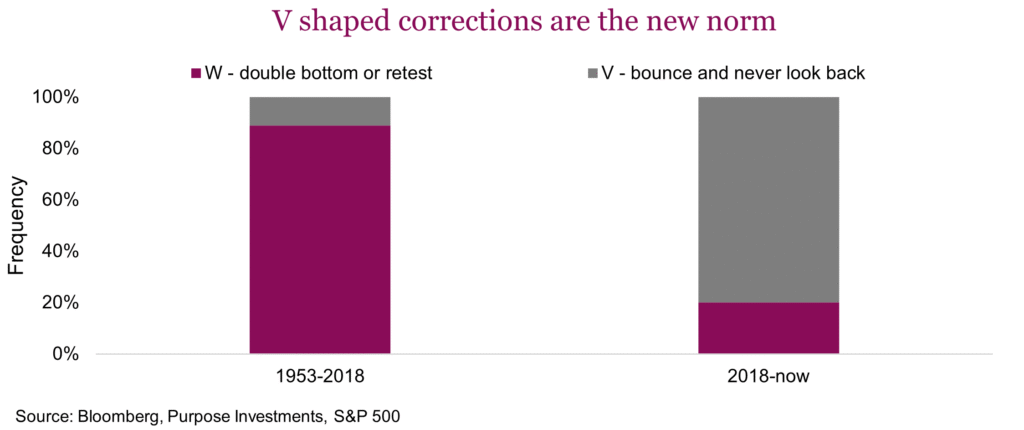
It does bring back some memories of the Covid-induced correction — that was a biggie. And once the V had started its recovery leg, so many strategists were out saying ‘there is always a double bottom or retest of lows’. Those folks would still be waiting. Fast forward to the last couple corrections, and the V appears in full force. Look at both the tariff- induced correction and the market response to the war with Iran.
The markets are always evolving. The technology changes, the underlying companies change, investor behaviours change, investment objectives change and risk appetite certainly changes. We are not saying all future corrections will be more V-shaped, as they can change back as well. However, as we understand it, this bull run, with a few brief interruptions from a few economic growth scares (not recessions, just slowdowns), a pandemic and yields normalizing, has been generally up and to the right on any price chart. This has created a market ethos that has greater ‘fear of missing out’ versus ‘fear of losing money’.
At some point we will experience a real bear market that lasts longer than a couple of months. Best guess it would be associated with a recession but there could be other root causes. A real bear is probably required to rebalance investor fears. Until then, just keep buying the dip.
The P word is price, not politics
So far this year, politics in some shape or form have dominated headlines and the tape. From tariffs to presidential abductions to outright wars, there has been no shortage of geopolitical uncertainty. Obviously, the U.S.-Iran ceasefire remains still the most immediate risk as the Strait of Hormuz is blocked. Despite all the doom and gloom of this bottleneck in the global trade machine, markets have rallied to all-time highs with the S&P 500 just posting its best month since 2020. Momentum remains the dominant factor and one of the pillars behind most bullish outlooks is the increasingly consensus opinion that Trump and the U.S. administration can just shift gears out of war and focus on the mid-terms, juicing the economy and markets to sway the vote. After all, elections are a popularity contest, and record highs are good for incumbents, and nothing is less popular than high gas and food prices. Politics matter to a degree, but they matter less than you would think. The real story worth paying attention to is price, not politics.
The political landscape
While Canada has seen its fair share of headlines, most notably around the new majority government, we’ll be focusing on U.S. politics as they simply matter more for markets. Within the Federal Reserve, the path looks largely cleared for Kevin Warsh to take the Fed chair. His testimony to the Senate Banking Committee last week was largely unexciting, making sure to hit key talking points surrounding Fed independence — mandatory lip service that was music to the market’s ears. Powell, for his part, made ripples at what was likely his final press conference as chair, noting he would stay on as a Fed governor and keep a “low profile.” An unprecedented move that may prove a quiet thorn for the current administration. Market reaction has been muted; in fact, all those expected rate cuts that were on the table just a few months ago are essentially gone.
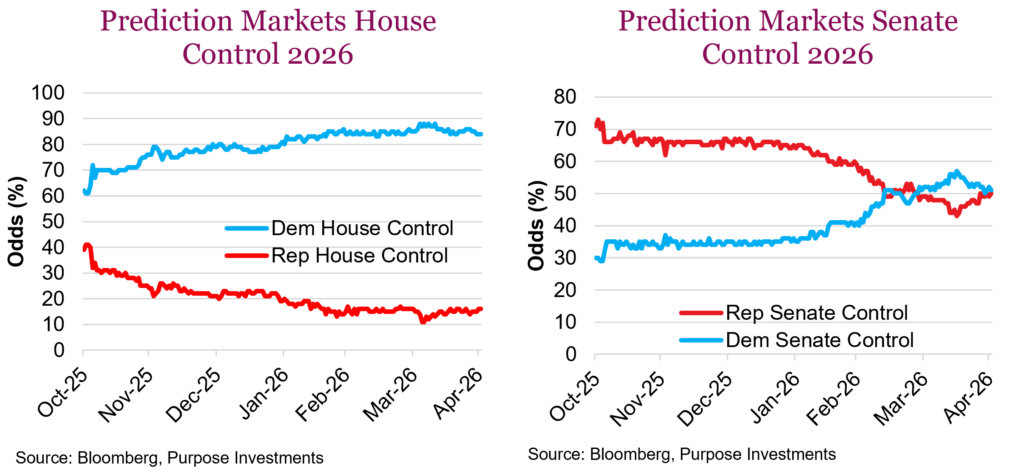
On the midterms themselves, polls and prediction markets all broadly expect Democrats to gain control of the House. U.S. midterm elections arrive November 3, 2026, and if history is a reliable guide, the sitting President’s party typically sheds around 15 House seats and a seat or two in the Senate. That pattern points to Democrats reclaiming the House, but the real race worth watching is the Senate. Polling suggest Republicans look positioned to hold control, potentially at a razor-thin split, though prediction markets have it nearly 50/50 as seen in the chart above. For markets, this is potentially a positive, as markets tend to do well in divided governments. Division means stability, something that has been somewhat absent recently.
Midterm seasonality
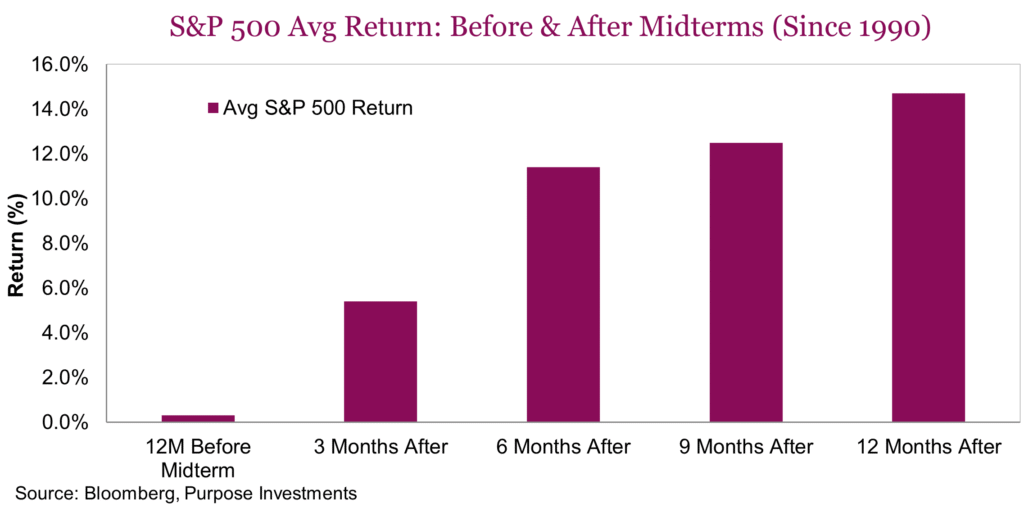
From a historical perspective, returns in the twelve months heading into midterms are typically very soft. Going back to 1990, the average is basically flat. Midterm seasonality is especially soft over the summer, with Q2 and Q3 often posting negative returns before a Q4 rally. Midterm years also tend to carry higher volatility and below-average full-year returns, which is one reason we question the near-universal consensus that the administration will pivot quickly from geopolitics to focus on the midterms and that this alone will be a tailwind for equities. Once the election passes, however, the setup improves considerably. Since 1990, as the chart below shows, the S&P 500 has posted very strong returns in the 3, 6, 9, and 12 months after midterm election day. Incredibly, all 19 midterm cycles since 1950 have produced positive returns at the 6, 9, and 12-month marks.
Now to price: Earnings and valuations
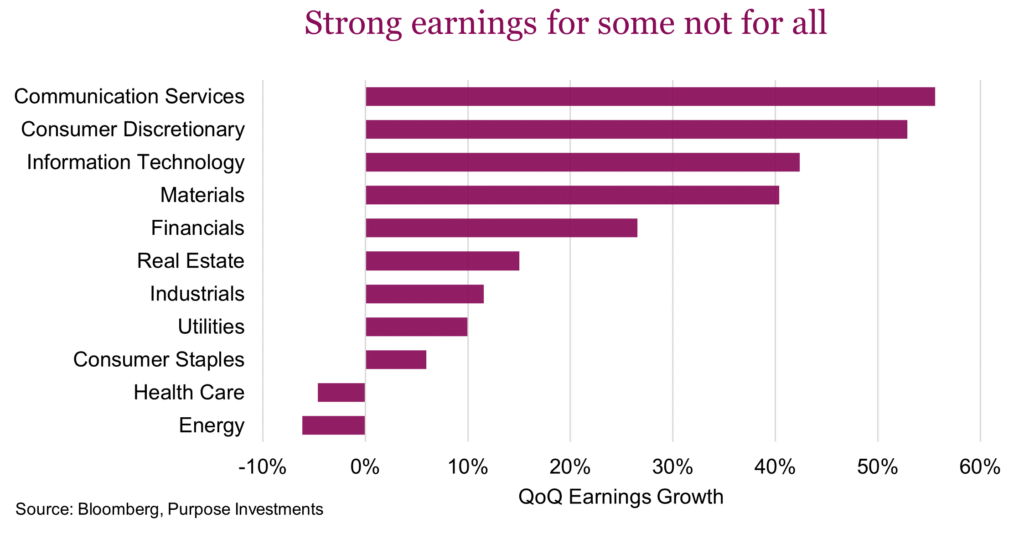
With 63% of S&P 500 companies having reported, earnings season has been going swimmingly. To date, 81% of reporting companies have beaten EPS estimates, above the 5-year average of 78%, and the magnitude of the surprise is impressive at 20% above consensus. Year-over-year earnings growth is particularly strong for a market already pushing new highs rather than recovering from a cyclical trough. Valuations have climbed back to ~21x blended forward earnings. Not quite at the highs of this recent run, thanks to the strong earnings growth, but certainly not cheap.
On the surface, all of this looks very impressive. Dig deeper and the same concentration themes emerge. Technology is the dominant driver, with sector earnings growth of roughly 43%, thanks largely to semiconductors. Discretionary is very strong thanks to Amazon, and communication services also stands out with aggregate earnings growth of 55%. Other pockets are also posting good results, namely energy. Nearly all of the earnings expansion for the index is coming from mega-cap tech names, with many other sectors showing just modest growth or outright declines, like health care. A rather dramatic headline this week captured it well: “80 Seconds of Big Tech Earnings Will Decide the Stock Market’s Fate.” That speaks volumes about our market concentration concern.
While politics make great attention-grabbing headlines, they are largely a distraction for portfolio construction. It should not drive core investment decisions, and trying to time the market around elections and expected outcomes is a risky gamble. Even with a crystal ball on outcomes, predicting the market’s reaction is a separate bet entirely. Stocks often price in expectations well beforehand, then move on surprises. Volatility is normal heading into election season, but this is just noise as markets quickly look past election results to refocus on earnings and growth. This doesn’t just apply to elections but also market moving geopolitical events. Returns in April are a perfect case in point.
With the S&P 500 sitting near 7,200, comfortably back at all-time highs, it’s beginning to look like it’s close to being priced to perfection. Earnings have been strong, but narrow, and a sense of euphoric contentment has set in. In the coming months expect much more political noise, but it’s important to try to ignore the headlines and keep the focus on what really matters. History rewards those who tune out the noise and focus on valuations, earnings, and time in the market. These are the real drivers of long-term wealth creation far more than which colour tie is worn in Congress or even the Oval Office.
America strikes back
The mighty U.S. equity market has been underperforming other international equity markets since the beginning of 2025. Europe, Asia, emerging markets and the TSX all have returned about 25-30% during this period, while the U.S. S&P 500 managed only 13% (all in CAD). This relative performance is at odds with much of the past 15 years, which saw the U.S. dominate the performance tables from 2009-2021. Since then, leadership has flipped a few times. But since the outbreak of hostilities at the start of March, American markets struck back. The S&P rose about +5% during this period, down at first then a strong rebound. Europe (-3%), Asia (-1%), emerging markets (0%) and Canada (-1%) all fell farther at first and rebounded less than America.
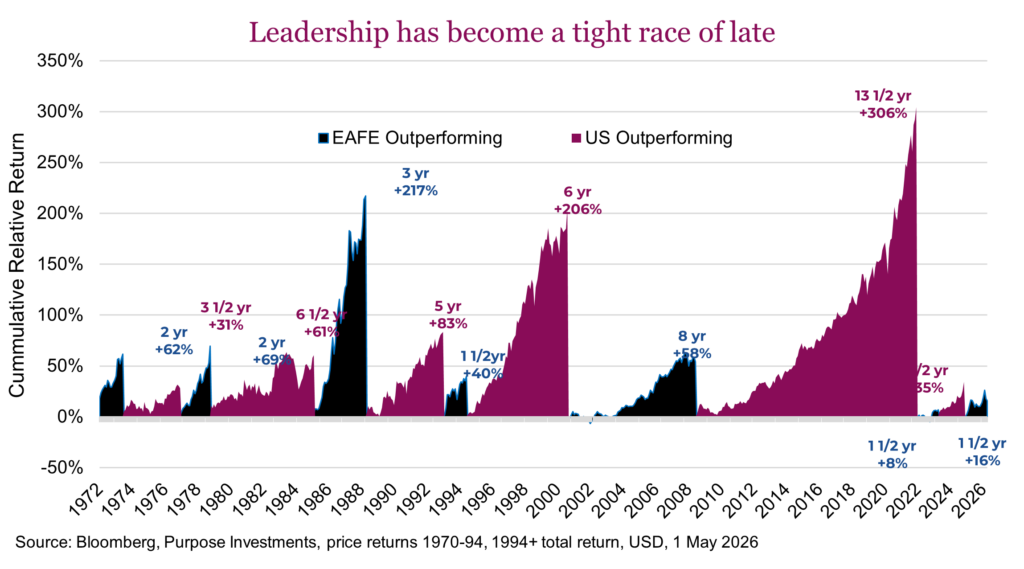
So, could this brief episode of international outperformance be kaput already? Given our positive disposition to international equities and emerging markets (EM), this is a rather important question. But we don’t dislike the U.S., we are just more neutral or equal weight. There is no question, valuations continue to support international/EM over U.S. The valuation spread did narrow into the end of March a little but has since expanded back out to almost 7 multiple point premium for the U.S. equity markets over global ex-U.S.
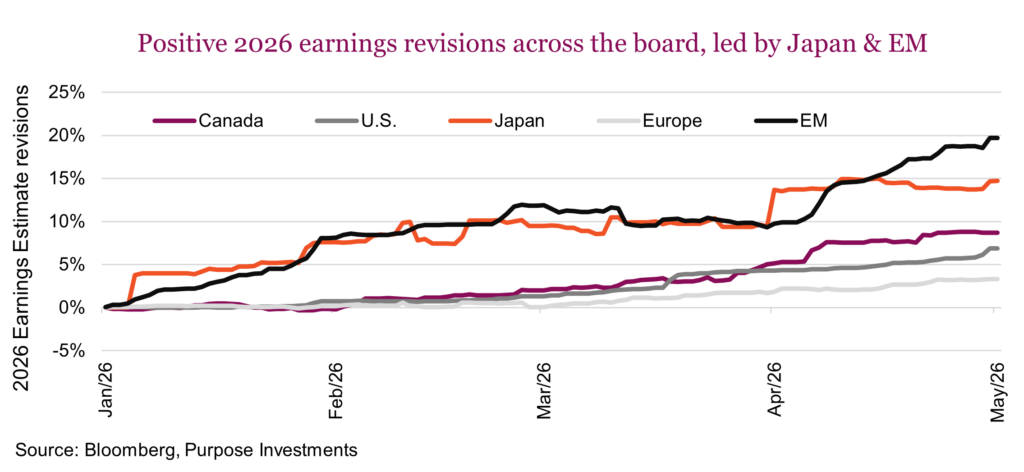
With valuations favouring international, what about the trajectory of those earnings? Earnings growth is a bit mixed, with the U.S. and Canada enjoying the strong gains based on 2026 estimates, currently at a healthy +20% vs 2025 earnings. That is better than Europe and Asia, which current estimates have earnings growing closer to +10%. EM earnings are exploding, +40%. Revisions matter too, as we are seeing positive revisions across the globe but certainly led by Japan and EM.
We are not negative on U.S. equities. Earnings growth for the S&P is good, manufacturing in America is going strong, housing is a bit weak but overall pretty decent foundation. The big determinant will be AI and the hyper scalers, which pretty much all call America home. Of course this could cut both ways from here.
International does have a lot of AI exposure, just not through hyper scalers. Japan and emerging markets contain healthy exposure to technology, more so on the hardware side. Increased spending on data centers is certainly a good tailwind for Japan and EM.
And then there is the current blockade on the Strait of Hormuz. This is more disruptive to international equity markets given their energy dynamics and higher sensitivity to global trade. Continued blockage is positive for the U.S. equity market on a relative basis, any progress in unblocking is better for international equities on a relative basis. We don’t know how this all works out or the timeline, but we remain optimistic more progress will be made which should provide a tailwind for international.
Market cycle & portfolio positioning
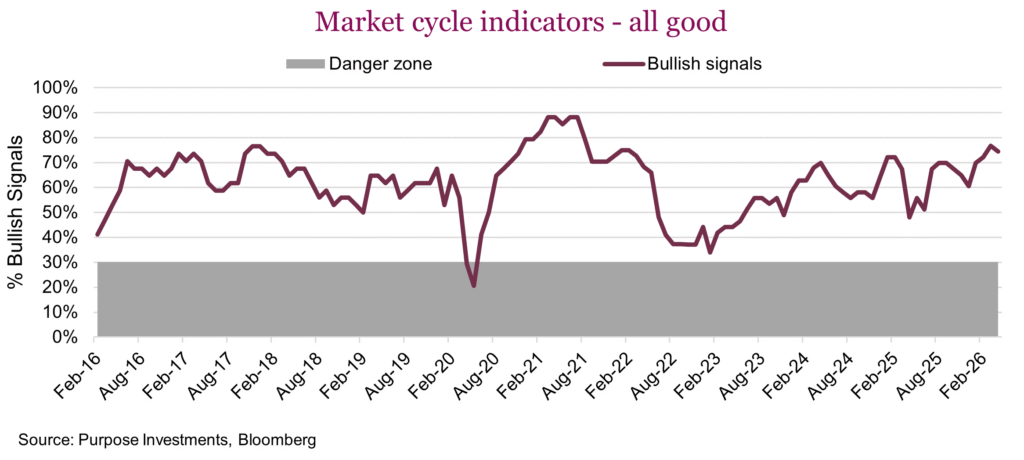
Market cycle indicators continue to look healthy, more evidence that the recession risk is pretty low. Rates are stable and positively sloped, so no change there. The U.S. economy has a few mixed signals with consumer sentiment weak and leading indicators still negative. Since the start of 2022, there have only been four months, out of 51 total months with a positive monthly change in the U.S. Leading Economic Indicators. During that time there was no recession, which does raise the question: are they ‘Leading Economic Indicators’ or not? Perhaps that will be in a future report.
More impactfully, manufacturing data remains very strong for the U.S., while housing is weak. As these are two of the more cyclical and larger components of the U.S. economy, if they both turn down that would have us worried. Currently, one good, one bad.
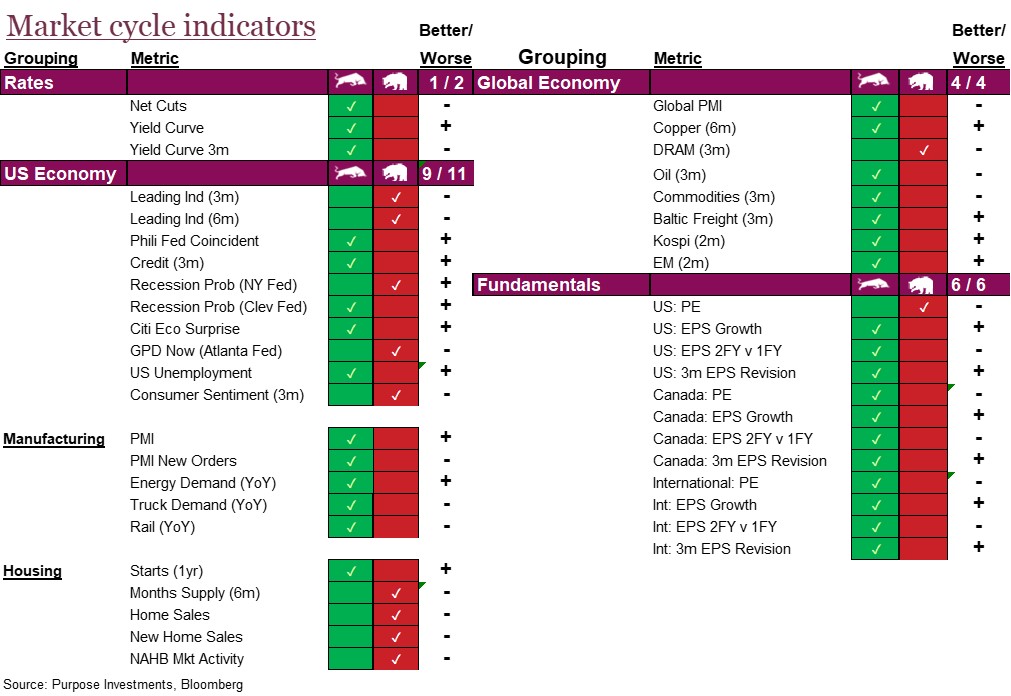
Global economic data remains healthy. We would expect to see some softness in coming months due to the rise in oil prices and trade disruption in the Gulf. Certainly worth watching but hard to say if the market will care or just look past it. Fundamentals, with earnings season humming along, are good.
We did some trading in early April, selling Canadian equity on strength and added to U.S. equity on relative fundamentals, as well as some global and international strategies. We will say we are now a bit worried markets have recovered too far or too fast. Overall, we are neutral on our equity allocation, with more international, equal on U.S. and under for Canada. We remain underweight bonds, and are holding more cash/diversifiers.
Portfolio positioning
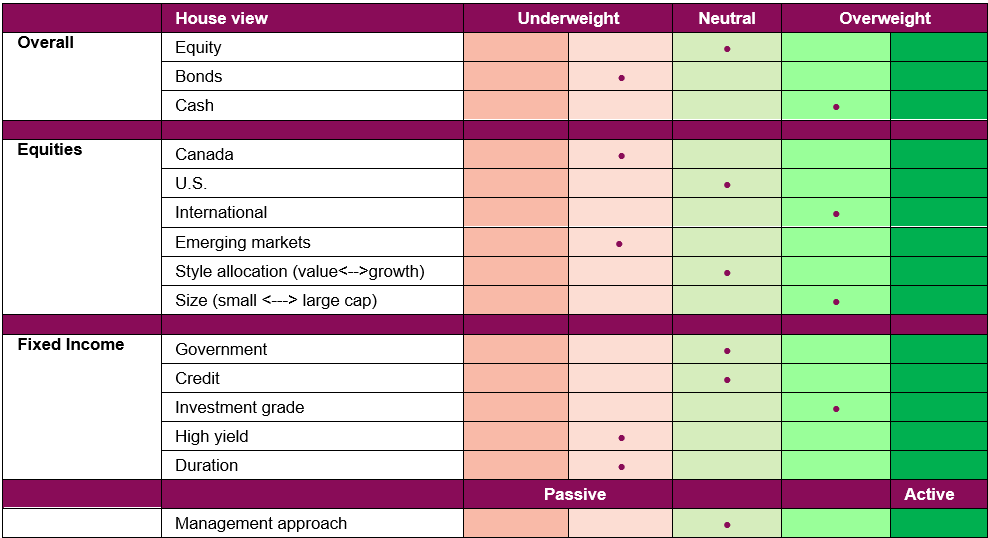
Final note
You may not like most headlines you have read so far this year, but you have got to like your portfolio. Markets have clearly jumped over the valley of uncertainty caused by the war and the ongoing blockage of the Strait of Hormuz. Many investors are rejoicing in a good earnings season. Next up will be the inflation impulse from these high energy prices and any economic growth impact. Plus, more attention to politics as the midterms approach. For now, this fearless market sure seems eager for its next test.