
Sign up here to receive the Market Ethos by email.
Market Ethos
April 24, 2023.
For broad U.S. market exposure, bigger isn’t always better. In a multi-asset portfolio, we’ve long argued the case that being active can provide long-term added value. But being active doesn’t necessarily mean solely relying on active managers. Making an active call on allocations, even on a rather generic cheap market beta, can make a difference. ETFs are popular choices, and plain vanilla market cap ETFs give great exposure to the overall market. But many of the most popular go-to ETFs are simply passive vehicles that mirror market cap indices.
Since mid-2020, we’ve recommended equal weight exposure versus traditional market cap exposure as a sleeve in multi-asset portfolios. Our rationale was that hidden within the broad U.S. market were risks that we wanted to avoid. Equal weight basically levels the playing field in today’s market. Attempting to maximize returns through diversifying over the long term typically costs a little more due to more active rebalancing. With ETFs, understanding your exposures is an indispensable first step because it’s in these differences that the alpha can be generated.
Know what you own
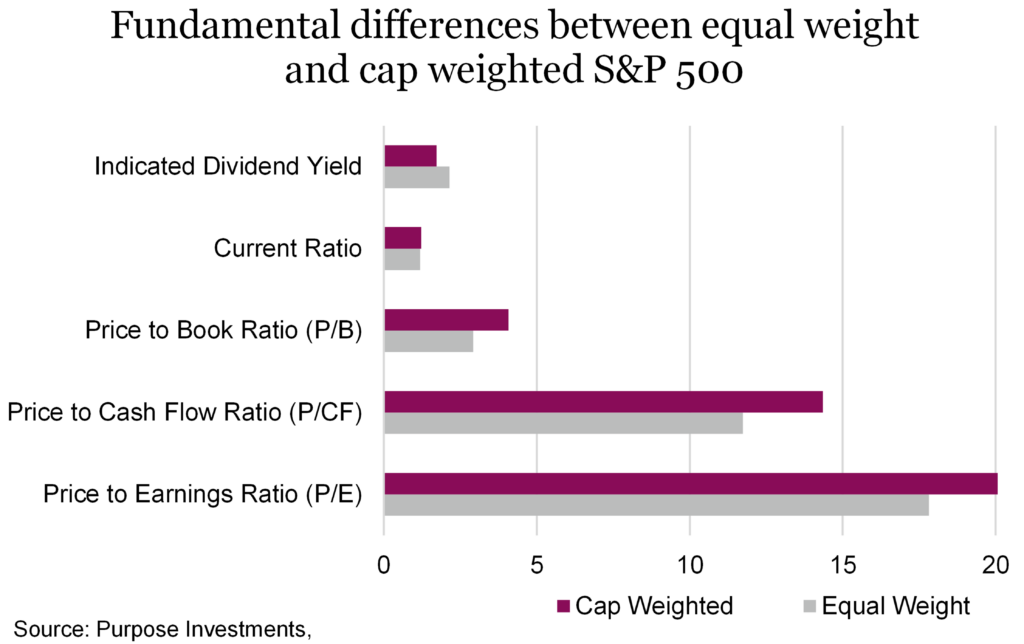
A fund’s expense ratio or AUM gathers a lot of interest, but truly digging into a fund’s exposure makes a difference. At first glance, you wouldn’t think there is much of a difference between the S&P 500 and the S&P 500 Equal Weight. Index construction matters and looking under the hood reveals several key differences between the two. Some fundamental differences are outlined in the chart below. What stands out is a definitive tilt towards value as well as more exposure to dividends for equal weight. Both factors tend to outperform during prolonged periods of market stress.
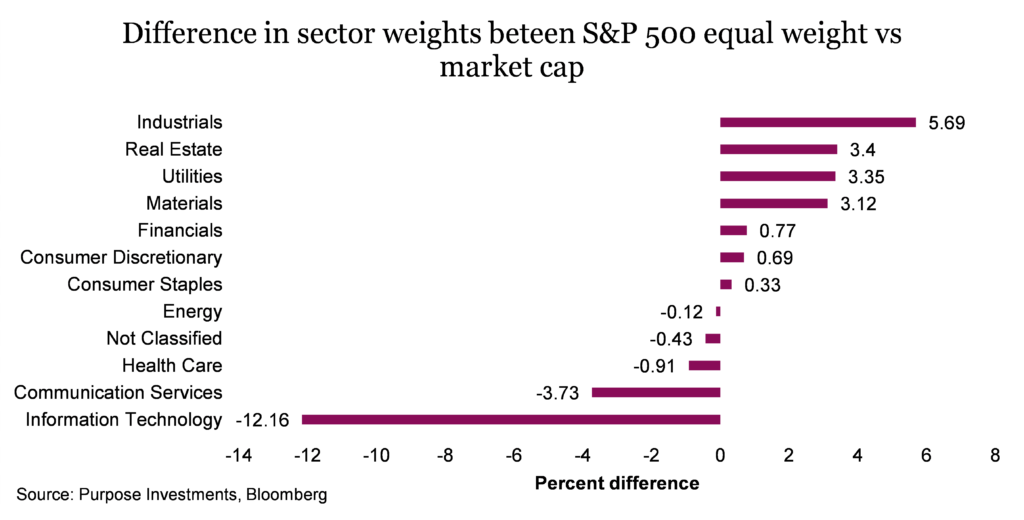
This chart outlines the difference in equal weighted sectors compared to the cap-weighted index. By far, the largest difference is the weighting in technology. The cap weight is 25.5%, while it’s just 13.3% in the equal weight index, a 12.2% difference. Equal weight is much more balanced with more exposure to industrials, real estate, utilities, and materials.
Concentration risks
Though down from its peak in 2021, there remains a considerable amount of concentration risk in the S&P 500. After a difficult 2022 for many companies in the tech space, the top five companies still account for nearly 20% of the index. Broaden this to the top ten names, and you’re up to 27% of the index in just ten companies; down from its peak but still well north of where it was in the dot com bubble at around 18%. Concentration risk always comes down, and it’s really never been higher. Words like concentration, top-heavy and unbalanced have been talked about a lot over the past few years. It isn’t inherently wrong, but it’s truly about a lack of diversification. Concentration risk can be really bad or really good, but rarely in between.
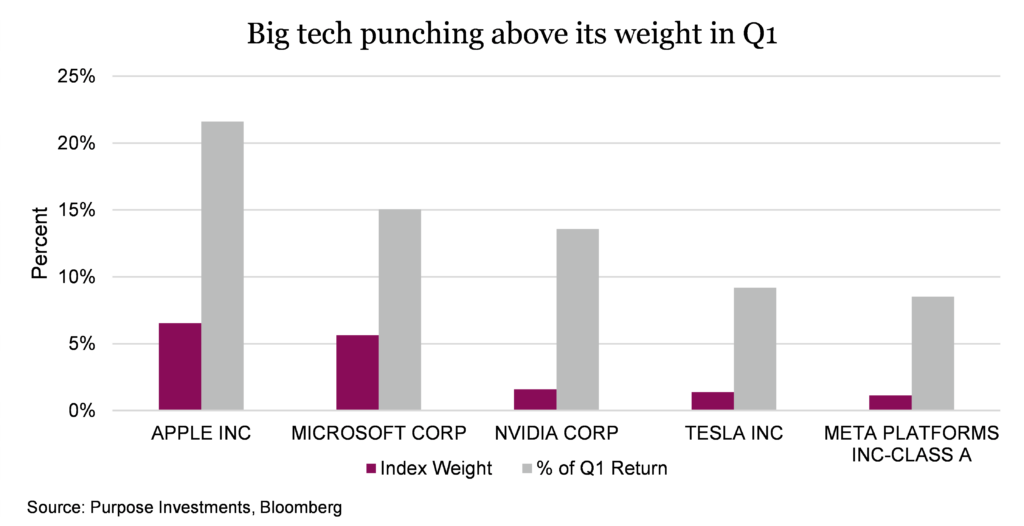
The entire market is now virtually made up of just a small number of stocks. Without just 18 companies, the S&P 500’s gains in the first quarter would have been negative. We question the sustainability of this when some of the biggest tech names must punch well above their weight to drive market cap outperformance to this degree.
The chart below contrasts the contribution of Q1 returns from some of the largest index members in comparison to their index weight. Q1 has been an aberration from recent trends, and we do not see it as simply the resumption of previous bull market winners.
Recent performance – markets back to their old ways
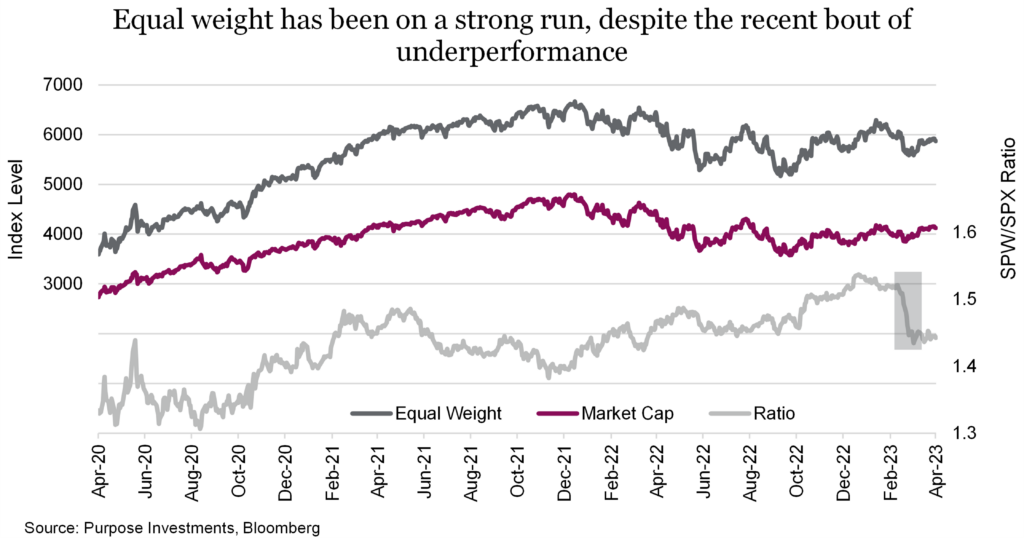
Equal weight began its outperformance following Covid and has been a decided winner over the past three years, rising +18.6% compounded annually vs +15.2% for the S&P 500. Markets don’t move in a straight line, and neither has the relative outperformance of equal weight. The past quarter has seen a sudden reversal, with the cap-weighted index striking an impressive comeback. Below, the chart outlines both the relative outperformance over the past three years as well as the sudden bout of underperformance last quarter. The recent high rally in the equity markets is fueled by multiple expansion, thanks to falling inflation and bond yields. However, falling inflation will prove to be a headwind for earnings going forward. And those lower bond yields — well they are lower because optimism for economic growth continues to dwindle, which is good for lower yields but not good for future earnings.
So far this year, markets have returned to their old ways. Rising rates are less of a worry, and a large injection of stimulus has also propelled big tech stocks higher. From an attribution standpoint, lack of tech exposure is by far the largest driver of recent underperformance. On top of that, security selection within the banks has also negatively impacted equal weight. Year to date, the increased exposure to regional banks rather than being heavily tilted to the large money centers has lost nearly 80bps versus cap weighted. Performance depends on your timeframe. Equal-weight outperformed in the last three years, while market-cap weighted did better over five years. Long-term data going back to 1990 shows a virtual tie between the two, but coming off of the 2000 tech bubble, the equal weight index has compounded annual returns of +8.6% versus +6.7% for cap-weighted.
Final thoughts
Leadership in the stock market tends to change from one bull market to another because different sectors and industries experience varying degrees of growth and decline. The chart below gives a few excellent examples of how often the previous leaders become laggards in the next bull. During the dot-com boom of the late 1990s, technology stocks were in high demand, while during the 2000s, bull energy and materials tended to outperform. Investors need to be vigilant and adaptable to capitalize on changing market trends and leadership. If you believe things are going to change, market cap isn’t really where you want to be, as it’s just overweighting previous leaders. A return to more value-oriented exposure and away from mega-cap tech stocks will also benefit equal weight.
Despite the recent rebound in technology shares, we stand behind our call to limit exposure to the sector. We’re entering a global economic slowdown, and there is still plenty of remaining froth in tech stocks. We’re likely in a ‘higher for longer’ rate environment, and growth stocks were massive beneficiaries in the low-rate world. The low-rate world was extremely beneficial for growth investors, and momentum, in particular, was a dominant factor for long periods over the past decade. In contrast, value was decidedly out of favour.

The current market environment emphasizes the importance of active decision-making in investment allocations. Equal weight investing provides a potential solution for investors seeking to diversify and avoid concentration risk in market cap indices. It’s essential for investors to understand their exposures and actively manage their portfolios, even when it comes to something as seemingly straightforward as their exposure to U.S. equities.
Sign up here to receive the Market Ethos by email.
Source: Charts are sourced to Bloomberg L.P., Purpose Investments Inc., and Richardson Wealth unless otherwise noted.
The contents of this publication were researched, written and produced by Purpose Investments Inc. and are used by Richardson Wealth Limited for information purposes only.
*This report is authored by Derek Benedet, CMT a Portfolio Manager at Purpose Investments Inc. Effective September 1, 2021, Derek Benedet has transitioned to Purpose Investments Inc.
Disclaimers
Richardson Wealth Limited
The opinions expressed in this report are the opinions of the author and readers should not assume they reflect the opinions or recommendations of Richardson Wealth Limited or its affiliates. Assumptions, opinions and estimates constitute the author’s judgment as of the date of this material and are subject to change without notice. We do not warrant the completeness or accuracy of this material, and it should not be relied upon as such. Before acting on any recommendation, you should consider whether it is suitable for your particular circumstances and, if necessary, seek professional advice. Past performance is not indicative of future results. The comments contained herein are general in nature and are not intended to be, nor should be construed to be, legal or tax advice to any particular individual. Accordingly, individuals should consult their own legal or tax advisors for advice with respect to the tax consequences to them.
Richardson Wealth is a trademark of James Richardson & Sons, Limited used under license.
Purpose Investments Inc.
Purpose Investments Inc. is a registered securities entity. Commissions, trailing commissions, management fees and expenses all may be associated with investment funds. Please read the prospectus before investing. If the securities are purchased or sold on a stock exchange, you may pay more or receive less than the current net asset value. Investment funds are not guaranteed, their values change frequently and past performance may not be repeated.
Forward Looking Statements
Forward-looking statements are based on current expectations, estimates, forecasts and projections based on beliefs and assumptions made by author. These statements involve risks and uncertainties and are not guarantees of future performance or results and no assurance can be given that these estimates and expectations will prove to have been correct, and actual outcomes and results may differ materially from what is expressed, implied or projected in such forward-looking statements. Assumptions, opinions and estimates constitute the author’s judgment as of the date of this material and are subject to change without notice. Neither Purpose Investments nor Richardson Wealth warrant the completeness or accuracy of this material, and it should not be relied upon as such. Before acting on any recommendation, you should consider whether it is suitable for your particular circumstances and, if necessary, seek professional advice. Past performance is not indicative of future results. These estimates and expectations involve risks and uncertainties and are not guarantees of future performance or results and no assurance can be given that these estimates and expectations will prove to have been correct, and actual outcomes and results may differ materially from what is expressed, implied or projected in such forward-looking statements. Unless required by applicable law, it is not undertaken, and specifically disclaimed, that there is any intention or obligation to update or revise the forward-looking statements, whether as a result of new information, future events or otherwise.
Before acting on any recommendation, you should consider whether it is suitable for your particular circumstances and, if necessary, seek professional advice.
The particulars contained herein were obtained from sources which we believe are reliable but are not guaranteed by us and may be incomplete. This is not an official publication or research report of either Richardson Wealth or Purpose Investments, and this is not to be used as a solicitation in any jurisdiction.
This document is not for public distribution, is for informational purposes only, and is not being delivered to you in the context of an offering of any securities, nor is it a recommendation or solicitation to buy, hold or sell any security.
Richardson Wealth Limited, Member Canadian Investor Protection Fund.
Richardson Wealth is a trademark of James Richardson & Sons, Limited used under license.