
Sign up here to receive the Market Ethos by email.
Market Insights
August 2022.
- On March 31, 2022, the yield curve briefly inverted with the 10-year Treasury falling to 2.331%, while the yield on the 2-year Treasury was at 2.337%.
- On June 13, 2022, the yield curve inverted again after higher-than-anticipated inflation sparked concerns of more aggressive Fed policy tightening.
- On July 5, 2022, the yield curve inverted for the third time as investors began to price in the possibility of a recession as Fed minutes revealed its commitment to f ight soaring inflation with another jumbo interest rate hike. At the time of writing, the 2/10 year spread reached -30 bps, its widest margin since 2000.
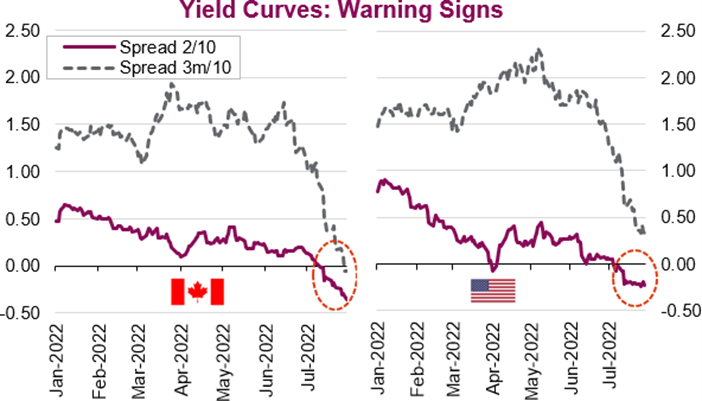
With inflation at or near a 40-year high, Canadian and U.S. central banks have embarked on aggressive monetary policy tightening to rein in rising prices. As the accelerated tightening cycle continued to unfold, yields jumped higher, particularly on the short-end, leading to multiple inversions, with the spread of each inversion getting progressively wider.
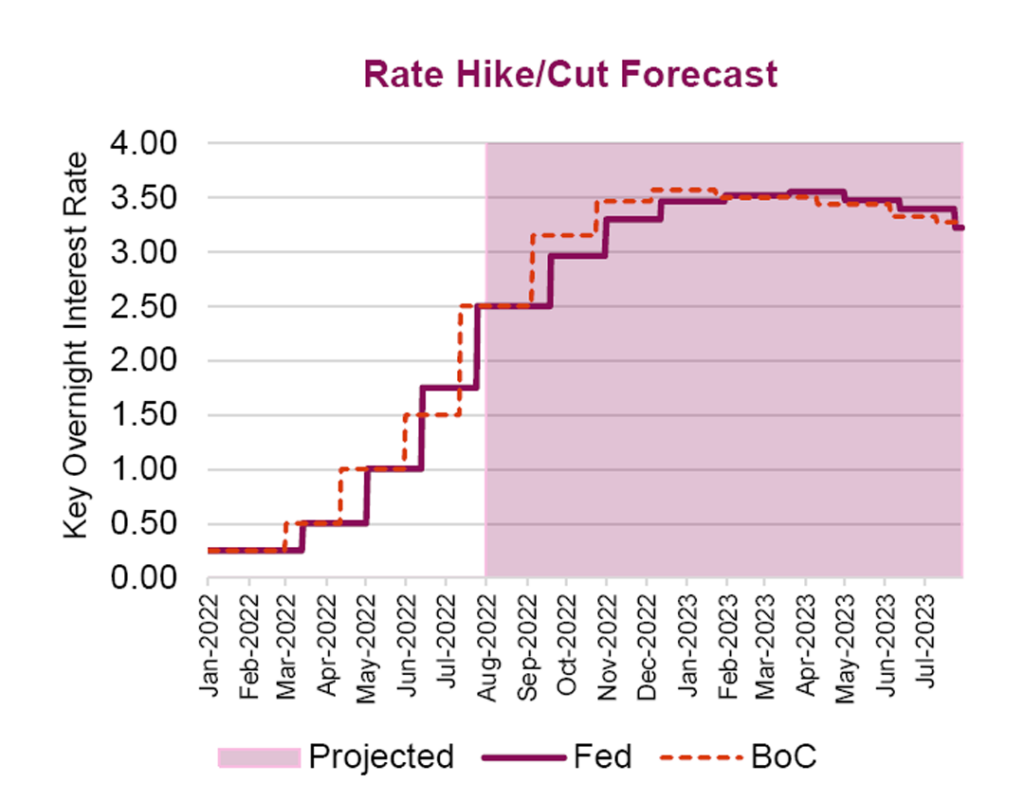
A Seesaw of Interest-rate Expectations
Earlier in the year, markets priced in three and five interest rate hikes by U.S. and Canadian central banks respectively and expectations of the rate hikes were f or a series of moderate 25 basis point moves. How quickly things changed. As recently as July, the Canadian and U.S. markets were pricing in up to eight rate hikes and central banks opted for not one but multiple jumbo rate hikes to the tune of 50, 75, and even 100 bps (in Canada), which were unthinkable only six months ago. However, interest rate expectations have since moderated, after the Bank of Canada surprised the market with its (super) jumbo 100 bps hike on July 13, and after U.S. Federal Reserve Chair Powell said “as the stance of policy becomes tighter it will likely become appropriate to slow the pace”, suggesting to some a moderation in the pace of rate increases. Despite the seesaw in expectations, Fed officials remain steadfast in their hawkish stance, with some “puzzled” that investors’ expectations have shifted to rate cuts as early as 2023 as the Fed remains “resolute and completely united” to curb inflation, irrespective of its likely impact on economic growth.
In this edition of Market Insights, our goal is to dig deeper into the historical predictive power of the slope of the yield curve and discuss why and when an inverted curve has historically been a good indicator of a recession.
Yield Curve 101
Looking at the 2/10-year curve, once an inversion is sustained, equities have historically tended to rise for the next 12 to 24 months, followed by a recession. Despite knowing this, we can’t predict with certainty when the next recession will happen (up to 24 months is a big window), nor will we know the magnitude and duration of the decline as there are many f actors that play into this dynamic. Some argue that the Fed’s easy monetary policies including lower for longer interest rates and quantitative easing have skewed the market and the magnitude of the intervention in bond markets has artif icially depressed treasury yields. This has led to some economists to believe the inversion we f irst saw at the end of March was different from those in the past. Is it different this time? Only time will tell, but here we lay down the initial yield curve groundwork to begin the discussion.
The yield curve plots interest rates/yields and maturities of bonds of equal credit quality (typically government and sovereign). The yield curve is typically upward sloping with longer-term bonds yielding more than shorter-term bonds.
Over time, a combination of the following economic theories has been used to explain the shape of the yield curve:
- Pure Expectation Theory: Longer term rates are simply an average of expected shorter term rates over time and so the shape of the yield curve is depicted by the market’s expectation of future interest rates. The main flaw of this theory is that it ignores interest rate risk and reinvestment risk.
- Liquidity Preference Theory: An extension to the pure expectation theory that tries to fix its main flaw by
- adding in a premium called liquidity premium or term premium. The premium indicates the amount of additional risk in holding long-term debts over short-term debts.
- Segmented Market Theory: The segmented market theory is based on the separate demand and supply relationship between short-term securities and long-term securities. It is based on the fact that different maturities of securities cannot be substituted for one another.
- Preference Habitat Theory: This is an extension of the Market Segmentation Theory that investors prefer a certain investment horizon. To invest outside this horizon, they will require some premium. This theory explains the reason behind long-term yields being greater than short-term yields.
What is the Yield Curve Saying?
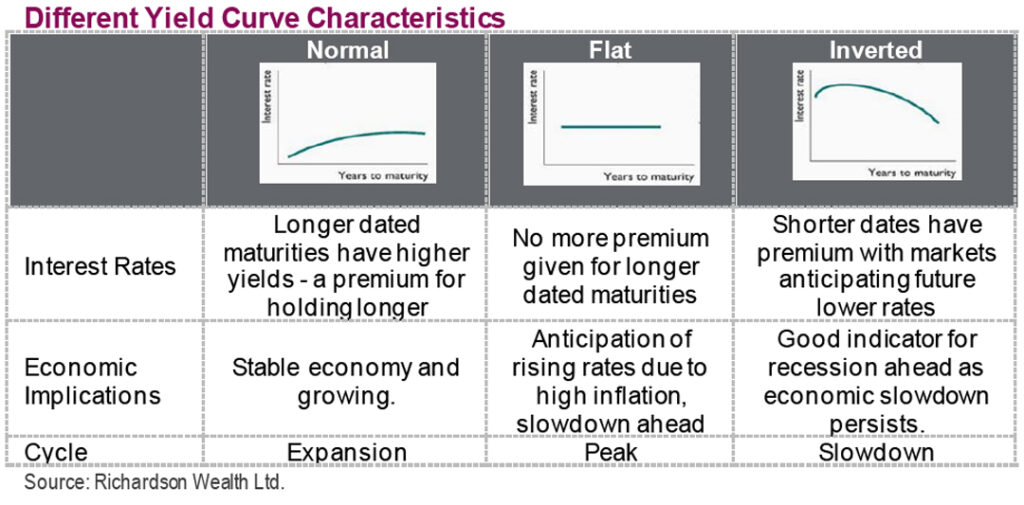
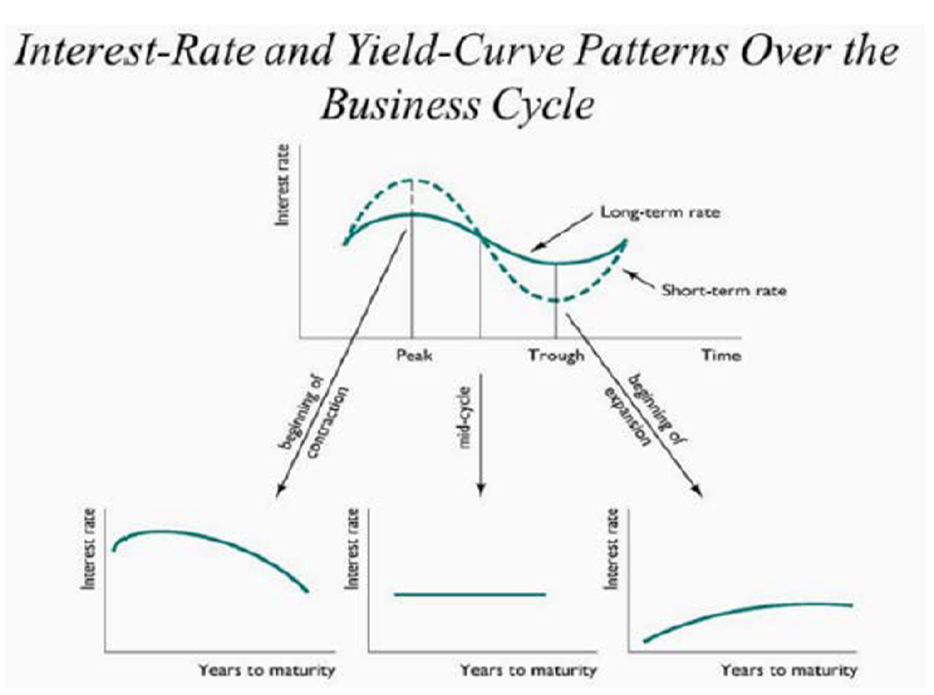
The yield curve has historically been known to be a powerful forecasting tool, as it incorporates market expectations of future interest rates, which reflects expectations of future economic conditions and corresponding monetary policy. For example, a normal or upward sloping yield curve points to an economic expansion, an otherwise healthy economy where investors demand a term premium for longer dated issues. The spread between short and long-term yields may widen (steepening yield curve) which implies stronger economic growth, rising inflation and higher interest rates. A flattening curve typically suggests investors expect near term interest rate hikes and slower economic conditions. Lastly, and more rarely, a downward sloping or inverted curve, where short-term rates are higher than their longer-term counterparts often point to aggressive policy tightening with expectations it will lead to an economic contraction/recession.
Inverted Yield Curve and Recessions: Is it the Canary in the Coal Mine?
Canaries were historically used in coal mines to detect carbon monoxide. Due to their small size, fast breathing rate and metabolism the canary’s fate was quicker than those of the miners, giving the miners time to escape. So, is the yield curve our canary in predicting the next recession?
Before we dig deeper into the data, which spreads should we be looking at? Different market pundits will argue superiority of one spread over another. Historically, financial professionals and finance news media have cited the more popular 2/10-year spread, meanwhile academic studies to examine the predictive power of yield curves have used the spread between the 3-month and 10-year. For this analysis, we will look at the at the 3mo/10-year spread which is the one used across several Federal reserve studies/models including the New York Federal Reserve Recession model and seems to have the best batting average in the past 50 years in predicting a recession.
What does the data tell us? If the inversion is prolonged for over one month and/or there are subsequent inversions, the 3mo/10-year spread has been a good indicator of a recession. Over the last 50 years the onset of a recession following an inverted yield curve is largely within one year. However, we acknowledge one of the main reasons of the effectiveness of the yield curve as an indicator is due to its simplicity. Used in conjunction with other metrics in a larger econometric model will help make recession conclusions much clearer.
Market Implications
Some might argue we are already in a recession with two consecutive quarters of negative GDP reported in the U. S. – the technical definition of a recession. However, we will have to wait for the National Bureau of Economic Research (NBER) to f ormally tell us as its definition of a recession is broader as it considers the depth, diffusion and duration of the decline in economic activity, which must be significant and spread across the economy. Whether the inversion is signaling a recession is not absolute, but the yield curve is definitely telling us something. It should not come as a surprise that the higher cost of capital for households and corporations would constrain economic activity. The Fed has acknowledged the outright risks to economic growth that higher interest rates would cause but accepted the risks to meet their stated objectives to bring inflation back to the central bank’s longer-term target of 2%. The ideal scenario would be a “soft landing” but only time will tell us whether the Fed was able to curb prices without tipping the economy into a prolonged downturn.
Source: Charts are sourced to Bloomberg L.P., and Richardson Wealth unless otherwise noted.
Authors: An Nguyen, VP Investment Services; Phil Kwon, Head of Portfolio Analytics; Andrew Innis, Analyst Disclaimers
Richardson Wealth Limited
The opinions expressed in this report are the opinions of the author and readers should not assume they reflect the opinions or recommendations of Richardson Wealth Limited or its affiliates. Assumptions, opinions and estimates constitute the author’s judgment as of the date of this material and are subject to change without notice. We do not warrant the completeness or accuracy of this material, and it should not be relied upon as such. Before acting on any recommendation, you should consider whether it is suitable for your particular circumstances and, if necessary, seek professional advice. Past performance is not indicative of future results. The comments contained herein are general in nature and are not intended to be, nor should be construed to be, legal or tax advice to any particular individual. Accordingly, individuals should consult their own legal or tax advisors for advice with respect to the tax consequences to them.
Forward Looking Statements
Forward-looking statements are based on current expectations, estimates, forecasts and projections based on beliefs and assumptions made by the author. These statements involve risks and uncertainties and are not guarantees of future performance or results and no assurance can be given that these estimates and expectations will prove to have been correct, and actual outcomes and results may differ materially from what is expressed, implied or projected in such forward-looking statements. Assumptions, opinions and estimates constitute the author’s judgment as of the date of this material and are subject to change without notice. Richardson Wealth does not warrant the completeness or accuracy of this material, and it should not be relied upon as such. Before acting on any recommendation, you should consider whether it is suitable for your particular circumstances and, if necessary, seek professional advice. Past performance is not indicative of future results. These estimates and expectations involve risks and uncertainties and are not guarantees of future performance or results and no assurance can be given that these estimates and expectations will prove to have been correct, and actual outcomes and results may differ materially from what is expressed, implied or projected in such forward-looking statements. Unless required by applicable law, it is not undertaken, and specifically disclaimed, that there is any intention or obligation to update or revise the forward-looking statements, whether as a result of new information, future events or otherwise.
Before acting on any recommendation, you should consider whether it is suitable for your particular circumstances and, if necessary, seek professional advice.
The particulars contained herein were obtained from sources which we believe are reliable, but are not guaranteed by us and may be incomplete. This is not an official publicationor research report from Richardson Wealth, and is not to be used as a solicitation in any jurisdiction.
This document is for informational purposes only, and is not being delivered to you in the context of an offering of any securities, nor is it a recommendation or solicitation to buy, hold or sell any security.
Richardson Wealth Limited, Member Canadian Investor Protection Fund.
Richardson Wealth is a trademark of James Richardson & Sons, Limited used under license.