
Market Insights
April 7, 2025
Staying the course amid market volatility
Sign up here to receive the Market Ethos by email.
Equity markets have entered a period of heightened turmoil. The Nasdaq officially entered bear market territory last week (-20% off recent high), and both the S&P 500 and S&P/TSX indexes slipped into correction territory (-10% off recent high), with the S&P 500 not far behind the Nasdaq’s lead and nearing a bear market. While these headline moves can be unsettling, it’s important to understand what’s driving them, and how we are navigating through the noise.
Markets are recoiling for several reasons. They are declining in response to growing concerns that newly proposed tariffs could weigh on global economic growth and, by extension, corporate earnings and broader fundamentals. Markets are not only reacting to data, but they are also reacting to sentiment, soundbites, and speculation amid escalating U.S. policy rhetoric. Much remains uncertain, including the extent to which President Trump will follow through on his policies, and how far other countries are willing to go in response. We cannot say with certainty the extent to which Trump will follow through on his tariff threats, as negotiations are ongoing and it’s entirely possible that what we’re seeing now is more posturing than policy.
This environment reinforces the importance of disciplined investing and the value of a thoughtful strategy. Earlier this year, we expressed concerns about rising volatility and proactively took steps to reduce the portfolio’s overall sensitivity to market movements, i.e. reduced portfolio beta by adding to a market neutral strategy. At the same time, we trimmed U.S. dollar exposure when the dollar had rallied to its 2020 pandemic “panic” highs, and selectively added to our U.S. bond position that we viewed were oversold and owing to our more defensive posture. These measures were designed not just for the moment, but for times like these, and they remain highly relevant.
For clients who have the ability to tolerate short-term volatility, this may be an opportunity to gradually redeploy excess cash. Historically, of the 25 market corrections (defined as -10% decline from peak) in the S&P 500 since 2000, 16 were followed by strong positive returns, averaging 22.9% over the subsequent year. The eight times the market dropped one year after a correction, the index declined on average -17.2%.
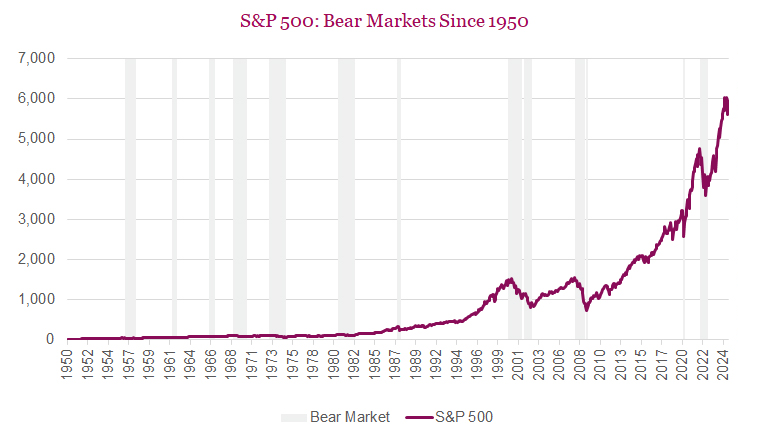
Taking a closer look at historical market performance following a bear market, defined as a decline of -20% or more from a recent market high (see table/charts below), since 1950 there have been 13 bear markets. This makes them not as rare as one would think, occurring roughly every 5 to 6 years on average. The typical duration of a bear market has been about 11 months, with an average decline of approximately -32.8%. What’s most important, however, is what tends to happen after a bear market ends. While past performance is no guarantee, history reminds us that markets often recover, and those recoveries tend to happen when sentiment is at its lowest. What we do know is that very few individuals can accurately predict the market bottom and staying invested through volatility has historically been a sound long-term strategy. Missing the initial rebound that often follows a bear market can significantly reduce long-term returns.
Now is a time for patience, discipline, and perspective. We’re continuing to monitor developments closely, and as always, we are here to help you navigate through whatever comes next.
| Post Bear Market Performance | |||||||
|---|---|---|---|---|---|---|---|
| Start | End | Dur (Mos) | % During Bear | 1 month | 3 Months | 6 Months | 1 Year |
| 02-Aug-1956 | 22-Oct-1957 | 14.9 | -21.6% | 3.8% | 6.1% | 9.6% | 31.0% |
| 12-Dec-1961 | 26-Jun-1962 | 6.5 | -28.0% | 8.5% | 8.2% | 19.7% | 32.7% |
| 09-Feb-1966 | 07-Oct-1966 | 8.0 | -22.2% | 10.4% | 11.5% | 22.7% | 32.9% |
| 29-Nov-1968 | 26-May-1970 | 18.1 | -36.1% | 6.8% | 16.9% | 20.8% | 43.7% |
| 11-Jan-1973 | 03-Oct-1974 | 21.0 | -48.2% | 18.6% | 10.1% | 32.7% | 38.0% |
| 28-Nov-1980 | 12-Aug-1982 | 20.7 | -27.1% | 18.1% | 37.8% | 42.3% | 58.3% |
| 25-Aug-1987 | 04-Dec-1987 | 3.4 | -33.5% | 10.3% | 19.6% | 19.1% | 21.4% |
| 24-Mar-2000 | 21-Sep-2001 | 18.2 | -36.8% | 11.1% | 18.0% | 19.3% | -12.5% |
| 04-Jan-2002 | 09-Oct-2002 | 9.3 | -33.8% | 15.2% | 18.8% | 13.3% | 33.7% |
| 09-Oct-2007 | 20-Nov-2008 | 13.6 | -51.9% | 18.0% | 4.8% | 20.7% | 45.0% |
| 06-Jan-2009 | 09-Mar-2009 | 2.1 | -27.6% | 22.0% | 39.0% | 50.2% | 68.6% |
| 19-Feb-2020 | 23-Mar-2020 | 1.1 | -33.9% | 25.1% | 38.5% | 48.4% | 74.8% |
| 03-Jan-2022 | 12-Oct-2022 | 9.4 | -25.4% | 11.6% | 9.6% | 14.9% | 21.6% |
| Average | -32.8% | 13.8% | 18.4% | 25.7% | 37.6% | ||
| Median | -33.5% | 11.6% | 16.9% | 20.7% | 33.7% | ||
| High | -21.6% | 25.1% | 39.0% | 50.2% | 74.8% | ||
| Low | -51.9% | 3.8% | 4.8% | 9.6% | -12.5% | ||
| % Positive | 0.0% | 100.0% | 100.0% | 100.0% | 92.3% | ||
| % Negative | 100.0% | 0.0% | 0.0% | 0.0% | 7.7% | ||
| Std Dev | 9.2% | 6.2% | 12.4% | 13.4% | 22.4% | ||
Source: Bloomberg. As at March 31, 2025. Monthly price returns
Source: Charts are sourced to Bloomberg L.P., and Richardson Wealth unless otherwise noted.
Authors: An Nguyen, VP Investment Services; Phil Kwon, Head of Portfolio Analytics; Andrew Innis, Analyst
Disclaimers
Richardson Wealth Limited
The opinions expressed in this report are the opinions of the author and readers should not assume they reflect the opinions or recommendations of Richardson Wealth Limited or its affiliates. Assumptions, opinions and estimates constitute the author’s judgment as of the date of this material and are subject to change without notice. We do not warrant the completeness or accuracy of this material, and it should not be relied upon as such. Before acting on any recommendation, you should consider whether it is suitable for your particular circumstances and, if necessary, seek professional advice. Past performance is not indicative of future results. The comments contained herein are general in nature and are not intended to be, nor should be construed to be, legal or tax advice to any particular individual. Accordingly, individuals should consult their own legal or tax advisors for advice with respect to the tax consequences to them.
Forward Looking Statements
Forward-looking statements are based on current expectations, estimates, forecasts and projections based on beliefs and assumptions made by the author. These statements involve risks and uncertainties and are not guarantees of future performance or results and no assurance can be given that these estimates and expectations will prove to have been correct, and actual outcomes and results may differ materially from what is expressed, implied or projected in such forward-looking statements. Assumptions, opinions and estimates constitute the author’s judgment as of the date of this material and are subject to change without notice. Richardson Wealth does not warrant the completeness or accuracy of this material, and it should not be relied upon as such. Before acting on any recommendation, you should consider whether it is suitable for your particular circumstances and, if necessary, seek professional advice. Past performance is not indicative of future results. These estimates and expectations involve risks and uncertainties and are not guarantees of future performance or results and no assurance can be given that these estimates and expectations will prove to have been correct, and actual outcomes and results may differ materially from what is expressed, implied or projected in such forward-looking statements. Unless required by applicable law, it is not undertaken, and specifically disclaimed, that there is any intention or obligation to update or revise the forward-looking statements, whether as a result of new information, future events or otherwise.
Before acting on any recommendation, you should consider whether it is suitable for your particular circumstances and, if necessary, seek professional advice.
The particulars contained herein were obtained from sources which we believe are reliable, but are not guaranteed by us and may be incomplete. This is not an official publication or research report from Richardson Wealth, and is not to be used as a solicitation in any jurisdiction.
This document is for informational purposes only, and is not being delivered to you in the context of an offering of any securities, nor is it a recommendation or solicitation to buy, hold or sell any security.
Richardson Wealth Limited, Member Canadian Investor Protection Fund.
Richardson Wealth is a trademark of James Richardson & Sons, Limited used under license.