
Sign up here to receive the Market Ethos by email.
Market Ethos
July 17, 2023.
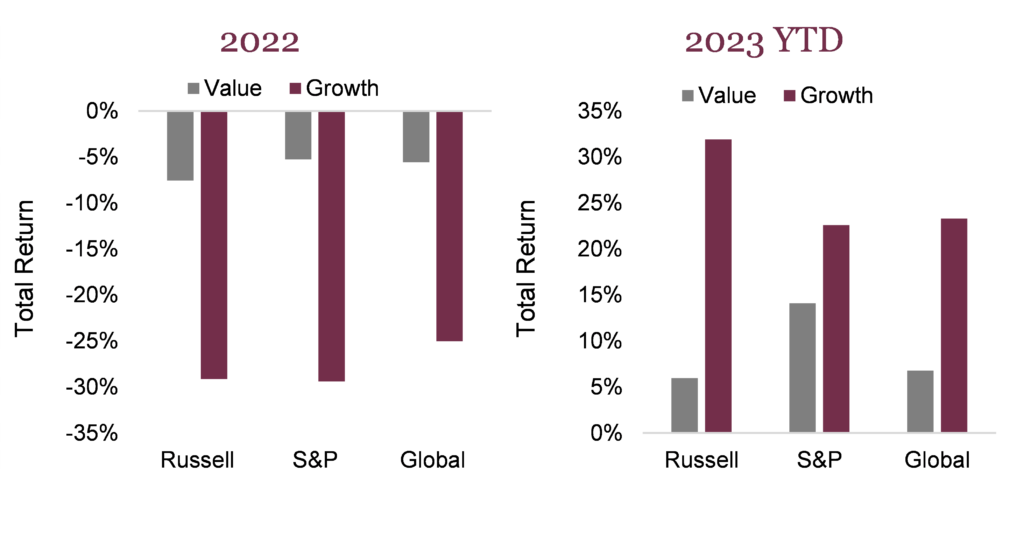
In 2022, we had a positive opinion and tilted towards the value/dividend factor among equity holdings in our multi-asset model portfolios and, subsequently, a rather negative opinion on the growth factor. That worked out really, really well, adding a good amount of alpha compared to peers. But then, in late 2022 and so far into 2023, the growth factor has returned to dominance. While we have kept up with our peer group thanks to some other contributors such as Japan and an overall overweight in international equity and manager selection within fixed income, our style tilt has been, well, wrong so far in 2023.
A post-mortem is what it sounds like, except it’s your portfolio being analyzed. It is an exploratory process to dive deep into previous portfolio decisions, now with the benefit of hindsight into what happened in the markets and the performance of the portfolio. In this case, what drove our value/dividend tilt in 2022 proved correct. And why haven’t we pivoted back to more growth so far in 2023? The objective is to learn from past mistakes and correct decisions to aid in future decision-making.
We hope you find this insightful, not just for your portfolio process, but for diving into any past decisions, whether they be investing, personal or business.
We do not learn from experience… we learn from reflecting on experience.
John DeweyWhy we were negative on the growth factor in 2022
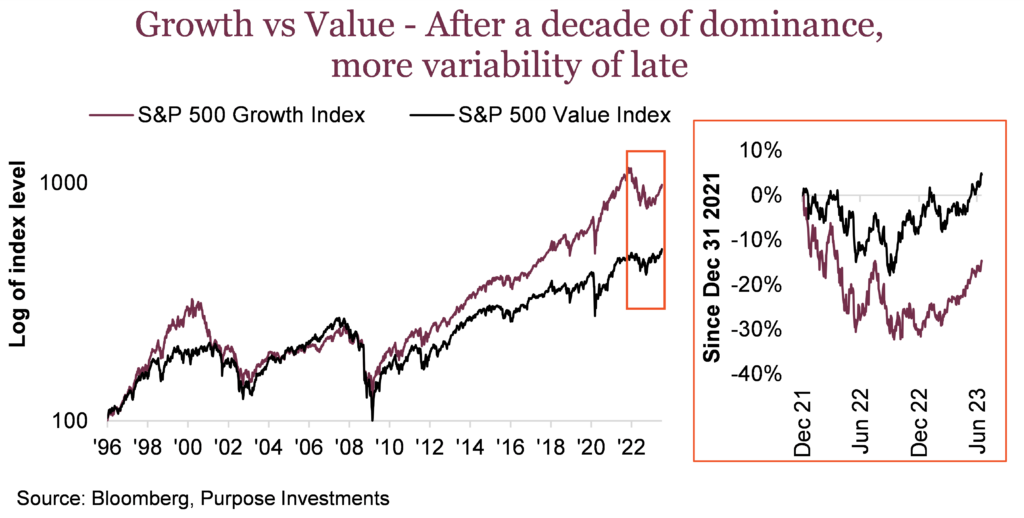
Tilting away from growth and more towards value/dividends worked out smashingly in 2022. Almost all the stars were aligned in favour of value over growth at the start of that year. Measuring various equity style indices, growth really outperformed value in the 2010s, and this accelerated in 2020/21 with the pandemic-induced spending patterns. At the start of 2022, growth indices experienced about double the performance of comparable value indices during the past three years. So, let’s say the performance was certainly stretched.
Valuations
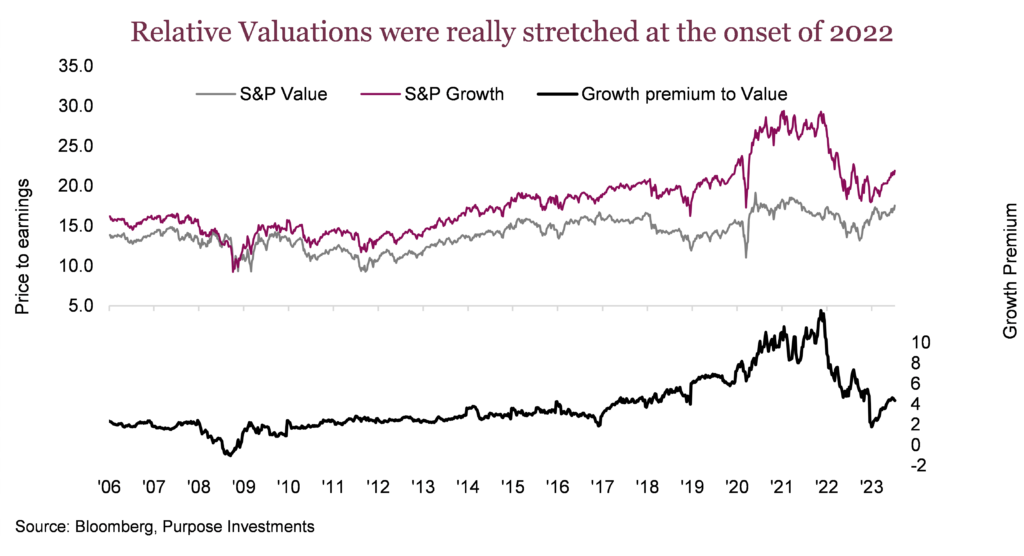
In fact, to say the valuations of growth indices were stretched at the beginning of 2022 would be an understatement. The average PE ratio across the S&P 500 Growth, Russell Growth and Bloomberg Global Growth sat at 33x. The average index percentile ranking based on their historical valuations was 95th – really close to the top. This was similar across other metrics, including price-to-book and price-to-sales.
Value factor index valuations were not cheap based on their respective histories, as the markets, in general, were more expensive. But they were nowhere near as stretched as you can see in the chart below.
Earnings growth
There is a long historical relationship between earnings growth and relative style performance. Generally, when earnings growth is strong, value outperforms growth. There are a few intuitive factors behind this; earnings growth is more abundant when the economy is doing well, and the value factor has a greater representation in many economically sensitive sectors. Meanwhile, when earnings growth is scarce, growth tends to do better. This is also a scarcity issue because when growth is hard to find, those companies that can still grow often fetch a premium.
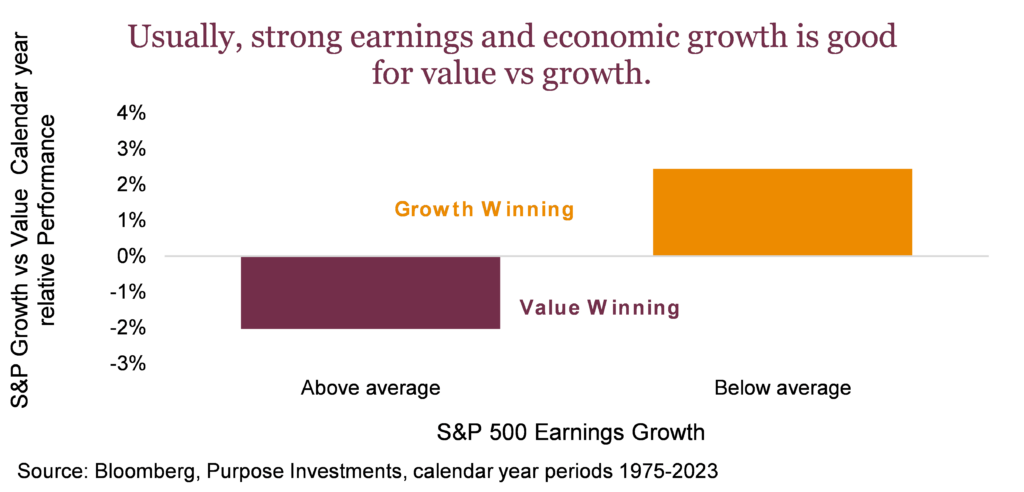
So, at the beginning of 2022, what did earnings look like? Earnings growth looked pretty good. For the S&P 500, estimates sat at $209 for 2021, growing to $223 in 2022 and $241 in 2023 – Solid high single-digit growth. This favoured value over growth.
Yields
When yields rise, as measured by the 10-year U.S. Treasury yield, value tends to outperform growth, and vice versa. This is driven by a couple of factors. Higher yields are more common when economic growth is accelerating, which makes earnings growth more abundant to favour value. Plus, growth companies tend to be viewed as longer duration based on future cash flows that are often much further in the future compared to value companies. Lower yields make the present value of those more distant cash flows worth more, favouring growth.
So, at the beginning of 2022, yields had started to come off the troughs caused by the pandemic and subsequent monetary stimulus. But the path was clearly higher in 2022, which favoured value.
Putting this all together, performance, relative valuations, earnings growth and the trajectory of yields all favoured value over growth as 2022 got going. A value tilt was both an easy decision and the right decision.
But then something changed in 2023
Value’s outperformance in 2022 has certainly reversed in 2023 so far. So how did the above metrics stack up on January 1 of this year? Perhaps the strong run by value was simply due for a reversal, given the magnitude of the move. But other factors also lined up better for growth or at least much less of a headwind.
Valuations
Based on the S&P 500 style indices, the valuation spread between value and growth, which was at historic extremes at the beginning of 2022, had narrowed considerably. In January 2022, growth traded with a 10-point premium to value. A year later, in January of ’23, this had narrowed to less than a 2-point premium. Growth has traded on occasion with a lower valuation than value but very rarely. So, it’s safe to say a mere 2-point premium for growth was a check mark favouring growth over value [see previous chart on style valuations above].
Earnings growth
Earnings growth, which was abundant in 2022, gradually declined. Recall there was high single-digit earnings growth in January 2022, a 7% earnings growth forecast for the coming year compared to the previous. As estimates declined during the year, earnings growth expectations did as well, down to 2% earnings growth in January 2023. Once again, this lower earnings growth environment favoured growth over value.
Yields
It doesn’t seem to be the absolute level of yields that matters; it is the change in yields that seems to correlate most with relative equity-style performance. 2022 saw yields rise materially, from 1.5% to 3.9%. This was good for value. So far in 2023, yields have moved around a bit but have been largely stable, sitting at 3.8% today. This may not favour growth, but it clearly isn’t the headwind compared to 2022.
At the onset of 2023, it may not have been a slam dunk that growth would outperform value, but it was a materially better environment for growth compared to the previous year.
Final thoughts
Whoops, we should have clearly pivoted back to from value to growth at the beginning of 2023, hindsight being 20/20 and all. Maybe it was overconfidence fed by being so well positioned in 2022 that had us believe there was more room to run for value. Regardless, the setup in early 2023 clearly favoured growth or at least a more neutral style stance.
This, of course, raises the more important question, what about the second half of 2023 and beyond? In the table below, we have summarized our signals/methodologies for style tilts, including the readings in January 2022, 2023 and in July 2023.
| January 2022 | January 2023 | July 2023 | |
|---|---|---|---|
| Recent Performance | Value – following such strong growth outperformance, value was due | Growth – following such strong value outperformance, growth was due | Value – the size and speed of growth’s rebound once again likely favours value |
| Valuations | Value – historically high premium of growth over value | Growth – the premium shrank from 10 to 2 points, making growth relatively cheap | Value – Nowhere near the spreads of Jan ’22, but certainly, growth is trading at an above-average premium to value |
| Earnings Growth | Value – earnings growth was abundant | Growth – on recession concerns, earnings growth has slowed | Maybe Value – earnings growth is forecast to begin improving, but this could change if a recession develops (that would be good for growth) |
| Yields | Value – yields had started to rise, and the trend was upward | Neither – yields appear to have stabilized | Maybe Growth – this one is tough. If you believe a recession is coming, then yields will fall, which is good for growth if inflation remains, good for value. |
| Source: Purpose Investments | |||
We would not chase this growth performance run as too many of the signals are now favouring value once again. The lesson of this post-mortem is to really develop and trust your process and don’t be afraid to pivot. If you sit on a great trade for too long, it can become less of a good trade.
Sign up here to receive the Market Ethos by email.
Source: Charts are sourced to Bloomberg L.P., Purpose Investments Inc., and Richardson Wealth unless otherwise noted.
The contents of this publication were researched, written and produced by Purpose Investments Inc. and are used by Richardson Wealth Limited for information purposes only.
*This report is authored by Craig Basinger, Chief Market Strategist at Purpose Investments Inc. Effective September 1, 2021, Craig Basinger has transitioned to Purpose Investments Inc.
Disclaimers
Richardson Wealth Limited
The opinions expressed in this report are the opinions of the author and readers should not assume they reflect the opinions or recommendations of Richardson Wealth Limited or its affiliates. Assumptions, opinions and estimates constitute the author’s judgment as of the date of this material and are subject to change without notice. We do not warrant the completeness or accuracy of this material, and it should not be relied upon as such. Before acting on any recommendation, you should consider whether it is suitable for your particular circumstances and, if necessary, seek professional advice. Past performance is not indicative of future results. The comments contained herein are general in nature and are not intended to be, nor should be construed to be, legal or tax advice to any particular individual. Accordingly, individuals should consult their own legal or tax advisors for advice with respect to the tax consequences to them.
Richardson Wealth is a trademark of James Richardson & Sons, Limited used under license.
Purpose Investments Inc.
Purpose Investments Inc. is a registered securities entity. Commissions, trailing commissions, management fees and expenses all may be associated with investment funds. Please read the prospectus before investing. If the securities are purchased or sold on a stock exchange, you may pay more or receive less than the current net asset value. Investment funds are not guaranteed, their values change frequently and past performance may not be repeated.
Forward Looking Statements
Forward-looking statements are based on current expectations, estimates, forecasts and projections based on beliefs and assumptions made by author. These statements involve risks and uncertainties and are not guarantees of future performance or results and no assurance can be given that these estimates and expectations will prove to have been correct, and actual outcomes and results may differ materially from what is expressed, implied or projected in such forward-looking statements. Assumptions, opinions and estimates constitute the author’s judgment as of the date of this material and are subject to change without notice. Neither Purpose Investments nor Richardson Wealth warrant the completeness or accuracy of this material, and it should not be relied upon as such. Before acting on any recommendation, you should consider whether it is suitable for your particular circumstances and, if necessary, seek professional advice. Past performance is not indicative of future results. These estimates and expectations involve risks and uncertainties and are not guarantees of future performance or results and no assurance can be given that these estimates and expectations will prove to have been correct, and actual outcomes and results may differ materially from what is expressed, implied or projected in such forward-looking statements. Unless required by applicable law, it is not undertaken, and specifically disclaimed, that there is any intention or obligation to update or revise the forward-looking statements, whether as a result of new information, future events or otherwise.
Before acting on any recommendation, you should consider whether it is suitable for your particular circumstances and, if necessary, seek professional advice.
The particulars contained herein were obtained from sources which we believe are reliable but are not guaranteed by us and may be incomplete. This is not an official publication or research report of either Richardson Wealth or Purpose Investments, and this is not to be used as a solicitation in any jurisdiction.
This document is not for public distribution, is for informational purposes only, and is not being delivered to you in the context of an offering of any securities, nor is it a recommendation or solicitation to buy, hold or sell any security.
Richardson Wealth Limited, Member Canadian Investor Protection Fund.
Richardson Wealth is a trademark of James Richardson & Sons, Limited used under license.