
May 7, 2024
Investor Strategy
Goldilocks and the bad news bears
Sign up here to receive the Market Ethos by email.
Executive summary
Take your pick. There is no shortage of both good and bad news floating about the financial markets. To be fair, this is always the case. The hard part is understanding which side is stronger today and which side will be stronger tomorrow. So far in 2024, markets are up low to mid-single digits, following a very strong Q4 finish to 2023, most would agree the optimists are carrying the day at the moment.
April showers
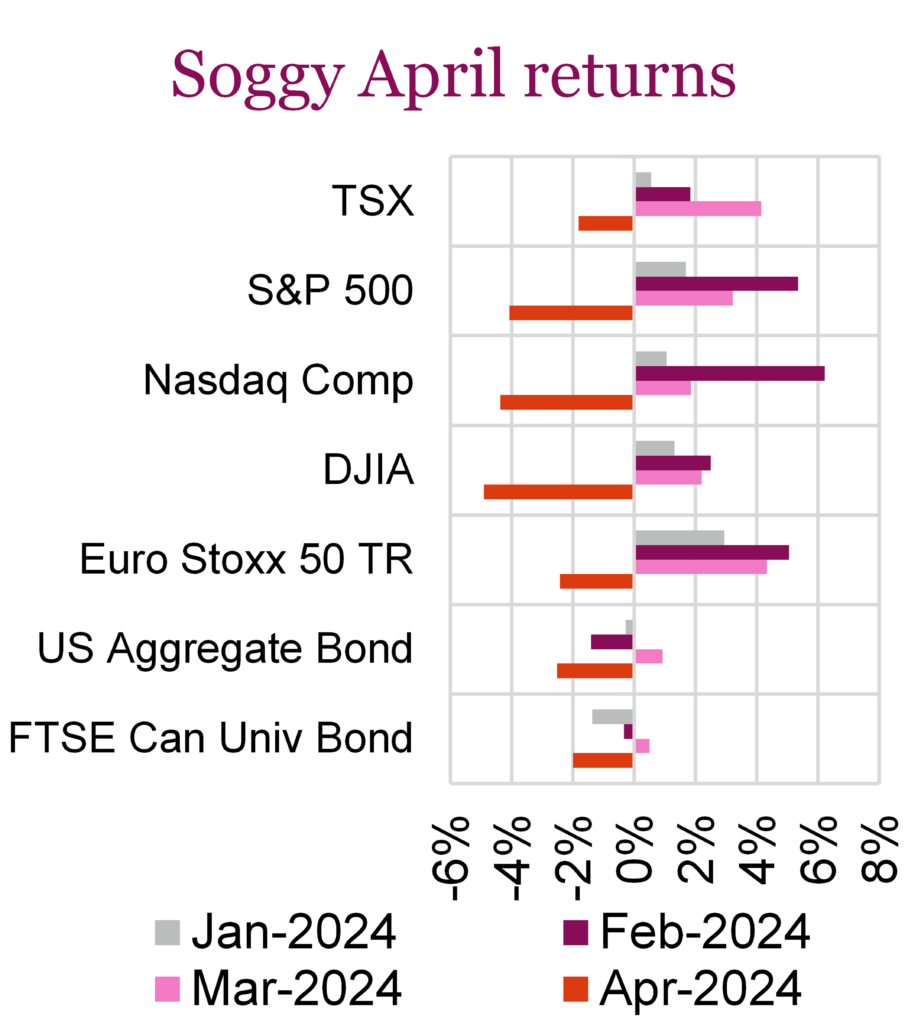
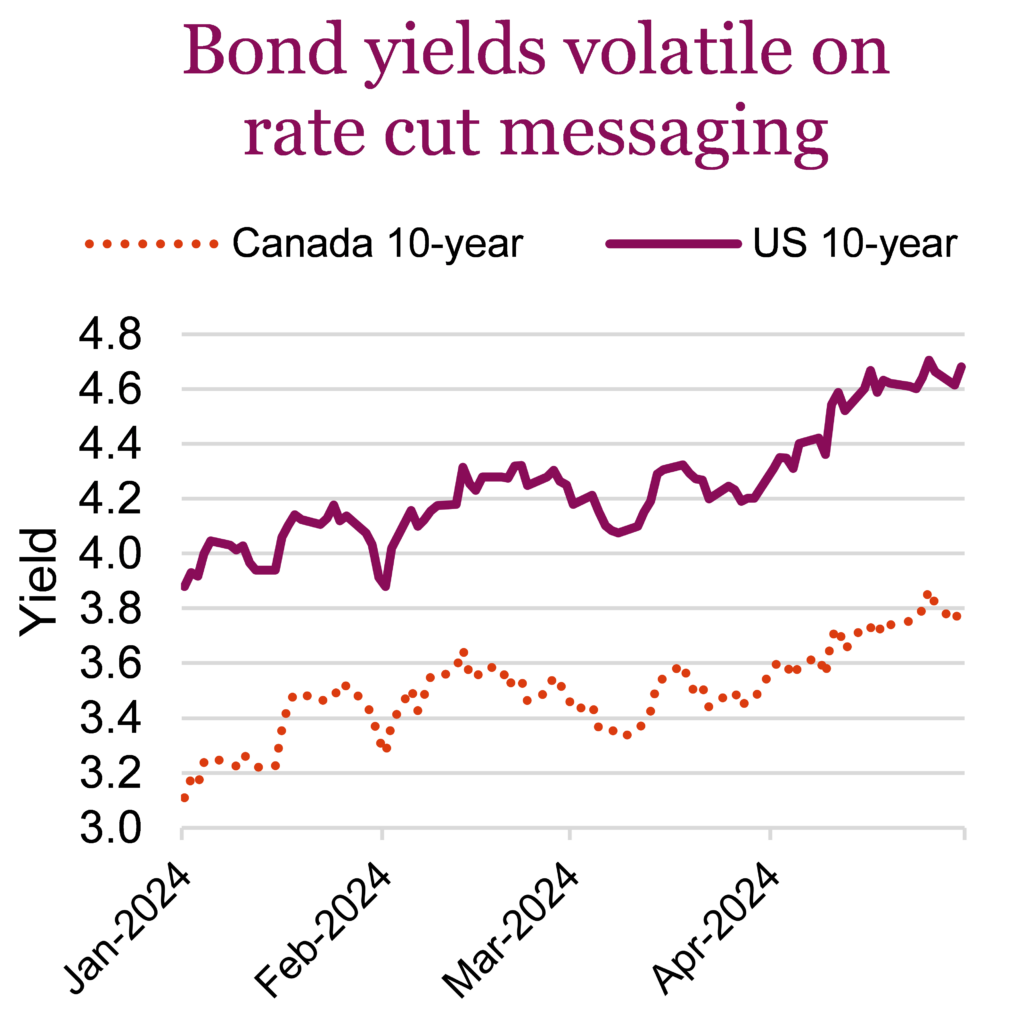
The equity rally had to slow down eventually, and that’s exactly what investors saw in April. After rallying in Q1, equity indexes took a breather in April, and for the first time this year, were down for the month. The declines came after markets adjusted their expectations for rate cuts, as data released throughout the month pointed to inflation being much stickier than previously thought. Given recent economic and inflation data, markets have pushed back on any near-term rate cuts from the Federal Reserve (Fed), with some economists even bringing up the potential for rate hikes sometime this year if inflation remains elevated. In the wake of the latest economic data, consumer confidence continued to drop as worries about inflation and concerns for the health of the labour market weigh on sentiment. On the bright side, the decline in consumer sentiment doesn’t appear to have made its way to corporate America, with the majority of Q1 earnings released over the month beating analyst estimates. All told, April’s total return for the S&P 500 and Nasdaq was -4.1% and -4.4%, respectively while the Dow fell -4.9%, its worst monthly performance since September 2022. Bonds also reacted poorly to the revised interest path to stay higher for longer, and declined in April. Bonds were also volatile in April and the FTSE Canada Universe Bond and U.S. Aggregate Bond indexes were down -2% and -2.5% respectively. Both remain in the red year-to-date. The U.S. 10-year treasury yield which started the year below 4%, hit 4.7% in April and remained above 4.5% to close out the month.
Closer to home, the Canadian economy showed signs of slowing down at the end of Q1, with preliminary data indicating unchanged GDP in March. This followed weaker-than-expected growth in February, resulting in a first-quarter GDP of 2.5%, slightly below the Bank of Canada’s (BoC) forecast of 2.8%. The report suggests limited strength in domestic demand and ongoing disinflationary pressures, potentially paving the way for interest rate cuts by the BoC as early as June. With signs that the BoC may diverge from the Fed and deliver its first interest rate cuts months before the Fed, the U.S. dollar has continued to strengthen and is up 4% YTD against the Canadian dollar. On indications that interest rates will soon be cut and helped by the strength in utilities and materials, Canadian equities fared better than its U.S. peers, with the S&P/TSX down “only” -1.8%.
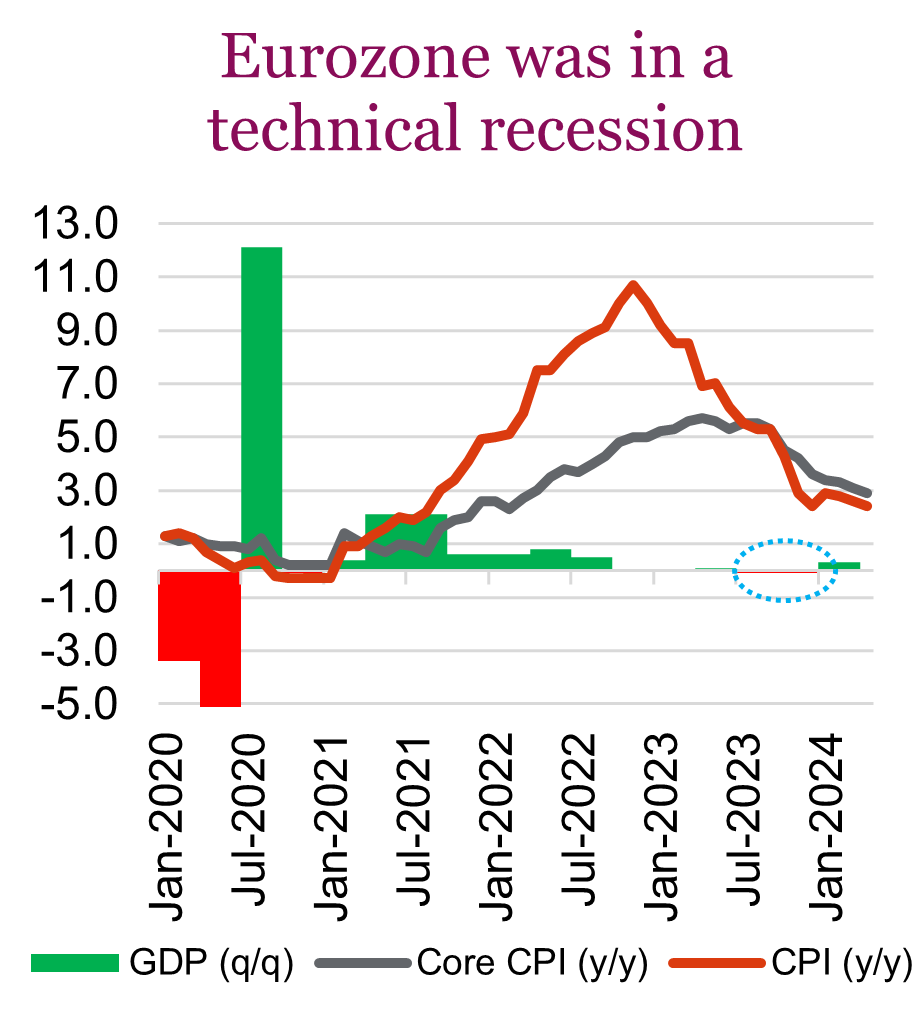
Overseas, European indexes also declined over the month, recording their first negative month since October after a flurry of earnings and data weighed on investor sentiment. Despite investor sentiment taking a hit, there was positive news on the inflation front, with Eurozone inflation at 2.4% in April and 0.8% on a monthly basis, while price increases in services, a key watched item for the European Central Bank (ECB), cooled to 3.7% from 4%. GDP for the fourth quarter of 2023 was revised from no growth to a -0.1% contraction, which means that the eurozone was in a technical recession in the second half of last year. The eurozone, however, exited its technical recession in April, as its four top economies grew higher than expected with GDP rising 0.3% over the first three months of the year, slightly better than consensus. With inflation trending down, expectations are rising that the ECB may start cutting interest rates at its next monetary policy meeting in June.
Lots of bulls and bears
Take your pick. There is no shortage of both good and bad news floating about the financial markets. To be fair, this is always the case. The hard part is understanding which side is stronger today and which side will be stronger tomorrow. With markets up low to mid-single digits year-to-date, following a very strong Q4 finish to 2023, most would agree the optimists are carrying the day at the moment.
It is not just rose-coloured glasses; there really is good news out there. Economic growth signs or momentum appear to be improving year-to-date. Dial back a few quarters, and the U.S. economy remained resilient while other economies softened or were rather lacklustre, including Canada, Europe, Japan, and China, to highlight some of the biggies. Today, while Canada is struggling, momentum in the U.S. has moved even higher, and there are signs of improvement in most jurisdictions.
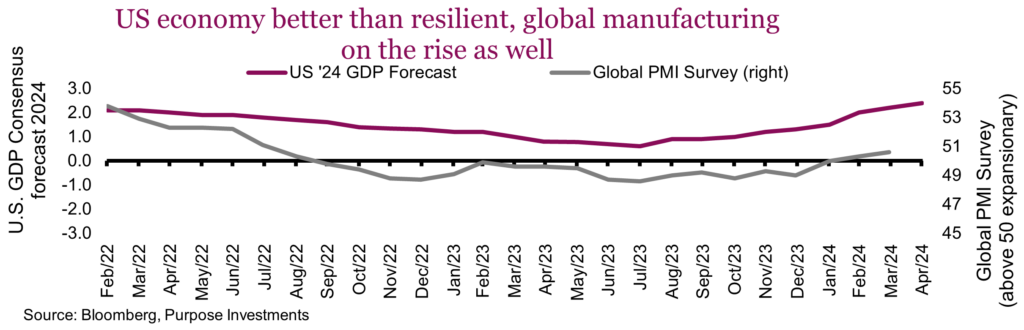
Consensus estimates for U.S. economic growth in 2024 started rising a year ago and accelerated this year. Now, when the largest economy in the world is accelerating, that certainly alleviates many of those recession fears (ourselves included; we’re still fearful but less so). Consumer confidence has been rising in the U.S. and elsewhere. Purchasing Manager surveys that track manufacturing activity have been firming up and are becoming expansionary in many countries.
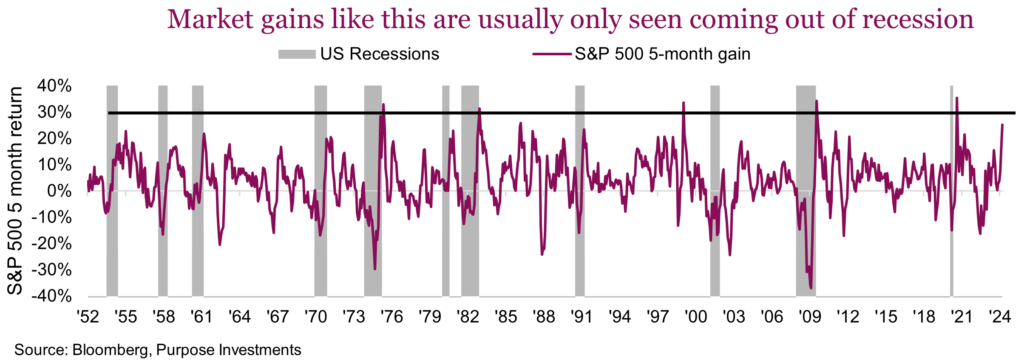
This good news has not been lost on the market. The S&P 500 has just posted back-to-back +10% quarters. The chart below is a bit selective on the time period, but a 5-month return of over 20% has rarely been seen outside of market recoveries from recessions. The market has clearly responded to the better news in fine fashion.
This move higher in the markets, which extends beyond the S&P to Japan, Europe and Canada, has pushed valuations higher. As we have harped on many times before, this market advance has not enjoyed any follow-through from earnings expectations. S&P 500 earnings estimates for 2024 have risen by a mere 1% so far this year and 2% for 2025 estimates. That’s not terrible, but given the market rally, it’s not great either. Global earnings outside the U.S. are worse, seeing 2024 and 2025 consensus estimates fall by 4%.
Higher markets with no follow-through on earnings does make for a weak foundation. Perhaps the uptick in economic data will make its way to corporate bottom lines … maybe. But it would really have to get going soon to start catching up.
A very different cycle
Every market or economic cycle is different, this one even more so for obvious reasons. Trying to ascertain what is really going on, or what is most likely to happen next, has become even more challenging due to the continued reverberations of the pandemic. Many long-standing relationships have been tested or even negated. Just look at the yield curve, which was all the talk a few years ago and now few pay it much mind. Has that relationship of an inverted 3-month/10-year yield stopped working as a precursor for a recession? We are seeing rising U.S. economic activity as the inversion is now a record at 19 months.
Broken, slow, distorted–take your pick. Only time will tell. Or how about fiscal spending, with the U.S. running its largest deficit outside war/pandemic/recession periods? Unemployment is near record lows. Is this really the time for aggressive fiscal spending/stimulus? Oh, and the monetary policy of raised rates is trying to fight inflation. If you want to lower inflation, fiscal spending levels are clearly counterproductive.
Perhaps one of the longer macro factors that can do much to explain everything for the economy and markets is money. First a little Eco101. Normally the money supply and the economy expand at roughly the same pace, with minor divergences. The money supply ballooned to combat the impact of the pandemic. There’s no question that that was the correct response. But when you create a bunch of new money much faster than the economy requires, well, weird stuff happens. More money than required results in an increase in savings. Add to this an economy that slows due to shutdowns and people unable to spend on things like travel and fancy restaurants, and well, that savings spike even faster.
As the economy and personal mobility return, all that money flows into an economy. Add lingering shortages, and presto, here comes inflation. Price inflation sucks; everyone complains about it, but have you noticed many people changing their behaviours? That trip to the South of France costs too much … still going, though. That is because there is too much money.
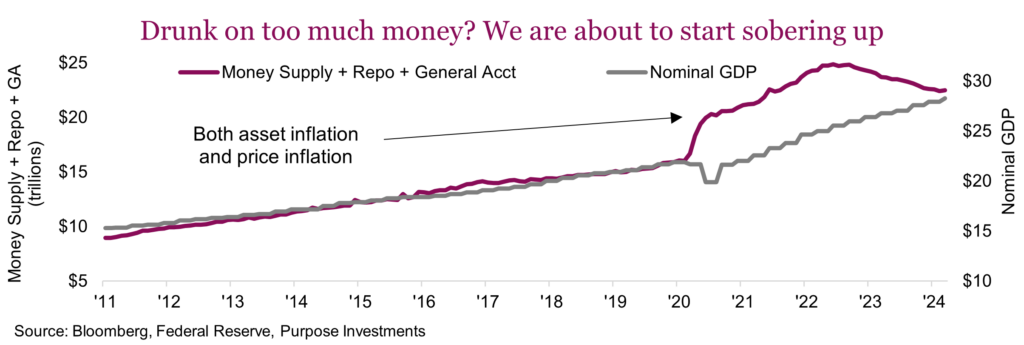
This didn’t just cause price inflation, more money leads to asset price inflation as well. That has helped stocks and real estate rise. But something is nearing inflection. Firstly, the saving rate has been falling fast, probably because price inflation is eating into disposable income and the first behaviour that suffers is savings.
Or on a more macro level, the gap between the amount of money out there and the economy is narrowing. It was that gap that fed inflation, both price and asset price inflation. When that gap closes, well, it sure isn’t good news for prices. And that gap is closing pretty fast.
Then there is what we will call the echo in global trade. As we have pointed out, there is good news on the global trade front; it appears to be improving. Exports from Korea and Taiwan, historically early change leaders in the direction of global trade volumes, have been rising. Global manufacturing has been improving. So, the question is: Is this the start of a new healthy trend, or is it an echo caused by some of the previous pandemic-induced gyrations?
When the pandemic hit, we all had way too much money and couldn’t spend it on fun, travel, eating … so everyone bought stuff. Cars, home renovations for that walk-in wine cellar, then some wine, new TVs, etc. Add logistic and supply chain bottlenecks, and we kind of blew things up with this changed behaviour. As supply gradually caught up with demand, the global economy enjoyed the best of times, factories humming, ships full of stuff on their way to consumers. Evidence of this can be seen in global container volumes dropping in the first half of 2020, then increasing well above trend in 2021.
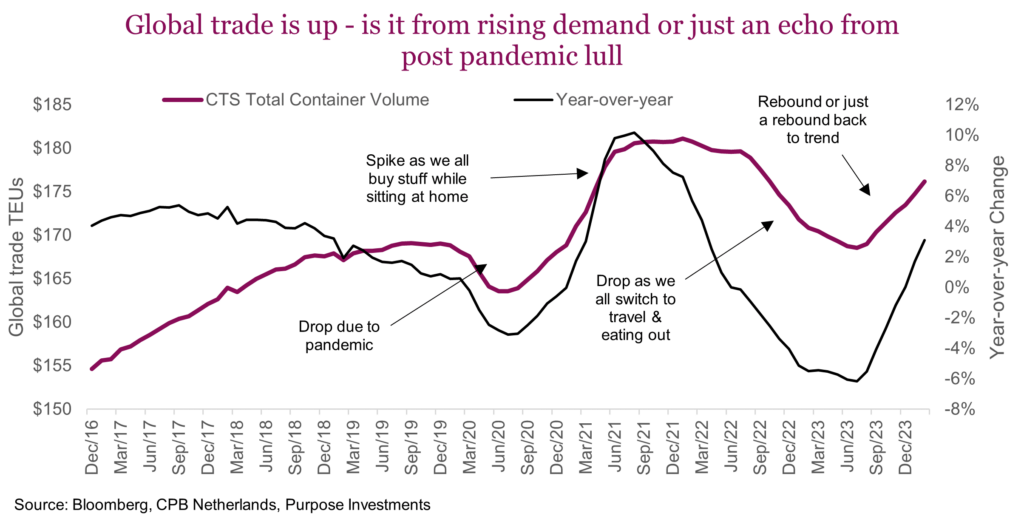
We all know how this story unfolded. Once mobility returned, revenge travel became the rage and people slowed down buying stuff. Cars, TVs, renovations had all finally been done or the latest version purchased so as we pivoted our behaviours and global trade fell back down. Planes and restaurants filled up, and inflation took off. During this period, our team debated whether this drop in trade and manufacturing activity could cause everyone to ring the recession warning bell while it was just another pandemic pivot of behaviour. In hindsight it does look like that was the case.
Now we see trade and activity turning back up, and everyone is convinced that global economic growth is on its way back up. Maybe. Or this move up is just another pandemic reverberation. As revenge travel fades and normal spending returns, it could easily look like growth given trade/manufacturing has fallen so low … the echo.
Dividend divergence
Higher yields in the bond market have weighed very heavily on dividend-paying equities; after all, bonds are a clear competing investment for investors looking for income, and those bonds pay more now than before. This weakness in the dividend space has created a potential opportunity given valuations and rather juicy dividend yields (before or after tax). However, higher yields, inflation, and growth gyrations have increased performance dispersion in the dividend space. We believe a more active or rotational approach to dividend investing has become more optimal. But first, a bedtime story.
We all remember the fairy tale. A girl wanders through the forest and into a bear house. She’s rather picky but tries all the food, the chairs and the beds looking for one that is ‘just right.’ The tale has been around for at least two centuries. The traditional story concludes with Goldilocks running away from the bears’ house after they discover her sleeping in baby bear’s bed. In theory, Goldilocks was a fussy home invader who would very likely meet her demise in the shadow of the bears’ wrath. In the true-to-life version, her actions lead her into a very serious situation. In every perfect Goldilocks environment, the situation can change in an instant when the bears return home and discover that someone has eaten their dinner. You hear the word Goldilocks a lot at present. It’s the phrase used to explain the perfect environment, when markets just go up with no solid reason, except for everything is “not too hot, not too cold, but just right.”
In 2024, inflation is the big bad bear coming back home. Its steady easing has halted, even reversed somewhat, and this has reduced the odds and timing of global central banks cutting rates. Bond yields have risen considerably, approaching their 2023 highs. The current level of Canadian and U.S. bond yields is not cripplingly high but high enough for investors to reevaluate their options and expectations. The buy-anything period is likely over, at least for now, and markets are entering a more volatile period; perhaps by circumstance, the timing also aligns with weaker seasonality. While the round trip of rate expectations has only recently impacted broader equity markets, the dividend space has been feeling the impact of higher bond yields for some time. Higher for longer, brings with it a unique set of risks to the dividend space. This has made the dividend space more challenging, and we believe increases the need for a more active management approach.
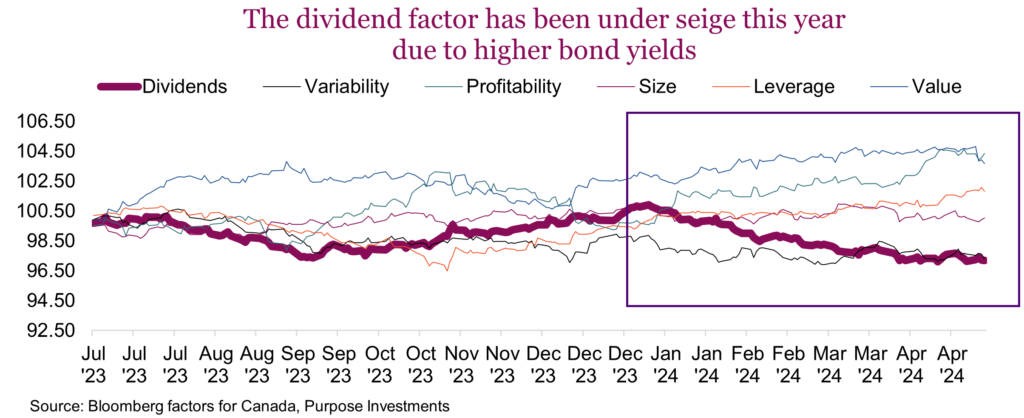
The dividend factor (aka dividend stocks) has lagged other factors all year. While unfortunate, this has also created a bit of an opportunity. There are now many companies carrying dividend yields of 6% or 7%, that are pretty safe dividends. The challenge has become not just whether to add to dividend strategies, but how. Divergence in performance within the dividend space has increased, which means it’s no longer best just to add anything with a yield to a portfolio. Not all yields are created equal, and the winning or losing factors keep changing.
We believe a more flexible approach, or a more active management approach, can better adapt to these changing market conditions. Especially compared to a more passive or index-hugging strategy.
Index misallocations – Let’s face it: The TSX is concentrated on Financials and Energy. Passive funds screening on yield amplifies the concentration risks. One of the more popular dividend ETFs has 56% of the fund allocated to Financials. These misallocations expose investors to higher sector-specific risks. Active management done right improves diversification and can reduce this concentration risk.
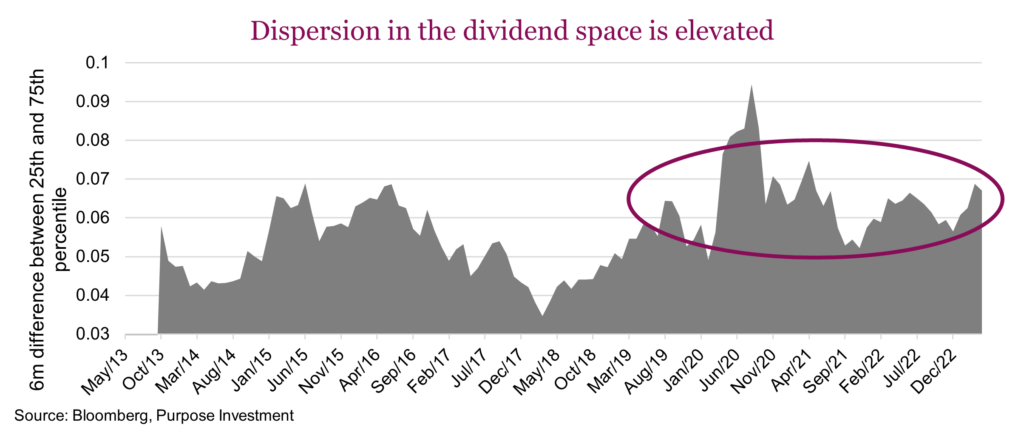
Dispersion – Active managers are particularly challenged in periods when dispersion is low and market leadership comes from extremely large stocks. When all the dividend stocks move together, who cares how you get exposure? But when the performance dispersion is high among dividend stocks, it does matter how you are exposed. Dispersion across the dividend space is quite high and variability among dividend strategies in Canada is also on the rise. In the chart below, we look back at the Dow Jones Canada Select Dividend universe and plot the monthly return difference between the 25th and 75th percentile. Outside of the crisis period in 2020, the average dispersion this year is near the highs.
Volatile periods – Higher rates tend to increase volatility. Passive indexing tends to struggle when markets get choppy, whereas active managers can be nimble by raising cash or actively increasing company exposure to more defensive sectors. This proactive approach allows managers to manage risks, especially when it’s those most rate-sensitive sectors that are under pressure.
Unusual macro forces – Higher rates create market tension, especially for high-duration assets and highly leveraged companies. Active managers can identify and avoid companies that may have a high dividend yield but are vulnerable to rising borrowing costs. When rates are high, market inefficiencies tend to arise.
Canadians love dividends, but most active funds aren’t very active
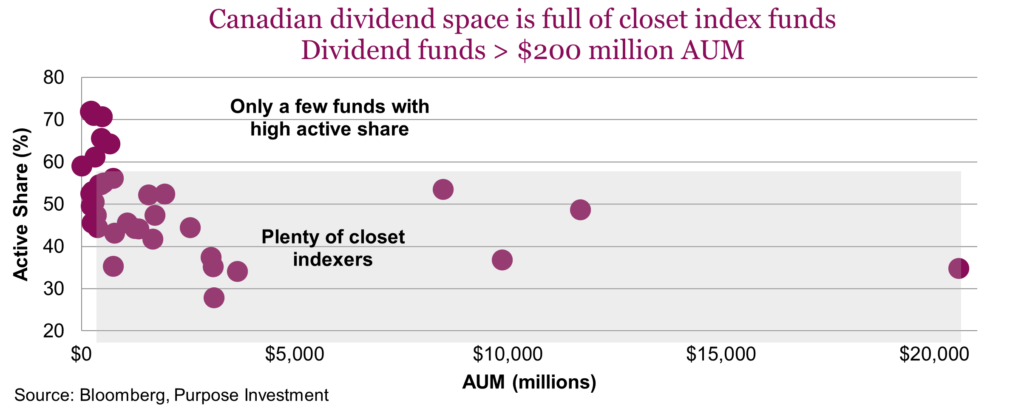
There are dozens of dividend and income-focused funds and ETFs in Canada. Within the Morningstar Canadian Dividend and Income Equity category, there is no shortage of options. Among them are the bank-owned behemoths, with the top four funds managing over $50 billion dollars. When dissecting the universe, an important metric to look at is the active share, which establishes the percentage of holdings that differ from the benchmark index. A portfolio with an active share between 20% and 60% is considered a closet indexer. Among these behemoths, the active share is as low as 35%, and the highest is just 53%. The category average active share for funds over $200 million is just 50%. In effect, the category is rife with closet indexers, as seen in the chart below. Most ‘active’ managers tend to look very much like the index. Liquidity also plays a part. The bigger the fund, the more difficult it is to look very different than the index, but that’s not the only reason. Career risk for portfolio managers is also a consideration. Our view is that it’s impossible to beat the market if you look like the market. Managers must strive to earn the fee they charge.
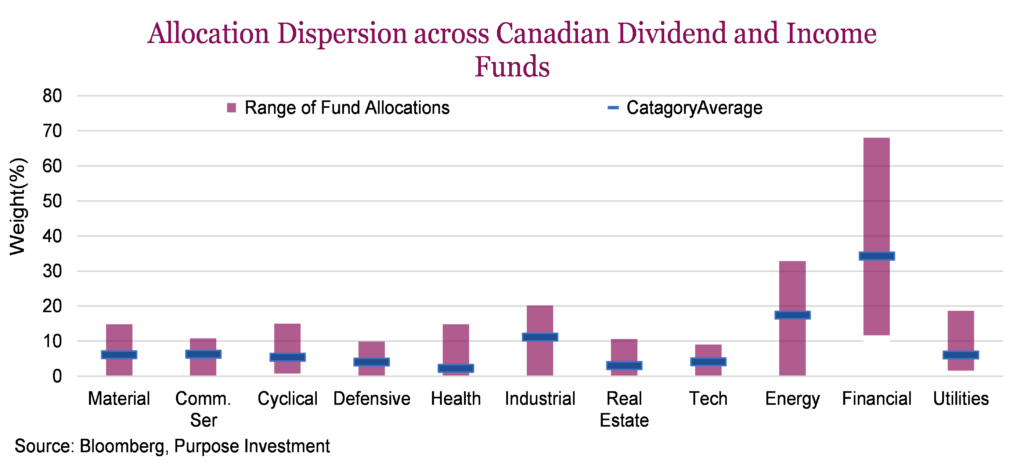
Digging deeper, in the chart below we have the sector allocations across the category. The vertical bars represent the range from maximum to minimum allocation for the sector with the category average. By and large, most sectors have a somewhat limited exposure range, with the real major differences coming largely from the Energy and Financial sectors. These two sectors are where active managers can make a meaningful distinction from both the index as well as peers.
Building a sustainable and high-performing dividend portfolio in Canada requires a keen eye and strategic selection. Active management empowers managers to go beyond the limitations of passive indexing, seeking out hidden gems, prioritizing quality over just high yields, and adapting to changing market conditions. Canadian dividend-paying companies make up the core of many advisor models and investor portfolios. Passive strategies play a key role in building robust portfolios to help reduce costs and provide broad market beta, but active management best suits the dividend-focused core, especially in present market conditions.
Final thoughts
There is lots of good and bad news these days. Challenges are this pesky inflation, stubborn earnings growth, valuations, and still-lingering impacts of pandemic-induced behavioral changes. On the good side, there are some pockets of really attractive valuations, such as in the dividend space, and an economy that appears to be gaining a bit of momentum that could help address the lack of earnings revisions. While our fear of a recession has diminished over the past few months, the risk of a price correction remains elevated. It has been a good start to the year, but very likely many twists and turns remain.