
Sign up here to receive the Market Ethos by email.
April 2023.
Investor Strategy.
Executive summary
Inflation cooling, upcoming market reaction to earnings, and fading concerns over the banks may lift markets, but for how long? The economic concerns were real a month ago with leading indicators, recession probabilities high, yield curve inverted. and a negative wealth effect. Not to mention the delayed toll rate hikes have on economic activity. With banks likely to become increasingly conservative (aka tightening financial conditions), the risk of a slowdown has certainly risen during the month of March. The economy will very likely slow, it may slow a lot or a little. And markets do not appear to be priced for either scenario.
We believe investors should continue to tilt their portfolios towards the defensive side of their long-term strategic allocation and among mandates.
March Madness?
Despite hitting several roadblocks over the quarter, equities and bonds saw decent returns in March, helping markets finish strongly over the quarter. Global markets started 2023 with optimism, with China showing signs of stronger-than-expected growth, inflation easing among developed nations, and data signaling that central banks may be able to pull off a soft landing. The prospect of another financial crisis threw a wrench into the mix due to the collapse of Silicon Valley Bank (more in Market Insights: Yielding to SVB) and other U.S. regional lenders. In response, central banks and larger lenders kicked into action, guaranteeing full deposits, implementing a deposit flight facility, forcing liquidation of impaired securities portfolios, and stepping in to help smaller banks with funding pressures. Concerns around the banking sector only grew when Credit Suisse saw a historic collapse after Saudi National Bank declined to offer more support. Again, a last-minute rescue was orchestrated with UBS to prevent the crisis from spreading.
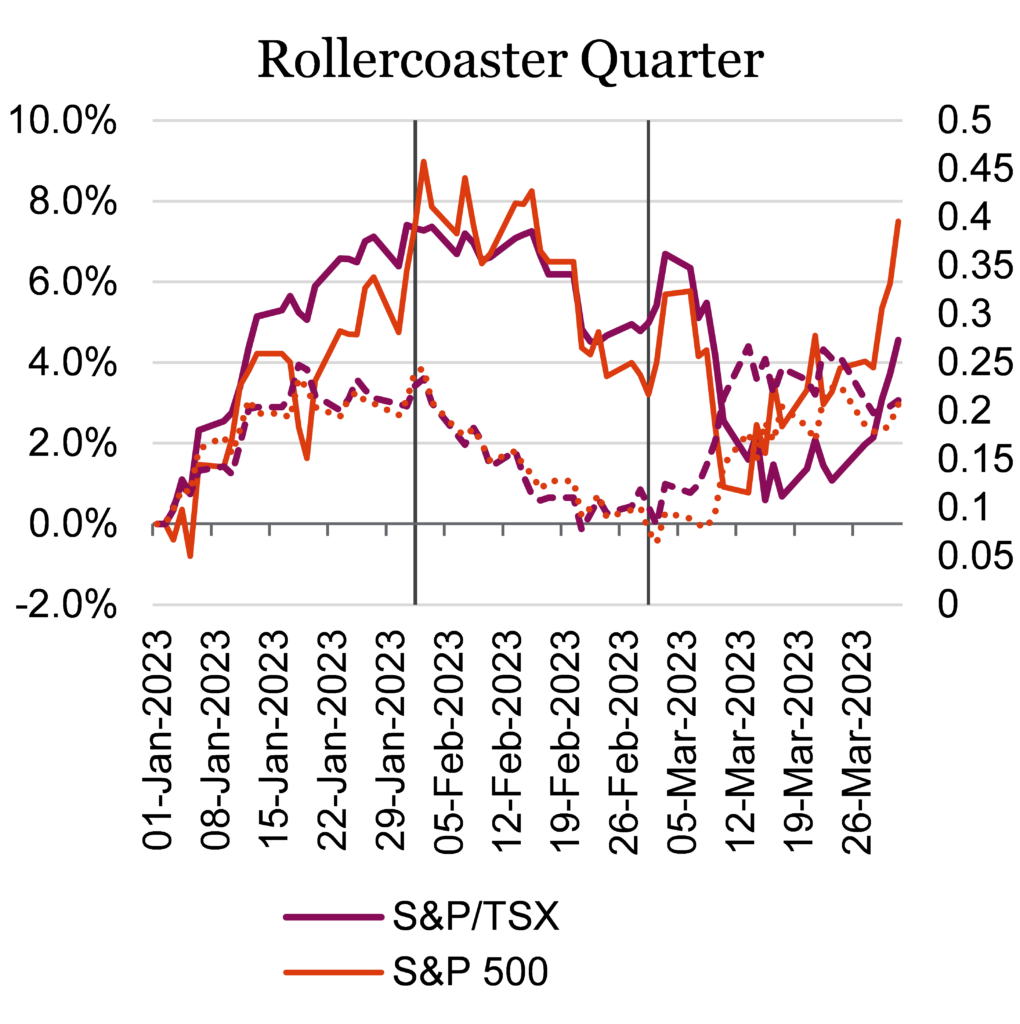
On the economic front, investors were encouraged when it was reported that many major economies saw inflation continue to moderate. In the U.S., CPI has dropped from a 40-plus year high of 9.1% in June of 2022 all the way down to 6.0% as of February of this year. Canada’s CPI has also been trending down, reaching 5.2% in February from a high of 8.1% last year. Despite inflation remaining far above both the Fed’s and BoC’s long-term average target level of 2%, equity and bond markets got a boost after the Fed’s preferred inflation gauge, the Personal Consumption Expenditures index, showed a cooler-than-expected print, rising 0.3% in February. This pushed the Nasdaq to rise 6.7% in March and 16.8% over the quarter, its best quarter since 2020. Other major North American indexes also finished the quarter on a positive note. The TSX fell -0.2% in March, but closed the quarter up 4.6%, while the S&P 500 gained 3.7% in March and finished 7.5% in the first quarter, all on a total return basis.
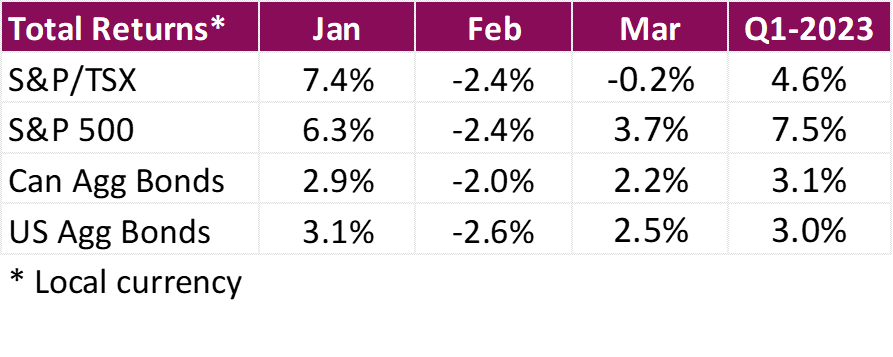
In Canada, the BoC kept interest rates at 4.5%. The widely expected decision marked the first time in more than a year that the central bank decided not to raise rates. Officials were quick to note that there is still work to be done and further hikes are still in the cards. This can especially be seen in the GDP numbers which showed the Canadian economy growing more than expected. The economy grew by 0.5% in January, ahead of analysts’ forecasts of a 0.4% rise, after a -0.1% contraction in December, fueling concerns that inflation has yet to be fully tamed. When it was all said and done, the Canadian aggregate bond index rose 2.2% in March, and finished the quarter 3.1% higher.
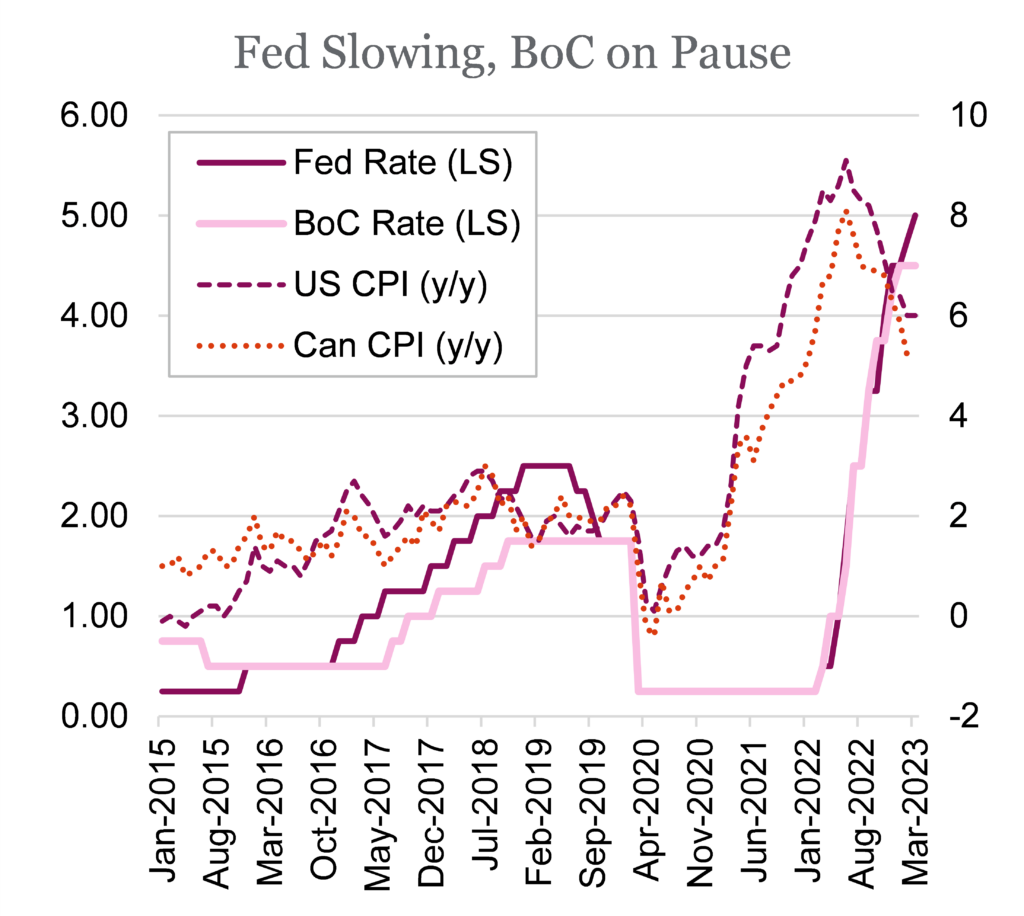
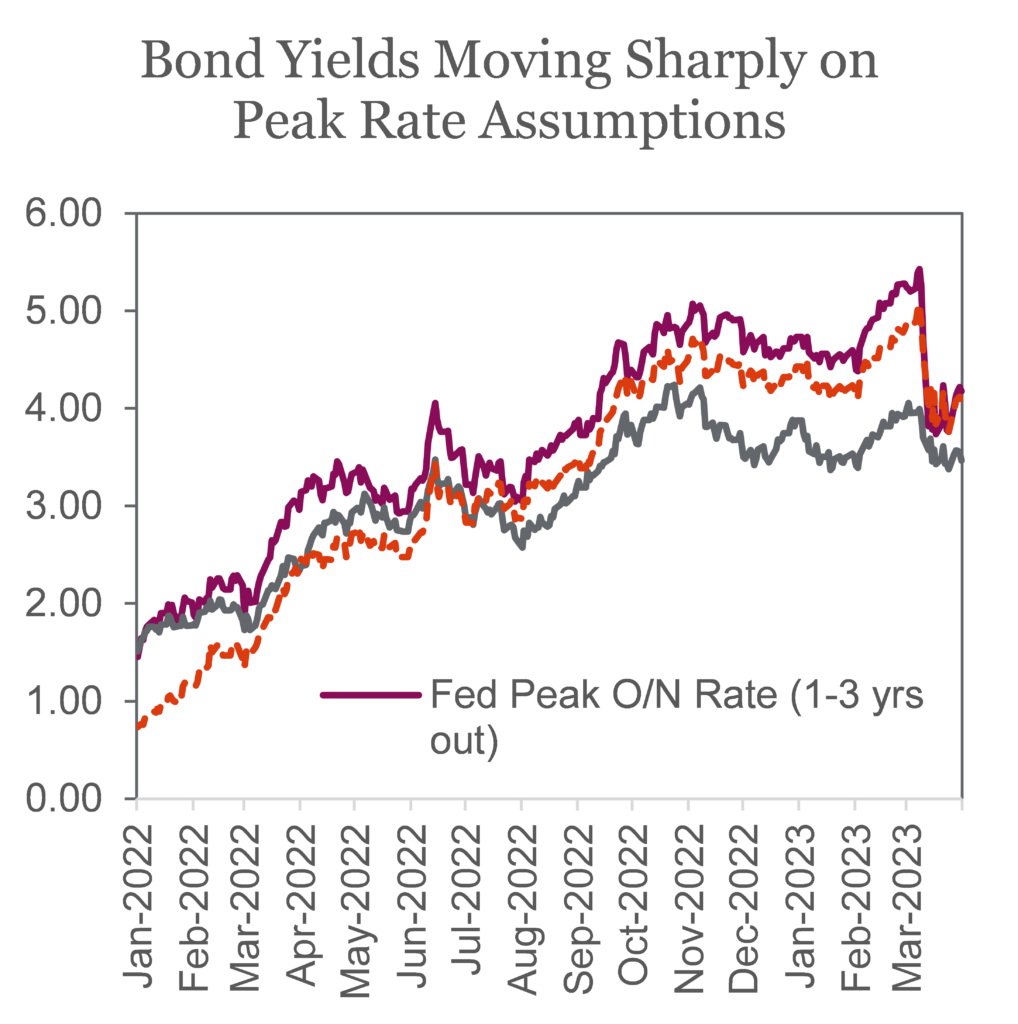
Bond yields fell sharply towards the end of the quarter amid growing expectations the Fed may be tempted to hit pause on further rate hikes. Going into the year, expectations were that the Fed might lower rates based on promising inflation data, however, those prosects were squashed after Fed Chair Powell doubled down, stating that rates will remain higher for longer based on data. Things flipped again when the banking troubles began, with many expecting the Fed to pause rates in order to avoid another financial crisis. In the end, the Fed raised rates by 25 bps, a sign that they believe that they are approaching an end to their aggressive tightening campaign while also not claiming defeat over inflation. The raise marked the central bank’s ninth rate hike of the past year, bringing its target policy rate to a range of 4.75% to 5%, the highest level since 2007.
Active defense
Investing is never easy, even at times like back in 2021 when it actually was easy. Just about everything went up that year and this year isn’t that. Markets enjoyed a strong start to 2023, lifted by some optimism that inflation risk was fading. This triggered a reversal; whatever fell the most in 2022, rose the most out of the gate. This quickly faltered as inflation’s path lower proved not to be a smooth straight line.
Then we have this current bank flare up. As we penned a few weeks back, this is not 2008 and will likely pass. It is more about the stresses of higher yields and a potential recession on the horizon; business models that are more fragile are becoming apparent. This is kind of what happens when a potential recession is approaching and the tide is starting to go out. Who is wearing the appropriate dungarees and who is not. The good news is the stresses appear to be fading, and markets are reacting positively.
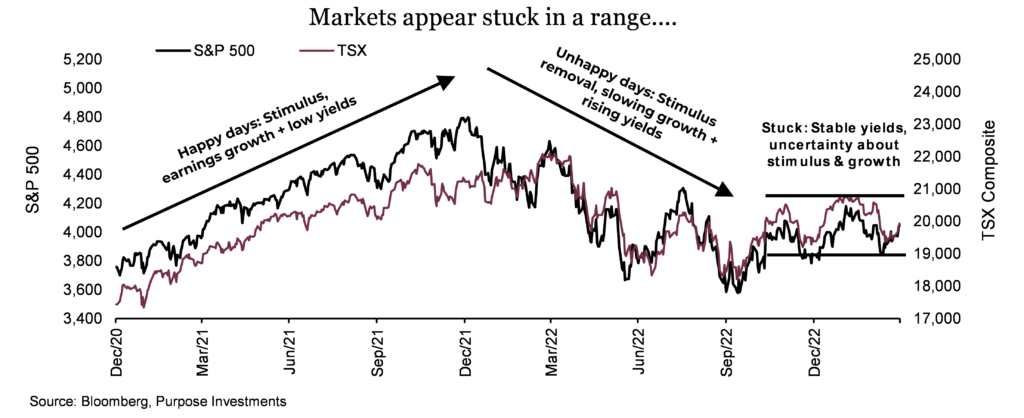
Q1 of 2023 had a lot of twists and turns but in the end the markets have remained stuck in the same range as they sat during Q4 of 2022. The longer markets remain in this narrow-ish range, the bigger the potential move when it ends. Now it is not lost on us that move could be up. Most investors are tilted towards defense these days and the market often moves to prove the maximum people wrong. But that is not our base case.
Inflation cooling, upcoming market reaction to earnings, fading concerns over the banks may lift markets but for how long? The economic concerns were real a month ago with leading indicators, recession probabilities high, yield curve inverted and a negative wealth effect. Not to mention the delayed toll rate hikes have on economic activity. With banks likely to become increasingly conservative (aka tightening financial conditions), the risk of a slowdown has certainly risen during the month of March. The economy will very likely slow, it may slow a lot or a little. And markets do not appear to be priced for either scenario.
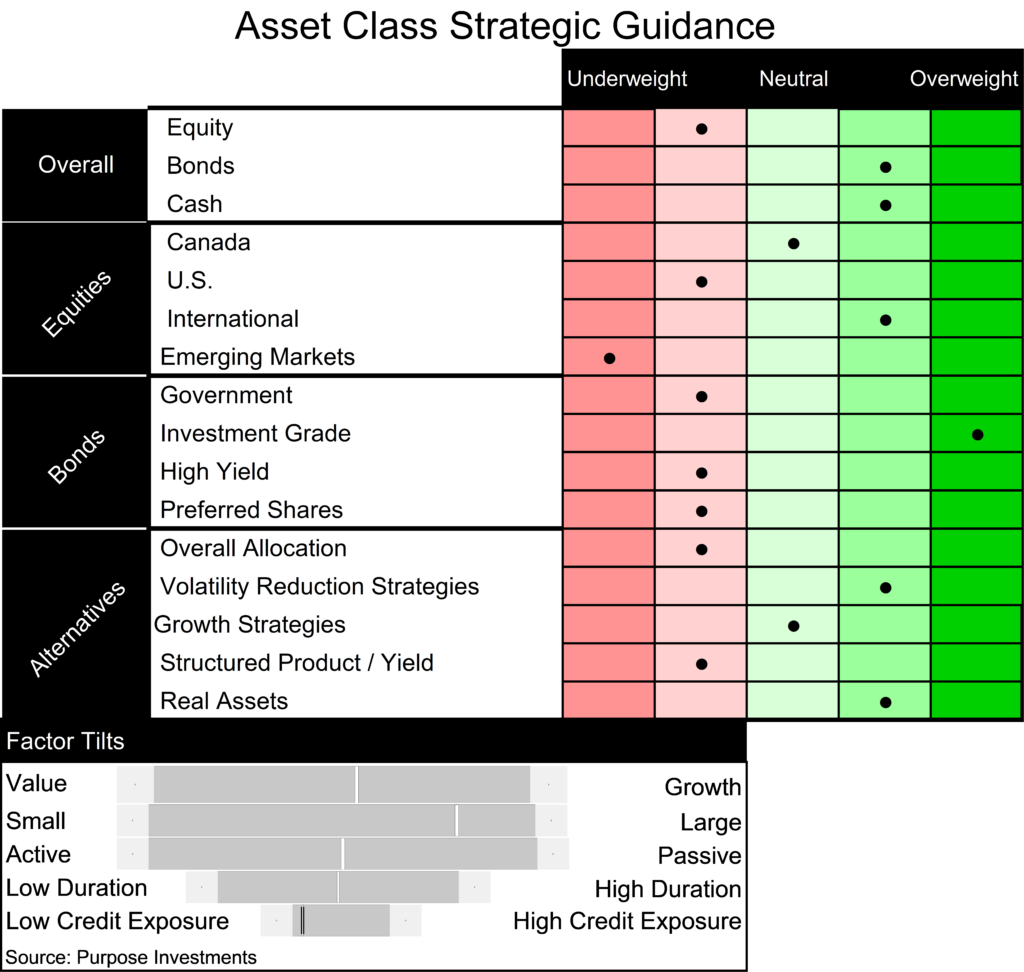
We believe investors should continue to tilt their portfolios towards the defensive side of their long-term strategic allocation and among mandates. This ‘active defense’ can take many forms:
Active asset allocation – Currently in our portfolio construction recommendation and tilts we have a small underweight in equities and a slight overweight in bonds & cash. The market declines of the past year+ have certainly priced in some of the risks and bad news. However, we believe the up probability and magnitude is less than the down probability and magnitude. While our plans often change, currently we would become a bit more bearish if the market advanced 5-10% and a bit more bullish if the market dropped 5-10%.
Another approach for active asset allocation is incorporating a tactical rules-based strategy. This can automate or outsource the tough asset mix decisions to strategies designed to tilt the overall portfolios asset mix.
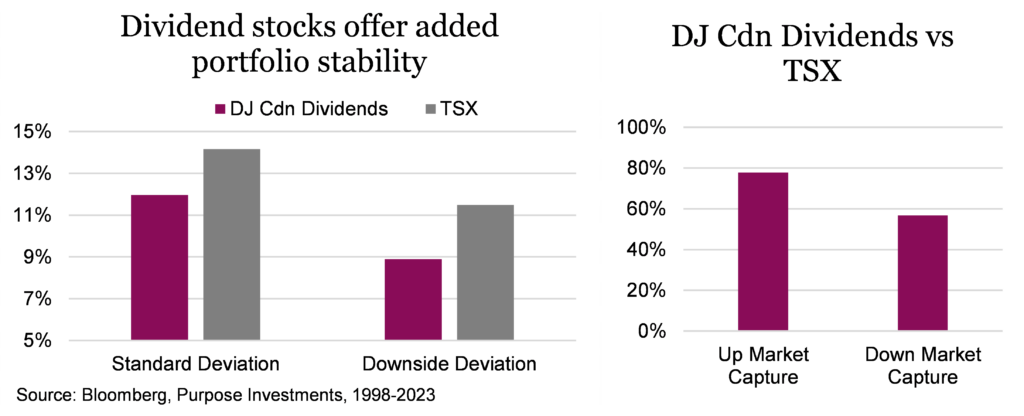
Active dividends – Dividend strategies, a subset of the value factor, have a long history of providing returns with a beta below 1. Given our view that even beyond the near term, economic growth and inflation will be more variable, value/dividends should perform better in this kind of environment. As such, we believe tilting equity allocations towards value/dividends is prudent in the near and longer term.
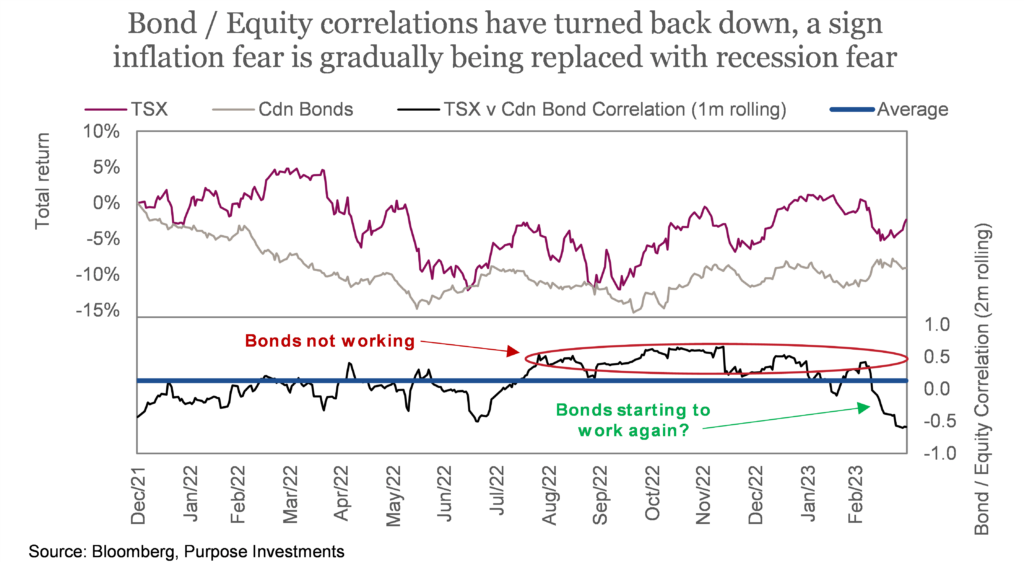
Duration – Bond duration, the sensitivities to changes in yields, was a four-letter word in 2022. However, the correlation between equities and bonds has been coming down and is now negative. Plus, if inflation risk/fear is going to transition to recession risk/fear, duration will once again become a portfolio’s friend. As such, we have become more comfortable holding higher duration bonds in the current environment.
Active cash – Cash does not offer the portfolio counterbalance that bonds provide should we head into an economic slowdown, but with a 4-5% yield, there’s no denying it is attractive. It also offers optionality to allocate should opportunities arise. Not surprising much new money of late has been parked in cash – it is nice to get paid to park.
Defensive alternatives – While our current tilt towards alternatives is lighter than years past, mainly thanks to bonds becoming bonds again, we do continue to lean on defensive strategies. Market neutral, long short and real assets are often well designed for a tougher economic environment that may lay ahead.
Please don’t take our list of active defensive thoughts as being super bearish. If we were, the underweight in equities would not be characterized as ‘small’. There are positives out there. Earnings season is about to start and many of the past seasons have seen markets rise. The economic data, which we do believe will soften, has generally been ticking higher so far this year (see Market Cycle section below).
When risk-free is 4.5%
Money flows are interesting in normal times, and these times are not normal. For starters, after yielding virtually nothing for many years, cash now has an attractive yield. If you assume equities return 7-8% (long-term compound annual return, admittedly with a lot of variance around that number), are those few extra points worth the risk? And if you are even partially bearish given rising recession risk, well that certainly makes cash look even more attractive. After many conversations with advisors, new money appears largely destined for cash these days.
Adding to the complexity of money flows is the banks. Deposits have been on the move for months as more attractive yields encouraged many to drain their deposits and put the money somewhere that receives a return like GICs, HISA or elsewhere. Much of this money is actually just going back to the banks, in aggregate, at a higher cost. But each bank has a different deposit base, which has various levels of ‘deposit stickiness’. These bank deposit moves may largely all cancel out in the end, but some banks have been big winners, some big losers.
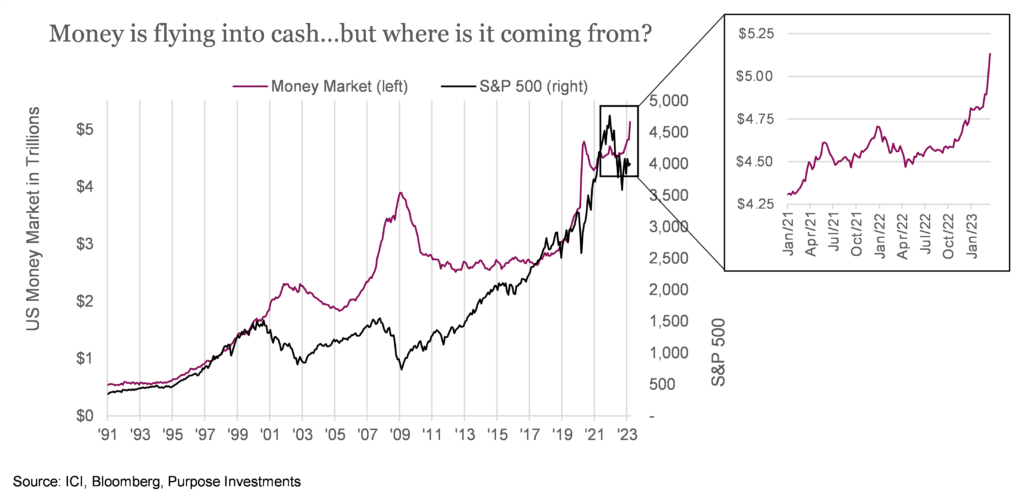
Not all the money has been going from one bank to another; a decent chunk is flowing into money market instruments, some into gold, hell, even some into crypto. The chart above goes back to the 1990s and really highlights flows into cash vehicles over time. But it is the source of where that cash came from that is critical. If money market assets are growing with the markets, that is simply just everyone’s pie getting bigger and so cash assets go up as well. This was the case in the 1990s and mid-00s, perfectly normal. This did not occur in the mid-10s as yields were too low.
The recent rise in money market assets that has accelerated in the past few weeks is not being caused by rising wealth. Very few are materially wealthier today compared to the end of 2021 and nobody got rich in the last few weeks (that we know of). These inflows into money markets have largely been coming from bank accounts during the past year. Which can be challenging for banks but isn’t really that destabilizing as it had been gradual. The spike in the past few weeks … that is another story.
So far the spike of assets flowing into money market vehicles has been coming from bank accounts and not from other market assets such as equities or bonds. This can be seen in the fund flows for equities and bonds in the chart on the right. The question is, what happens next? If the money on the sidelines, which is building up, decides the risk/return of the market is attractive, a good-sized wall of money could lift the market higher. Possible but so is the opposite: reducing market exposure enticed by the attractive and relative safety of cash.
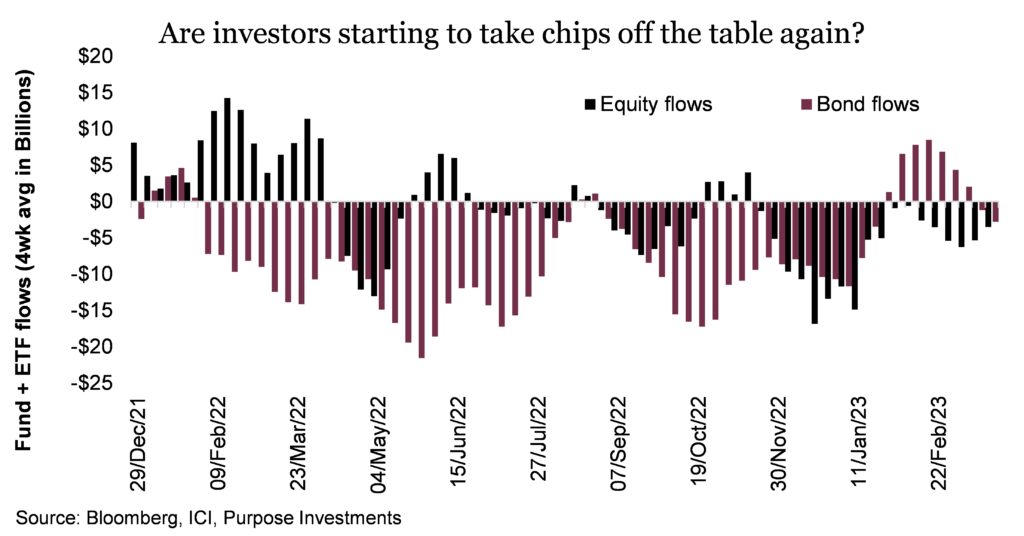
Wherever the money flows, so goes the market. We are still in the parking stage, and new money seems content to simply park in cash. Risk appetite will be the key determinant which could see the sideline cash come into the market or if cash will start to take market share from equities and bonds.
Market cycle
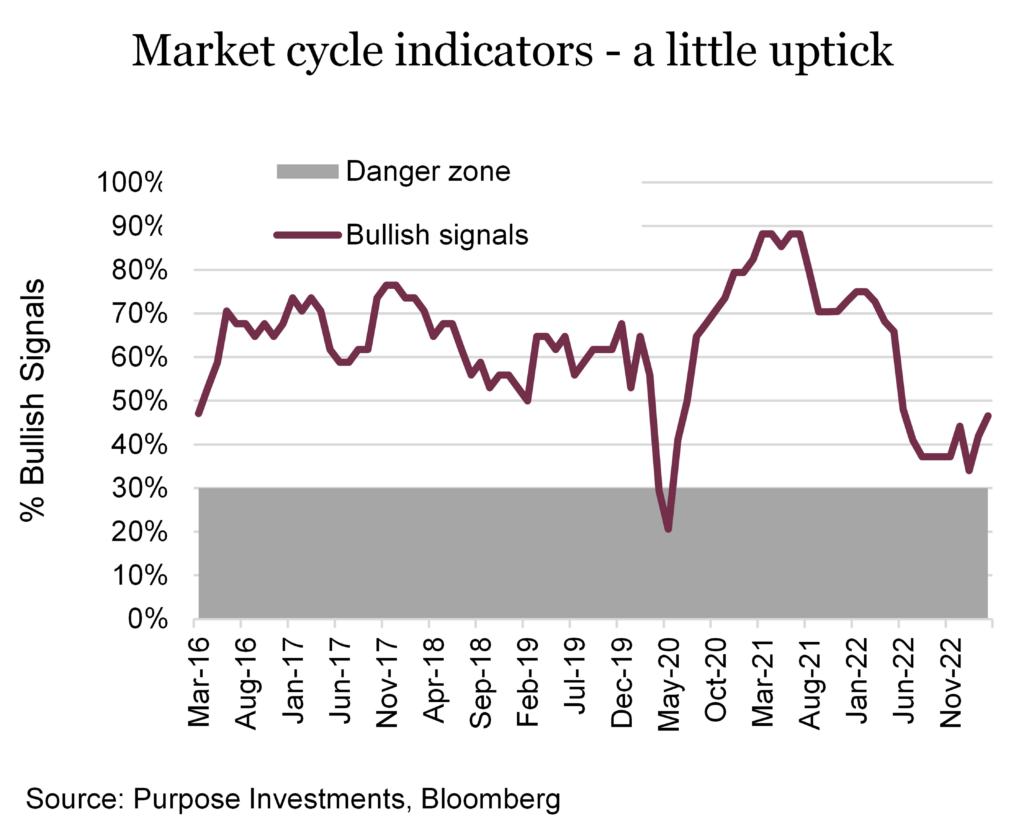
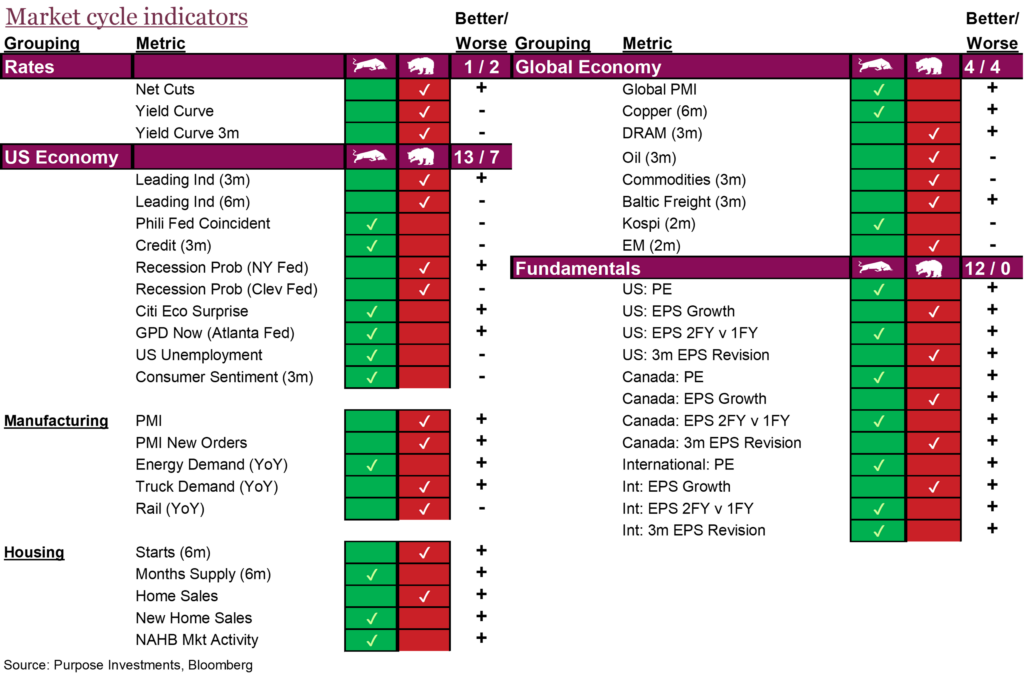
There is some good news on the market cycle – things have improved a bit. While most signals remained stable, there was an improvement in U.S. manufacturing, with energy demand starting to rise, and an improvement in the price of copper, a decent proxy for global economic activity. There are also more signals improving versus deteriorating.
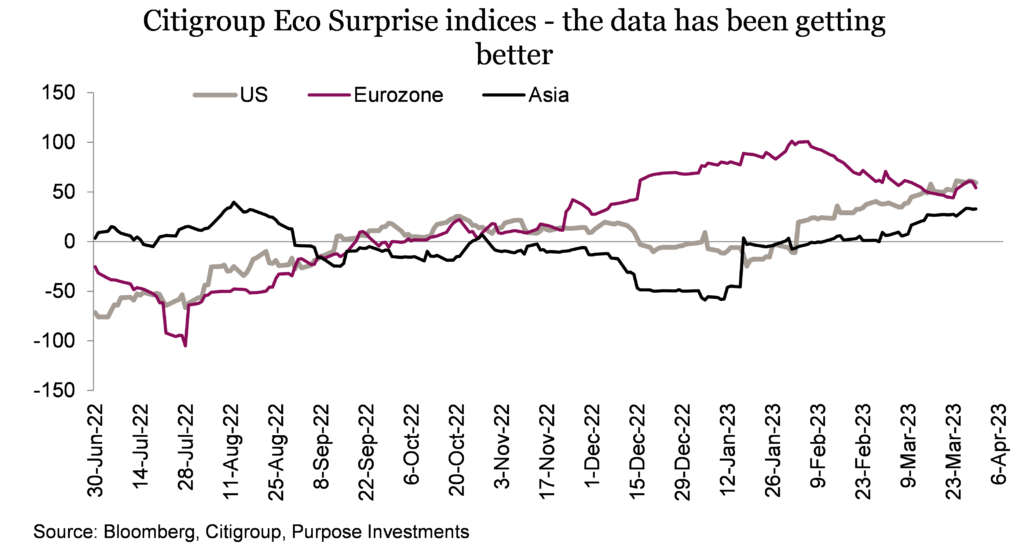
Overall, not too surprising, given the economic data so far this year has proven more resilient than most had expected. This can easily be seen in the CitiGroup Economic Surprise indices. Europe surprised first, although now fading, but the U.S. and Asia are on the rise. We do question how long this optimism will last, and the upcoming earnings season may contain clues. As will the lagged impact of the rate hikes over the past year and the increasing conservatism among global banks.
Portfolio positioning
The benefits of a portfolio design allow the investor to be active in their decision making. As written in the Active Defense section of this Investor Strategy, this strategy can take many forms.
In our strategic portfolios, we recently reduced our international equities in favor of Canadian fixed income. Check out the cooling on International and Warming to bonds section of last month’s Investor Strategy for a more in-depth rationale (Looking through the zigs and zags). International equities had been on a tear of outperformance. Rightfully so, with depressed valuations and currencies, volatile inflation, and rates, the environment was set up nicely for the less concentrated value-driven international markets to outperform.
We believe this type of environment will continue, which is why you do not see a reduction in the overweight of international equities. The adjustment was a short-term trim of our overweight internationally. With our increase in the cash balance, we decided to deploy the proceeds into the Canadian fixed-income aggregate universe. We believe the scale is modestly stacked in favour of bonds in the near term, especially if the economy starts to meaningfully slow down. Tilting towards defense is as simple as that, when managing structured investment portfolios. In a perfect world, later this year we will be adding back to international equities at the expense of our overweight in fixed income.
It has been a long road back to cash having a meaningful presence in portfolios. While rising rates can be concerning in many parts of a portfolio, a positive benefactor is the cash sleeve of the portfolio. For this reason, we have remained overweight cash in our portfolio. Making this active decision to overweight the cash sleeve can be considered another form of active defense for portfolios, especially when it comes to the specific client. A client with a low-risk tolerance can now earn upwards of 5% per year on cash which might be their long-term annualized goal. While we do not suggest being 100% cash in any portfolio for various reasons, an elevated cash balance would be more prudent for a low-risk client than a high-risk client.
Getting a little hedgy
Between the spectrum of completely unhedged currency exposure to fully hedged lies an area where portfolio managers can be active subject to market conditions. We continue to stress the importance of being active, and properly timed tactical hedges, either full or partial, can deliver alpha. In general, we are not big proponents of hedging, especially against the U.S. dollar. The greenback has special benefits as a reserve currency. During times of economic uncertainty, its risk-off attributes tend to shine compared to our economic-sensitive loonie. This is a feature, not a bug and is one of the reasons why our base case is not to hedge U.S. currency. However, with CAD/USD in the low 70’s we’re increasingly inclined to begin to hedge some of our U.S. exposure.
This view does not apply to international holdings, where we prefer unhedged. Potential currency appreciation across Europe and Japan in particular are a primary reason for this stance. Last year we saw the U.S. dollar rise to its highest level in 20 years against the euro, and its highest level in 30 years against the yen. 2022 was a story of dollar dominance. But now, The Fed is no longer in the driver’s seat — and you see that playing out across the foreign exchange market.
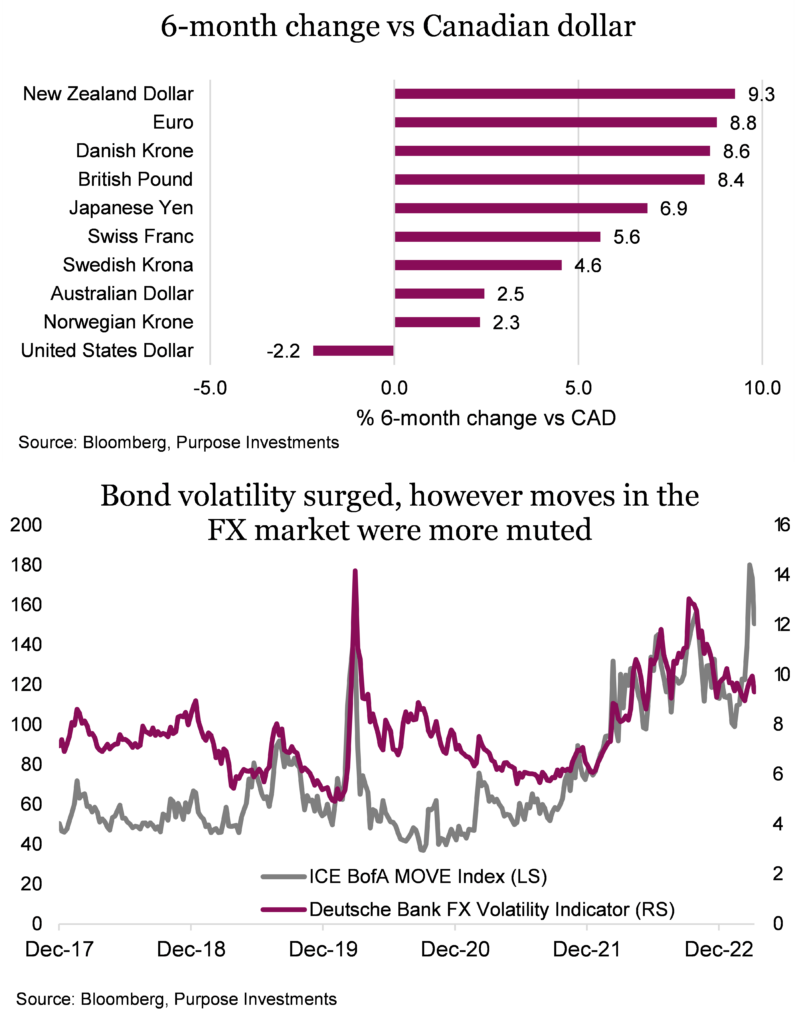
The Canadian dollar has had a decent bounce this past week but it’s the worst performing G10 currency outside of the U.S. dollar over the past six months. It’s moved largely in line with the U.S. dollar, recently up a little over 2% over this timeframe. This is tiny compared to the substantial moves for other global currencies as detailed in the chart on the right. What is clear is that the U.S. dollar index, now 11% off its peak roughly six months ago remains under considerable pressure.
Crazy bond market volatility
Yield differentials are big driver in the currency markets. The Move Index, also known as the bond market VIX, remains near a record peak. Currency volatility measured by the Deutsche Bank Currency Volatility Index (CVIX) saw a spike but not nearly to the same degree as the bond market. Implied volatility in major currency pairs jumped this month as concerns about the US banking sector weighed on the dollar. Still, the moves have been far from crisis levels. The bond market swiftly moved to price in three cuts by year end. This is a big swing from a month ago where the Fed pivot was all but priced out of the market. It’s amazing what a little stress in the banking system can bring about.
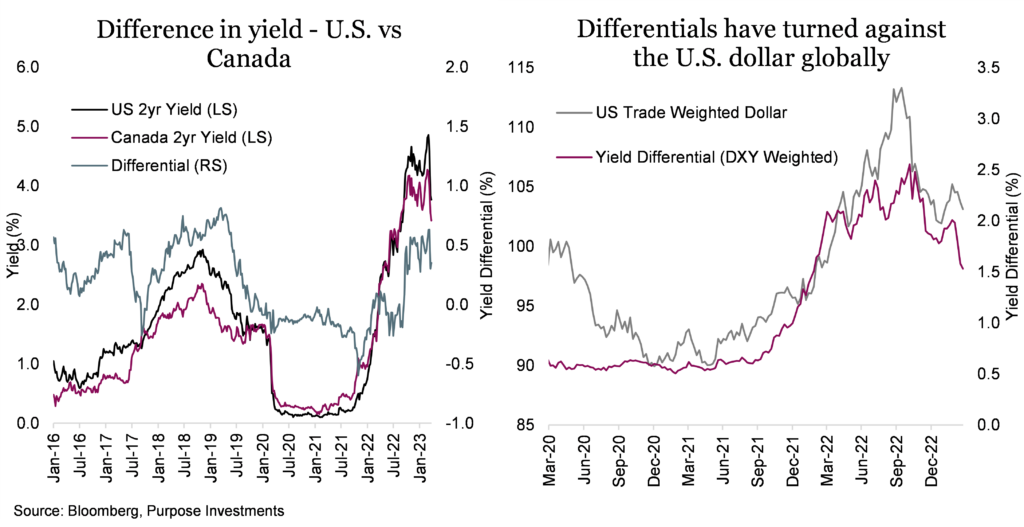
Uncertainty over the path of future rate hikes has brought about some big moves in currency markets, but the volatility is nowhere near as pronounced. Short-term yield differentials are a key driver for the FX market and the wild swings in the bond market do not occur in isolation. The charts below outline the U.S. Dollar index with customized DXY weighted differentials index. Differentials have continued to move significantly lower for treasuries versus other global bonds which argues for a considerably weaker U.S. dollar. In Canada the decline is not as pronounced but the yield premium for U.S. bonds for two-year bonds has taken a noticeable step back from a high of 80bps earlier in March down to just over 30bps. It’s at the low end of the range from the start of the year and is at risk of seeing further compression.
Taking this into consideration, the prospects for the U.S. dollar have taken a decided turn for the worse. The dollar dominated last year as the Fed raised interest rates more quickly than many other countries to tame inflation. But the so-called “king dollar” has stumbled.
It’s not completely rosy for the C$ either, but relative to other international currencies the U.S. dollar just isn’t the safe haven you would expect. Banking crisis especially on home turf can do that. We continue to see elevated risk for the U.S. dollar to fall after as the market shifts to rapidly pricing in rate cuts. The maturing Fed tightening cycle is a big problem for long time dollar bulls. Globally, yields may remain higher for longer, which will also put additional pressure on the U.S. dollar.
Portfolio implications
Rising global yields and stronger global growth are two primary reasons why we continue to prefer unhedged international exposure. For U.S. exposure we anticipate a somewhat more rangebound market for CAD/USD. At the low end of the range, around $0.72 CAD/USD we’re comfortable beginning to add some partial hedges to portfolios. We very briefly reached these levels this month and would expect to be more active on an eventual retest. The U.S. dollar will likely catch a bid in a REAL recession scenario which is why we are wary of fully hedging. However, at this level we believe there is a decent risk reward. On the other side a recession is when you absolutely want to dial up the tactical currency hedges. This is typically when risk-on currencies like the Canadian dollar tend to shine. For now, cash is king, but from a Canadian perspective you might not want to place all your bets in the king dollar.
Sign up here to receive the Market Ethos by email.
Source: Charts are sourced to Bloomberg L.P., Purpose Investments Inc., and Richardson Wealth unless otherwise noted.
*Authors:
Purpose Investments: Craig Basinger, Chief Market Strategist; Derek Benedet, Portfolio Manager
Richardson Wealth: Andrew Innis, Analyst; Phil Kwon, Head of Portfolio Analytics; Mark Letchumanan, Research; An Nguyen, VP Investment Services
Disclaimers
Richardson Wealth Limited
The opinions expressed in this report are the opinions of the author and readers should not assume they reflect the opinions or recommendations of Richardson Wealth Limited or its affiliates. Assumptions, opinions and estimates constitute the author’s judgment as of the date of this material and are subject to change without notice. We do not warrant the completeness or accuracy of this material, and it should not be relied upon as such. Before acting on any recommendation, you should consider whether it is suitable for your particular circumstances and, if necessary, seek professional advice. Past performance is not indicative of future results. The comments contained herein are general in nature and are not intended to be, nor should be construed to be, legal or tax advice to any particular individual. Accordingly, individuals should consult their own legal or tax advisors for advice with respect to the tax consequences to them.
Richardson Wealth is a trademark of James Richardson & Sons, Limited used under license.
Purpose Investments Inc.
Purpose Investments Inc. is a registered securities entity. Commissions, trailing commissions, management fees and expenses all may be associated with investment funds. Please read the prospectus before investing. If the securities are purchased or sold on a stock exchange, you may pay more or receive less than the current net asset value. Investment funds are not guaranteed, their values change frequently and past performance may not be repeated.
Forward Looking Statements
Forward-looking statements are based on current expectations, estimates, forecasts and projections based on beliefs and assumptions made by author. These statements involve risks and uncertainties and are not guarantees of future performance or results and no assurance can be given that these estimates and expectations will prove to have been correct, and actual outcomes and results may differ materially from what is expressed, implied or projected in such forward-looking statements. Assumptions, opinions and estimates constitute the author’s judgment as of the date of this material and are subject to change without notice. Neither Purpose Investments nor Richardson Wealth warrant the completeness or accuracy of this material, and it should not be relied upon as such. Before acting on any recommendation, you should consider whether it is suitable for your particular circumstances and, if necessary, seek professional advice. Past performance is not indicative of future results. These estimates and expectations involve risks and uncertainties and are not guarantees of future performance or results and no assurance can be given that these estimates and expectations will prove to have been correct, and actual outcomes and results may differ materially from what is expressed, implied or projected in such forward-looking statements. Unless required by applicable law, it is not undertaken, and specifically disclaimed, that there is any intention or obligation to update or revise the forward-looking statements, whether as a result of new information, future events or otherwise.
Before acting on any recommendation, you should consider whether it is suitable for your particular circumstances and, if necessary, seek professional advice.
The particulars contained herein were obtained from sources which we believe are reliable, but are not guaranteed by us and may be incomplete. This is not an official publication or research report of either Richardson Wealth or Purpose Investments, and this is not to be used as a solicitation in any jurisdiction.
This document is not for public distribution, is for informational purposes only, and is not being delivered to you in the context of an offering of any securities, nor is it a recommendation or solicitation to buy, hold or sell any security.
Richardson Wealth Limited, Member Canadian Investor Protection Fund.
Richardson Wealth is a trademark of James Richardson & Sons, Limited used under license.